Indonesia Hollow Glassware Market (2026-2032) | Industry, Companies, Forecast, Value, Analysis, Trends, Growth, Size, Revenue, Share & Outlook
Market Forecast By Type (Medium Borosilicate, High Borosilicate), By Application (Solar Energy Tubes, Laboratory Apparatus, Heat Glassware, Chemical Tubes, Pharmaceutical Packaging, Others) And Competitive Landscape
| Product Code: ETC043028 | Publication Date: Jul 2023 | Updated Date: Jun 2026 | Product Type: Report | |
| Publisher: 6Wresearch | Author: Ravi Bhandari | No. of Pages: 70 | No. of Figures: 35 | No. of Tables: 5 |
Indonesia Hollow Glassware Market Summary
The indonesia hollow glassware market was estimated at USD 424 Million in 2025 and is projected to reach USD 560 Million by 2032, growing at a CAGR of 5.7% from 2026 to 2032.
Indonesia Hollow Glassware Market Growth Rate Analysis (2021-2032)
The Indonesian hollow glassware market has exhibited a dynamic growth pattern over recent years, rebounding from a slight decline of -0.9% in 2021 to robust increases of 4.1% in 2022 and 5.7% in 2023. This upward trend reflects heightened consumer demand driven by a surge in hospitality and dining sectors, alongside growing investments in local manufacturing infrastructure. The subsequent years forecast steady growth, with rates maintaining above 5% through 2028. Factors such as technological advancements in production processes and rising disposable incomes are set to further bolster the market. Additionally, government initiatives promoting sustainable practices are expected to enhance demand for eco-friendly glassware, fueling ongoing expansion until at least 2032.
Indonesia Hollow Glassware Market Year-wise Growth Rate and Key Drivers
This graph highlights how the Indonesia Hollow Glassware Market has steadily grown over the past five years, supported by major growth factors.
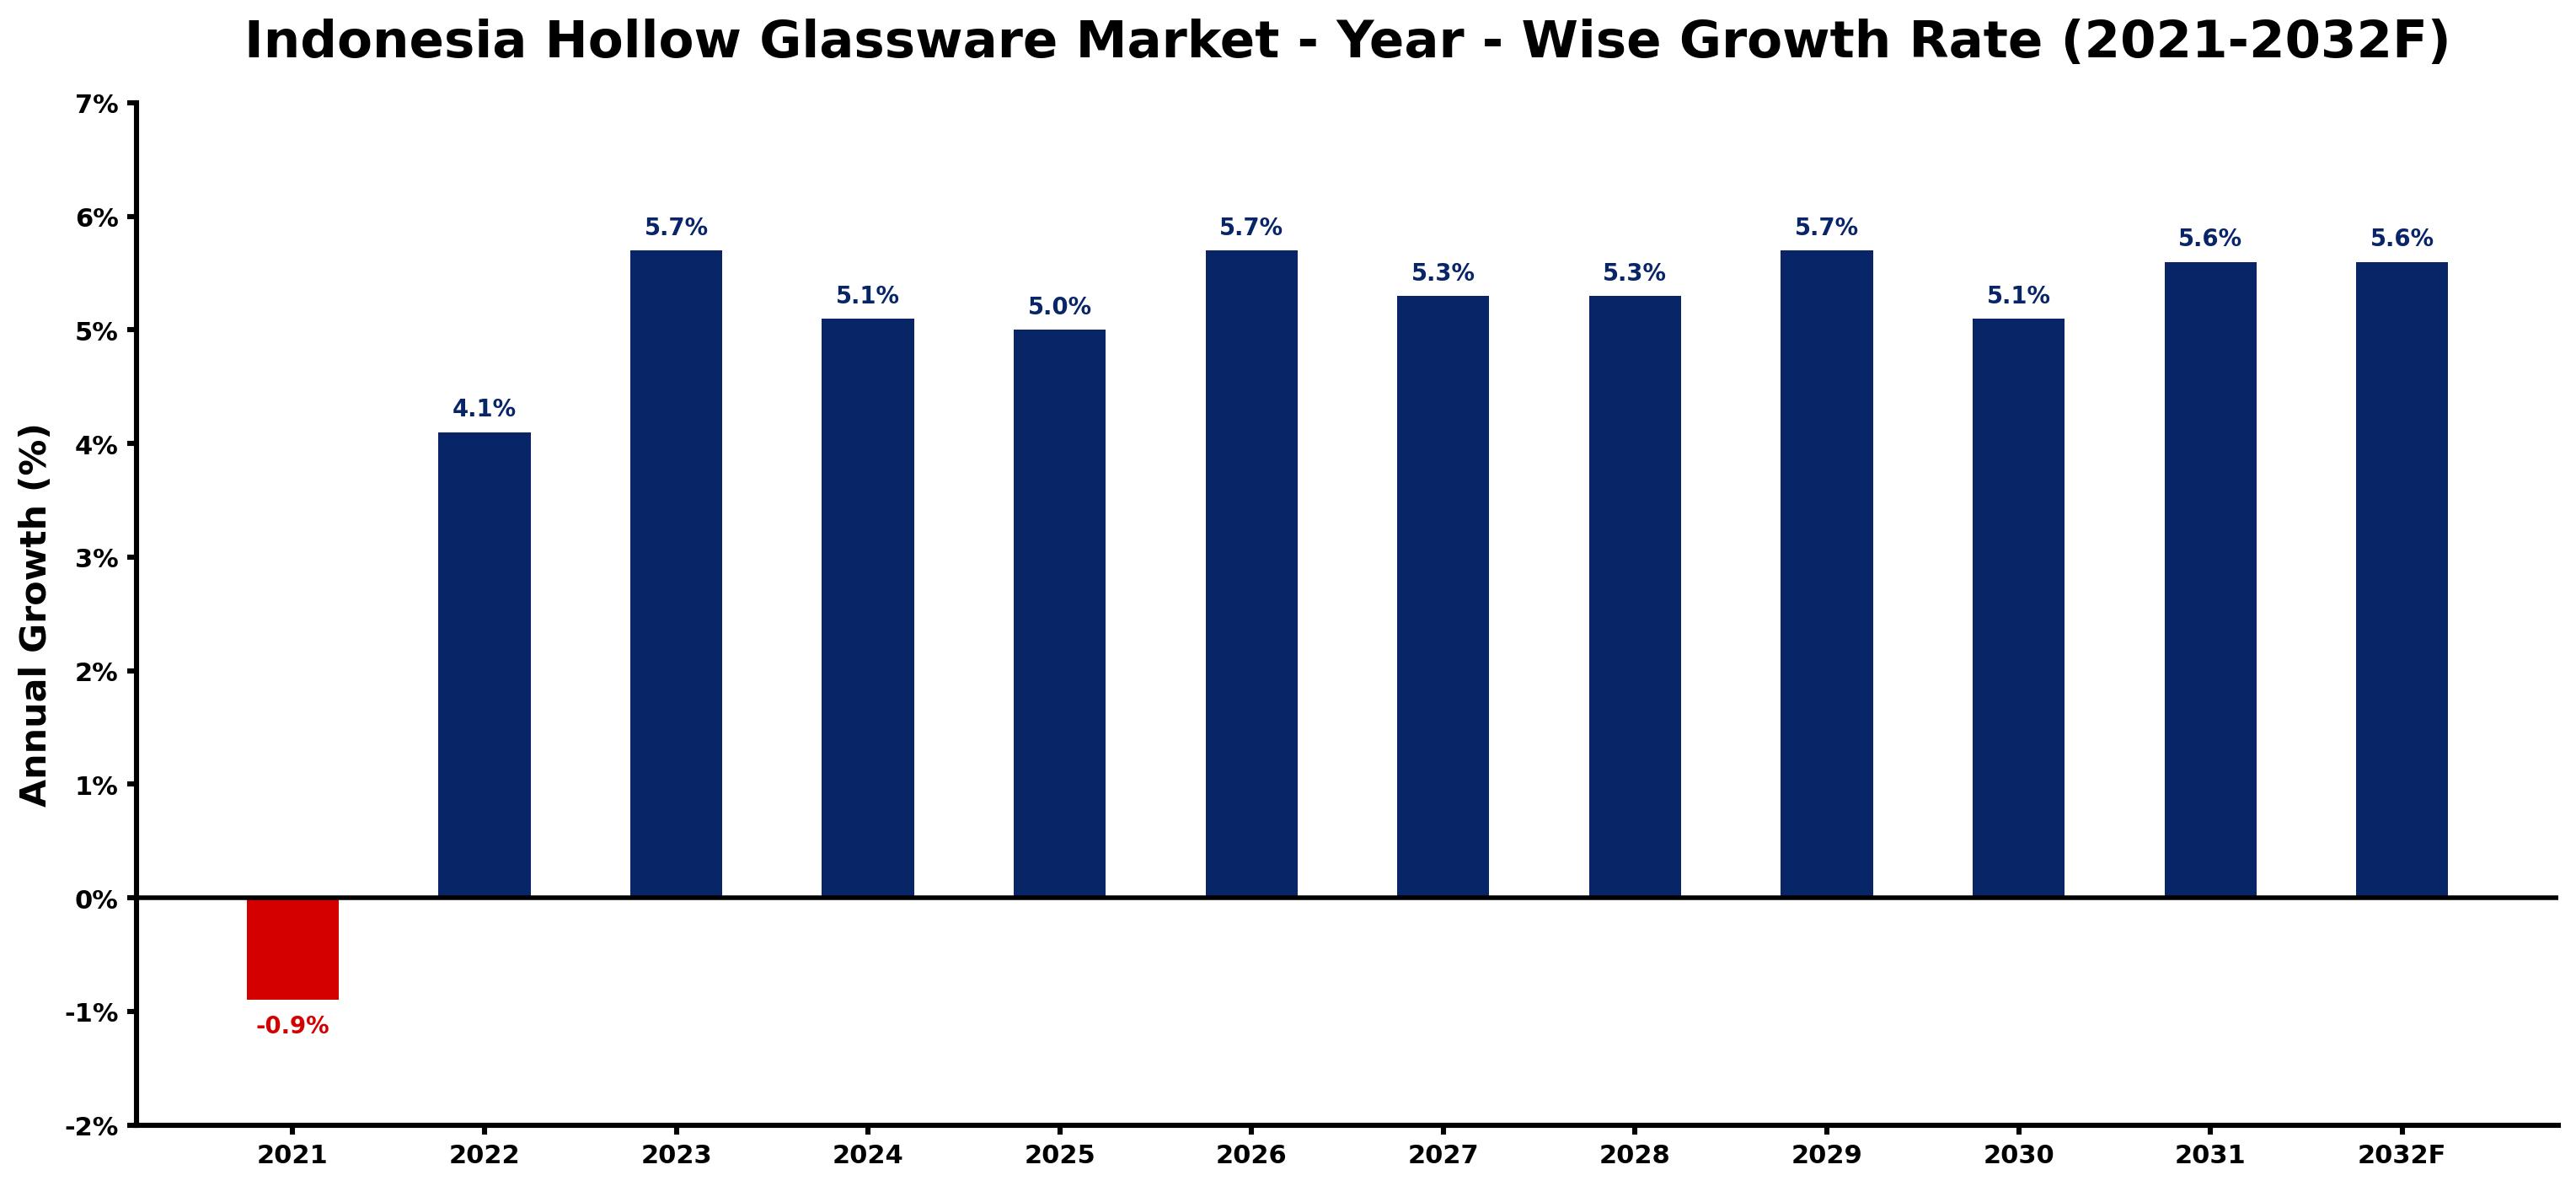
The table below presents the year wise growth rates along with the key drivers influencing the market
| Year | Growth Rate | Major Drivers |
| 2021 | -0.9% | A significant decline in tourism due to pandemic restrictions curtailed demand for decorative glassware in hospitality venues. |
| 2022 | 4.1% | Local artisans began leveraging social media, enhancing their market visibility and sales. |
| 2023 | 5.7% | Sustainable living trends prompted consumers to favor eco-friendly glassware over plastics. |
| 2024 | 5.1% | E-commerce platforms expanded offerings, making glassware more accessible across Indonesia. |
| 2025 | 5.0% | Cafes and restaurants focused on aesthetic dining experiences, increasing demand for unique designs. |
| 2026 | 5.7% | Tourism recovery led to higher sales in souvenir glassware, boosting local manufacturers. |
| 2027 | 5.3% | Architectural projects prioritized modern glass designs, elevating the hollow glassware sector. |
| 2028 | 5.3% | Export opportunities emerged, as international markets sought Indonesian glassware for diversity. |
| 2029 | 5.7% | Lifestyle shifts encouraged online home décor shopping, highlighting the appeal of glassware. |
| 2030 | 5.1% | Community-based crafts gained popularity, promoting traditional glassware techniques nationwide. |
| 2031 | 5.6% | Investment in renewable energy enabled better manufacturing processes for glass producers. |
| 2032 | 5.6% | Technological enhancements in production fostered innovation in designs and customization options. |
Note - Market size estimations and growth projections presented in this report are based on 6Wresearch's advanced forecasting approach, validated with industry datasets as of June 2026.
Indonesia Hollow Glassware Market Synopsis
The Indonesia Hollow Glassware Market is projected to reach 5.7% and witness significant growth during the forecast period (2026-2032). The growth trajectory of this market is driven by escalating consumer demand for hollow glassware products, which are increasingly favored for their aesthetic appeal and functionality in storing food, beverages, medicines, and other liquids. These products are widely utilized in both residential and commercial settings, including homes and restaurants, highlighting their versatility and consumer preference.
Indonesia Hollow Glassware Market Growth Drivers
Several factors underpin the anticipated growth of the Indonesia Hollow Glassware Market. The following are key drivers:
- The rising population in Indonesia has led to increased consumption of hollow glassware, as more households and businesses require these products.
- Improving disposable incomes allow consumers greater purchasing power, enabling them to opt for premium hollow glassware options.
- The availability of diverse designs and styles caters to varying consumer preferences, encouraging wider adoption of these products across different user segments.
- Growing concerns about health and hygiene are motivating consumers to choose durable hollow glassware, known for its non-toxic properties and ease of cleaning.
- The inflow of affordable imports from countries such as China and India introduces competitive pricing in the market, providing consumers with more choices.
Indonesia Hollow Glassware Market Trends and Opportunities
The Indonesia Hollow Glassware Market is poised to benefit from various emerging trends, including:
- Innovative product designs that incorporate contemporary aesthetics are attracting younger demographics, who prioritize style along with functionality.
- Online retail platforms are becoming increasingly popular for purchasing hollow glassware, offering consumers convenience and access to a broader range of products.
- Environmentally sustainable practices in manufacturing hollow glassware are gaining traction, as consumers become more conscientious about their environmental impact.
- Collaborations between manufacturers and designers are leading to the creation of exclusive collections that appeal to niche markets, enhancing brand loyalty.
- Promotional campaigns aimed at raising awareness about the health benefits associated with glassware usage are gaining momentum and stimulating demand.
Indonesia Hollow Glassware Market Challenges and Restraints
Despite the positive outlook, the Indonesia Hollow Glassware Market faces several challenges:
- Intense competition among local suppliers can lead to price wars, which may affect profitability for domestic manufacturers.
- Importation of lower-cost products from countries with cheaper labor provides substantial competition, making it difficult for local businesses to remain price competitive.
- Stringent environmental regulations can limit the sourcing of local raw materials, thus impacting production capabilities and costs for domestic manufacturers.
- Fluctuations in market demand, influenced by economic conditions, can create unpredictability for manufacturers, affecting production planning and inventory management.
- Consumer preferences shifting towards alternative materials, such as plastics and metals, may pose a threat to market growth if not addressed effectively.
Indonesia Hollow Glassware Market Government Investment and Initiatives
The Indonesian government is actively supporting the hollow glassware sector through various initiatives and investments aimed at promoting local manufacturing. Recent policies have focused on enhancing the competitiveness of domestic producers through financial incentives, such as tax exemptions for manufacturing facilities set up in certain regions. Additionally, public investments in infrastructure development are facilitating easier access to raw materials and markets. The government has also encouraged sustainable manufacturing practices, pushing for innovations that align with environmental regulations while stimulating economic growth in the sector. Programs aimed at boosting exports of Indonesian-made hollow glassware are further positioning the industry for global competitiveness.
Indonesia Hollow Glassware Market Latest Developments (May 2025 - June 2026)
The period between May 2025 and June 2026 has seen notable developments in the Indonesia Hollow Glassware Market. Manufacturers are increasingly focused on integrating innovative technologies to enhance production efficiency while maintaining high-quality standards. Moreover, sustainability movements have encouraged companies to invest in eco-friendly materials and practices, thereby appealing to a conscientious consumer base. Engagement in digital marketing strategies to improve brand visibility has grown, with many companies leveraging social media platforms to reach wider audiences. Additionally, partnerships with local designers have become a key strategy for introducing appealing product lines that cater to contemporary tastes.
Indonesia Hollow Glassware Market - Key Attractiveness of the Report
- 10 Years of Market Numbers
- Historical Data Starting from 2022 to 2025
- Base Year: 2025
- Forecast Data until 2032
- Key Performance Indicators Impacting the Market
- Major Upcoming Developments and Projects
Key Highlights of the Report:
- Indonesia Hollow Glassware Market Outlook
- Market Size of Indonesia Hollow Glassware Market, 2025
- Forecast of Indonesia Hollow Glassware Market, 2032F
- Historical Data and Forecast of Indonesia Hollow Glassware Revenues & Volume for the Period 2022-2032F
- Indonesia Hollow Glassware Market Trend Evolution
- Indonesia Hollow Glassware Market Drivers and Challenges
- Indonesia Hollow Glassware Price Trends
- Indonesia Hollow Glassware Porter's Five Forces
- Indonesia Hollow Glassware Industry Life Cycle
- Historical Data and Forecast of Indonesia Hollow Glassware Market Revenues & Volume By Type for the Period 2022-2032F
- Historical Data and Forecast of Indonesia Hollow Glassware Market Revenues & Volume By Medium Borosilicate for the Period 2022-2032F
- Historical Data and Forecast of Indonesia Hollow Glassware Market Revenues & Volume By High Borosilicate for the Period 2022-2032F
- Historical Data and Forecast of Indonesia Hollow Glassware Market Revenues & Volume By Application for the Period 2022-2032F
- Historical Data and Forecast of Indonesia Hollow Glassware Market Revenues & Volume By Solar Energy Tubes for the Period 2022-2032F
- Historical Data and Forecast of Indonesia Hollow Glassware Market Revenues & Volume By Laboratory Apparatus for the Period 2022-2032F
- Historical Data and Forecast of Indonesia Hollow Glassware Market Revenues & Volume By Heat Glassware for the Period 2022-2032F
- Historical Data and Forecast of Indonesia Hollow Glassware Market Revenues & Volume By Chemical Tubes for the Period 2022-2032F
- Historical Data and Forecast of Indonesia Hollow Glassware Market Revenues & Volume By Pharmaceutical Packaging for the Period 2022-2032F
- Historical Data and Forecast of Indonesia Hollow Glassware Market Revenues & Volume By Others for the Period 2022-2032F
- Indonesia Hollow Glassware Import Export Trade Statistics
- Market Opportunity Assessment By Type
- Market Opportunity Assessment By Application
- Indonesia Hollow Glassware Top Companies Market Share
- Indonesia Hollow Glassware Competitive Benchmarking By Technical and Operational Parameters
- Indonesia Hollow Glassware Company Profiles
- Indonesia Hollow Glassware Key Strategic Recommendations
Frequently Asked Questions About the Market Study (FAQs):
The growth is primarily driven by rising consumer demand for durable and aesthetically pleasing products, increased disposable incomes, and a growing population.
Government initiatives are providing financial support and incentives for local manufacturers, promoting sustainable practices, and enhancing the market's competitive landscape.
Manufacturers are contending with intense competition, fluctuating market demands, and regulatory challenges, which can impact their operational viability.
Key trends include increasing online sales, innovative product designs, and a growing focus on sustainability and health-conscious production practices.
6Wresearch actively monitors the Indonesia Hollow Glassware Market and publishes its comprehensive annual report, highlighting emerging trends, growth drivers, revenue analysis, and forecast outlook. Our insights help businesses to make data-backed strategic decisions with ongoing market dynamics. Our analysts track relevent industries related to the Indonesia Hollow Glassware Market, allowing our clients with actionable intelligence and reliable forecasts tailored to emerging regional needs.
Yes, we provide customisation as per your requirements. To learn more, feel free to contact us on sales@6wresearch.com
1 Executive Summary |
2 Introduction |
2.1 Key Highlights of the Report |
2.2 Report Description |
2.3 Market Scope & Segmentation |
2.4 Research Methodology |
2.5 Assumptions |
3 Indonesia Hollow Glassware Market Overview |
3.1 Indonesia Country Macro Economic Indicators |
3.2 Indonesia Hollow Glassware Market Revenues & Volume, 2022 & 2032F |
3.3 Indonesia Hollow Glassware Market - Industry Life Cycle |
3.4 Indonesia Hollow Glassware Market - Porter's Five Forces |
3.5 Indonesia Hollow Glassware Market Revenues & Volume Share, By Type, 2022 & 2032F |
3.6 Indonesia Hollow Glassware Market Revenues & Volume Share, By Application, 2022 & 2032F |
4 Indonesia Hollow Glassware Market Dynamics |
4.1 Impact Analysis |
4.2 Market Drivers |
4.3 Market Restraints |
5 Indonesia Hollow Glassware Market Trends |
6 Indonesia Hollow Glassware Market, By Types |
6.1 Indonesia Hollow Glassware Market, By Type |
6.1.1 Overview and Analysis |
6.1.2 Indonesia Hollow Glassware Market Revenues & Volume, By Type, 2022-2032F |
6.1.3 Indonesia Hollow Glassware Market Revenues & Volume, By Medium Borosilicate, 2022-2032F |
6.1.4 Indonesia Hollow Glassware Market Revenues & Volume, By High Borosilicate, 2022-2032F |
6.2 Indonesia Hollow Glassware Market, By Application |
6.2.1 Overview and Analysis |
6.2.2 Indonesia Hollow Glassware Market Revenues & Volume, By Solar Energy Tubes, 2022-2032F |
6.2.3 Indonesia Hollow Glassware Market Revenues & Volume, By Laboratory Apparatus, 2022-2032F |
6.2.4 Indonesia Hollow Glassware Market Revenues & Volume, By Heat Glassware, 2022-2032F |
6.2.5 Indonesia Hollow Glassware Market Revenues & Volume, By Chemical Tubes, 2022-2032F |
6.2.6 Indonesia Hollow Glassware Market Revenues & Volume, By Pharmaceutical Packaging, 2022-2032F |
6.2.7 Indonesia Hollow Glassware Market Revenues & Volume, By Others, 2022-2032F |
7 Indonesia Hollow Glassware Market Import-Export Trade Statistics |
7.1 Indonesia Hollow Glassware Market Export to Major Countries |
7.2 Indonesia Hollow Glassware Market Imports from Major Countries |
8 Indonesia Hollow Glassware Market Key Performance Indicators |
9 Indonesia Hollow Glassware Market - Opportunity Assessment |
9.1 Indonesia Hollow Glassware Market Opportunity Assessment, By Type, 2022 & 2032F |
9.2 Indonesia Hollow Glassware Market Opportunity Assessment, By Application, 2022 & 2032F |
10 Indonesia Hollow Glassware Market - Competitive Landscape |
10.1 Indonesia Hollow Glassware Market Revenue Share, By Companies, 2025 |
10.2 Indonesia Hollow Glassware Market Competitive Benchmarking, By Operating and Technical Parameters |
11 Company Profiles |
12 Recommendations |
13 Disclaimer |
Global Go To Market Strategy - 2030
Export potential enables firms to identify high-growth global markets with greater confidence by combining advanced trade intelligence with a structured quantitative methodology. The framework analyzes emerging demand trends and country-level import patterns while integrating macroeconomic and trade datasets such as GDP and population forecasts, bilateral import–export flows, tariff structures, elasticity differentials between developed and developing economies, geographic distance, and import demand projections. Using weighted trade values from 2020–2024 as the base period to project country-to-country export potential for 2030, these inputs are operationalized through calculated drivers such as gravity model parameters, tariff impact factors, and projected GDP per-capita growth. Through an analysis of hidden potentials, demand hotspots, and market conditions that are most favorable to success, this method enables firms to focus on target countries, maximize returns, and global expansion with data, backed by accuracy.
By factoring in the projected importer demand gap that is currently unmet and could be potential opportunity, it identifies the potential for the Exporter (Country) among 190 countries, against the general trade analysis, which identifies the biggest importer or exporter.
To discover high-growth global markets and optimize your business strategy:
Click Here
Pricing
- Single User License$ 1,995
- Department License$ 2,400
- Site License$ 3,120
- Global License$ 3,795

Leadership Perspectives from Industry Events
Search
Thought Leadership and Analyst Meet


Our Clients
6WResearch In News
- India Air Conditioner Market Set for Strong Rebound in 2026 After Weather-Led Correction and GST-Driven Recovery: 6Wresearch
- ADAS in India: How Automatic Emergency Braking, Blind Spot Detection & Driver Monitoring are Transforming Road Safety
- Doha a strategic location for EV manufacturing hub: IPA Qatar
- Demand for luxury TVs surging in the GCC, says Samsung
- Empowering Growth: The Thriving Journey of Bangladesh’s Cable Industry
- Demand for luxury TVs surging in the GCC, says Samsung
Latest Reports
- Nicaragua RPG Gaming Market (2026-2032)
- New Zealand RPG Gaming Market (2026-2032)
- Netherlands RPG Gaming Market (2026-2032)
- Nauru RPG Gaming Market (2026-2032)
- Namibia RPG Gaming Market (2026-2032)
- Mozambique RPG Gaming Market (2026-2032)
- Montenegro RPG Gaming Market (2026-2032)
- Mongolia RPG Gaming Market (2026-2032)
- Monaco RPG Gaming Market (2026-2032)
- Micronesia RPG Gaming Market (2026-2032)
Industry Events and Analyst Meet

HIMTEX 2026

India Refining Summit 2026

India EV Show 2026

EV tech India Expo 2026

Auto Tech Asia 2026
Whitepaper
- Middle East & Africa Commercial Security Market Click here to view more.
- Middle East & Africa Fire Safety Systems & Equipment Market Click here to view more.
- GCC Drone Market Click here to view more.
- Middle East Lighting Fixture Market Click here to view more.
- GCC Physical & Perimeter Security Market Click here to view more.