Indonesia Hydrographic Equipment Market (2026-2032) | Challenges, Investment Trends, Strategic Insights, Trends, Segmentation, Restraints, Share, Industry, Companies, Pricing Analysis, Outlook, Forecast, Value, Analysis, Size, Strategy, Segments, Supply, Drivers, Competitive, Growth, Opportunities, Revenue, Consumer Insights, Demand, Competition
Market Forecast By Product Type (Multibeam Sonars, Single-beam Sonars, LiDAR Systems, Side Scan Sonars, Sub-bottom Profilers), By Technology Type (Acoustic Imaging, Underwater Drones, Satellite Navigation, AI-based Data Processing, Remote Sensing), By End User (Marine Surveyors, Naval Forces, Offshore Drilling Companies, Fisheries, Research Institutions), By Application (Seabed Mapping, Defense Applications, Ocean Exploration, Aquatic Habitat Studies, Geophysical Studies) And Competitive Landscape
| Product Code: ETC12502159 | Publication Date: Apr 2025 | Updated Date: Mar 2026 | Product Type: Market Research Report | |
| Publisher: 6Wresearch | Author: Dhaval Chaurasia | No. of Pages: 65 | No. of Figures: 34 | No. of Tables: 19 |
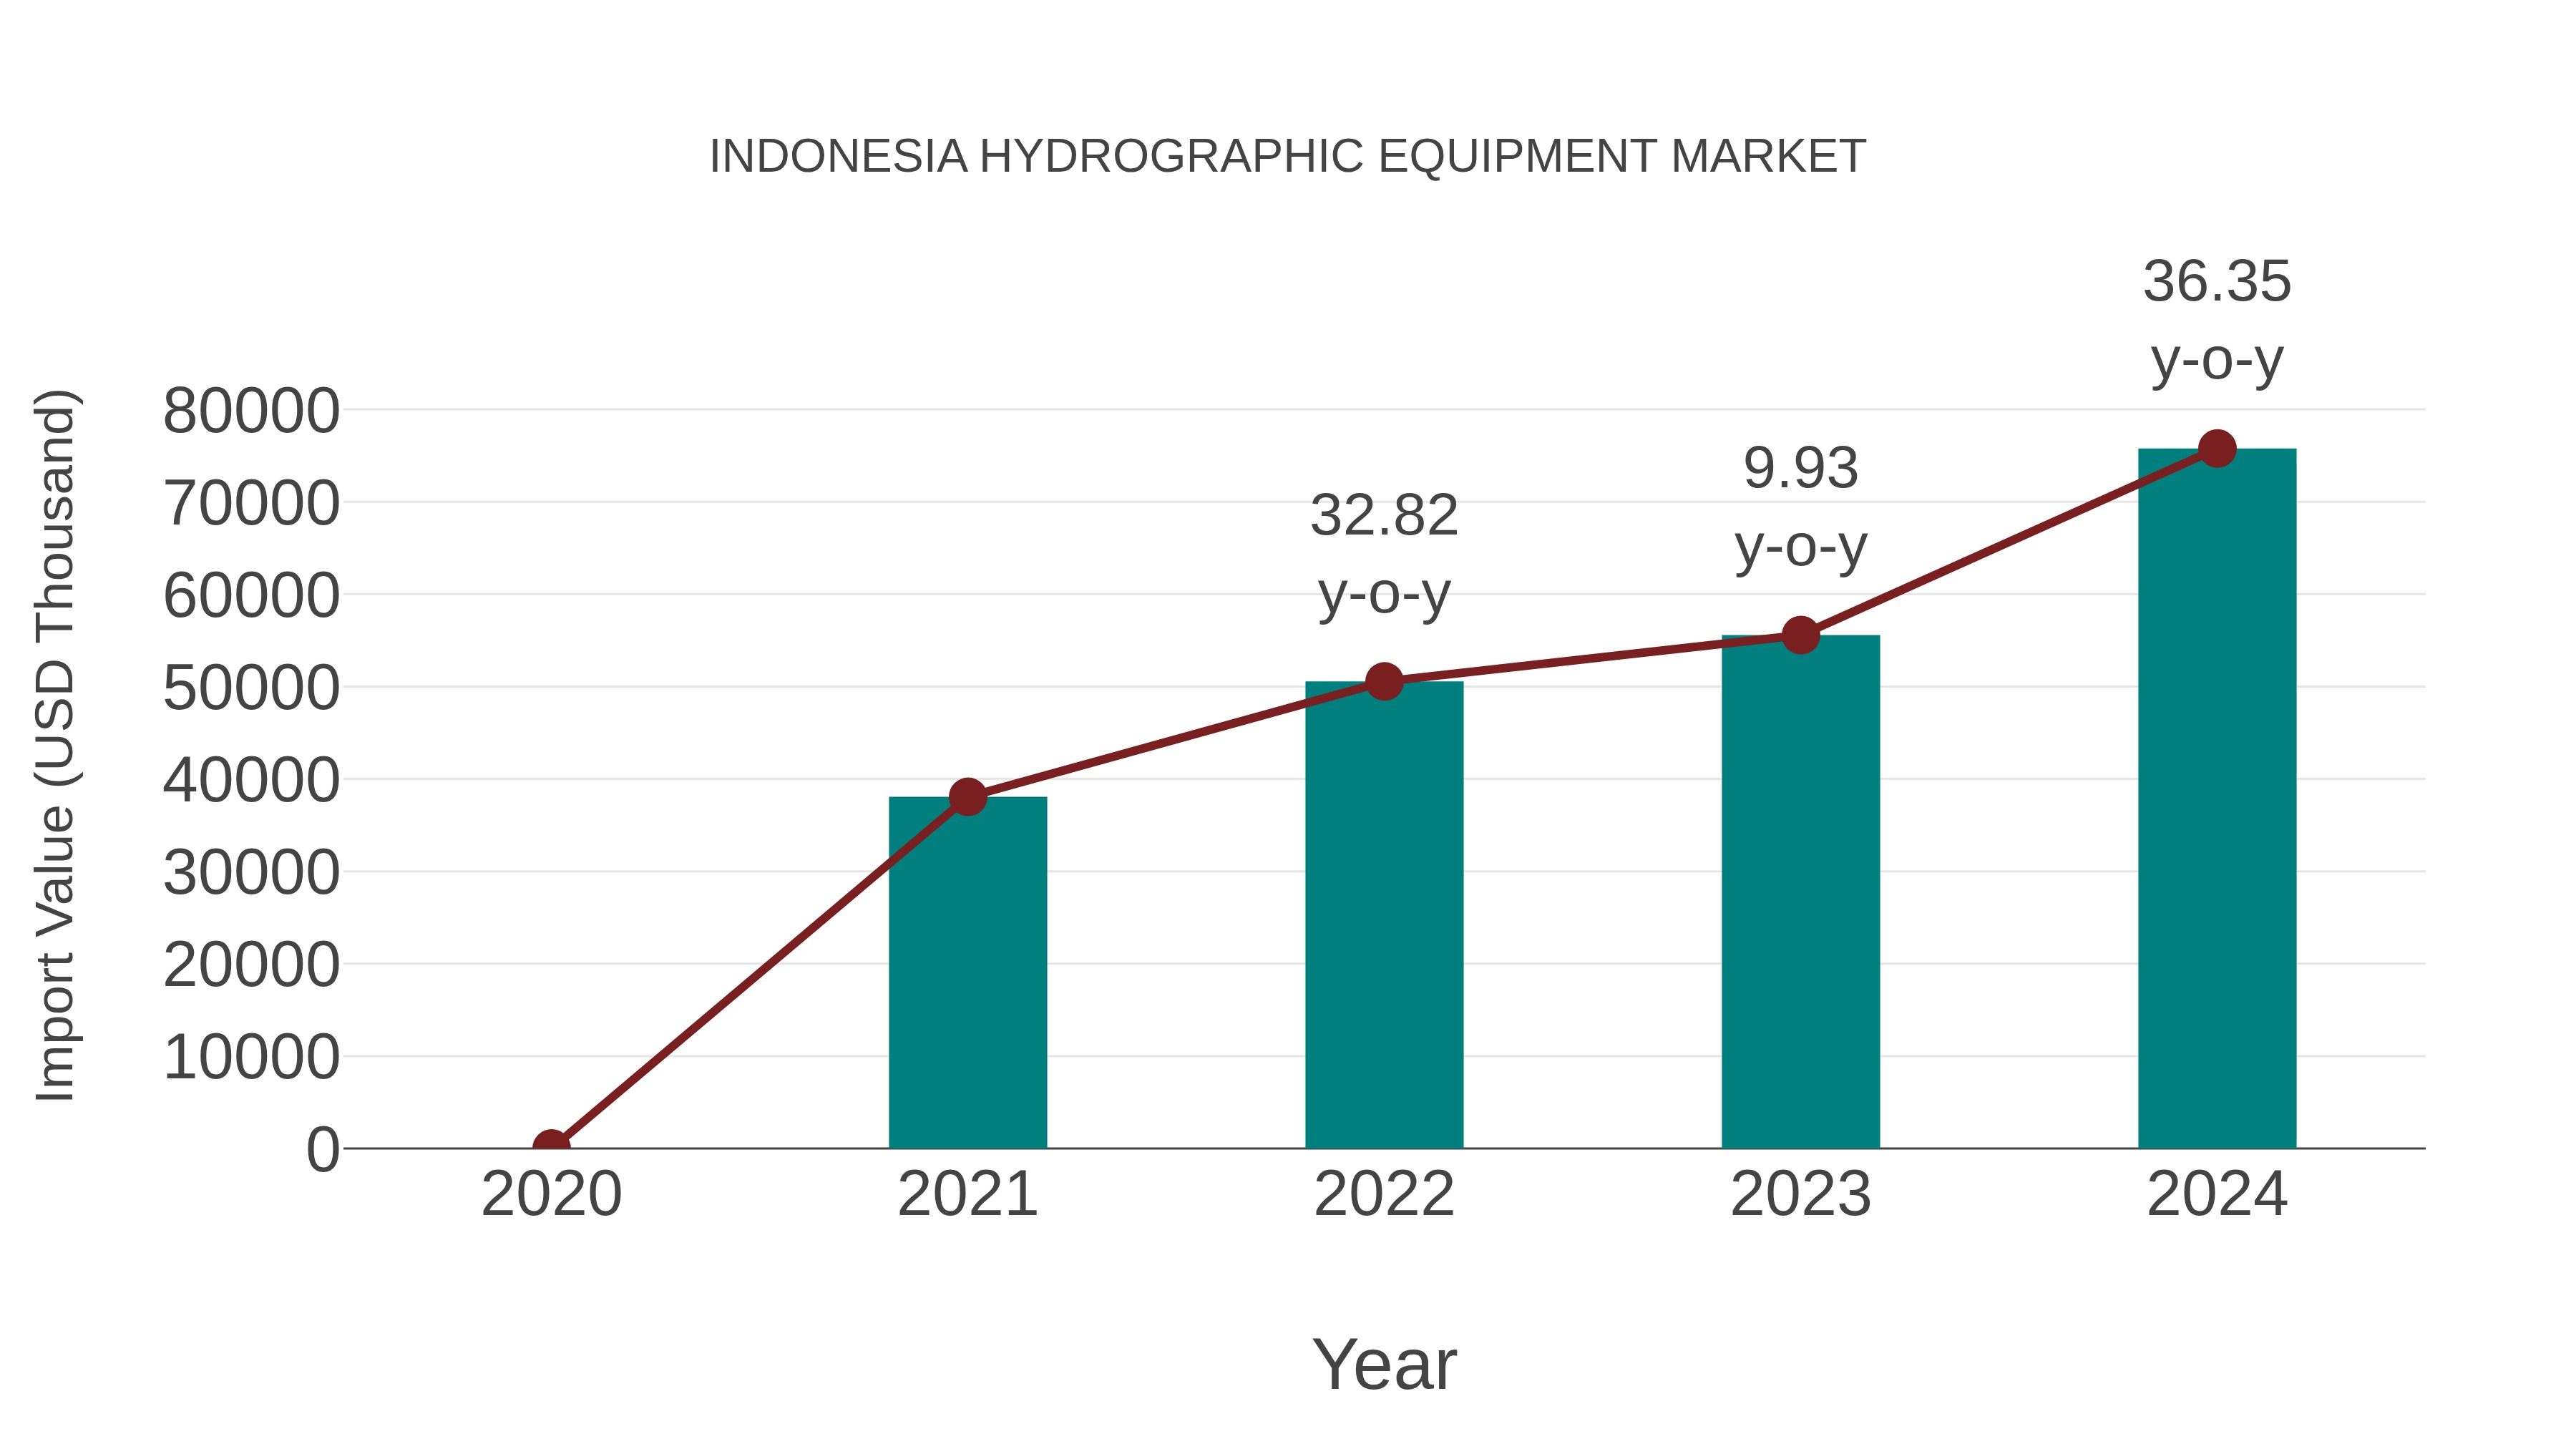
Indonesia Hydrographic Equipment Market: Import Trend Analysis
In the Indonesia hydrographic equipment market, the import trend showed significant growth from 2023 to 2024, with a growth rate of 36.35%. The compound annual growth rate (CAGR) for imports between 2020 and 2024 stood at 25.8%. This substantial increase in import momentum can be attributed to a rising demand for advanced hydrographic equipment in Indonesia, reflecting the country`s commitment to enhancing maritime operations and infrastructure.
Indonesia Hydrographic Equipment Market Overview
The Indonesia hydrographic equipment market is experiencing steady growth driven by increasing investments in marine infrastructure development and offshore activities. Key players in the market offer a range of hydrographic surveying equipment such as echo sounders, sonar systems, GPS receivers, and bathymetric sensors. The demand for accurate and reliable hydrographic data for navigation, marine resource exploration, coastal zone management, and environmental monitoring is fueling the adoption of advanced equipment in Indonesia. Government initiatives to enhance maritime safety and security further contribute to market growth. The market is competitive with both domestic and international players vying for market share, leading to product innovation and strategic partnerships. Overall, the Indonesia hydrographic equipment market is poised for continued expansion as the country focuses on developing its maritime capabilities.
Indonesia Hydrographic Equipment Market Trends
The hydrographic equipment market in Indonesia is experiencing a growing demand for advanced technologies such as multibeam echo sounders, autonomous underwater vehicles (AUVs), and LiDAR systems. These technologies are being increasingly adopted for accurate mapping of the seabed, coastal areas, and waterways for various applications including marine construction, offshore energy exploration, and environmental monitoring. The market is also witnessing a shift towards integrated solutions that combine hydrographic surveying equipment with data processing software for efficient data analysis and visualization. Furthermore, there is a rising focus on enhancing the sustainability and environmental impact of hydrographic operations, leading to the development of eco-friendly equipment and solutions. Overall, the Indonesia hydrographic equipment market is evolving towards more advanced, efficient, and sustainable technologies to meet the growing demands of the maritime industry.
Indonesia Hydrographic Equipment Market Challenges
In the Indonesia hydrographic equipment market, challenges primarily revolve around the need for continuous technological advancements to meet the evolving requirements of the maritime industry. Factors such as limited awareness about the benefits of hydrographic equipment, high initial investment costs, and the presence of counterfeit products pose challenges for market growth. Additionally, the complex regulatory environment and the necessity for skilled professionals to operate and maintain the equipment further contribute to the challenges faced by companies operating in this sector. Overcoming these hurdles requires strategic partnerships, targeted marketing efforts, and a focus on innovation to develop cost-effective solutions tailored to the specific needs of the Indonesian market.
Indonesia Hydrographic Equipment Market Investment Opportunities
The Indonesia hydrographic equipment market presents several investment opportunities for interested stakeholders. With the country`s vast archipelago and increasing focus on maritime activities, there is a growing demand for modern hydrographic equipment such as sonar systems, bathymetric sensors, and unmanned underwater vehicles. Investing in innovative technologies and solutions that can improve accuracy, efficiency, and data integration in hydrographic surveys and mapping operations can be lucrative. Additionally, there is potential for partnerships with government agencies, research institutions, and private companies involved in marine exploration and resource management. As Indonesia continues to prioritize maritime development and safety, investing in the hydrographic equipment market can offer long-term growth prospects and contribute to the country`s sustainable marine industry.
Indonesia Hydrographic Equipment Market Government Policy
In Indonesia, the government has implemented policies aimed at promoting the development and use of hydrographic equipment for maritime activities. The Ministry of Marine Affairs and Fisheries oversees regulations related to hydrographic mapping, surveying, and navigation systems to ensure safety and efficiency in sea transport. The government has also supported initiatives to enhance the capabilities of local industries in manufacturing and supplying hydrographic equipment. Additionally, Indonesia has been actively participating in regional and international collaborations to strengthen hydrographic capabilities and promote best practices in maritime navigation. Overall, the government`s policies in Indonesia are geared towards fostering a conducive environment for the growth of the hydrographic equipment market and ensuring the country`s maritime infrastructure is well-equipped for navigation and safety.
Indonesia Hydrographic Equipment Market Future Outlook
The Indonesia hydrographic equipment market is poised for growth in the coming years, driven by increasing investments in marine infrastructure development, offshore oil and gas exploration activities, and the growing importance of maritime safety and security. The Indonesian government`s focus on enhancing maritime capabilities and ensuring sustainable marine resource management will further fuel demand for hydrographic equipment such as sonar systems, GPS devices, and unmanned underwater vehicles. Technological advancements in the sector, including the adoption of autonomous surveying solutions and advanced data processing software, are expected to drive innovation and efficiency in hydrographic data collection and analysis. Overall, the Indonesia hydrographic equipment market is likely to experience steady growth as the country continues to prioritize its maritime industry and strengthen its position as a key player in the regional marine sector.
Key Highlights of the Report:
- Indonesia Hydrographic Equipment Market Outlook
- Market Size of Indonesia Hydrographic Equipment Market,2025
- Forecast of Indonesia Hydrographic Equipment Market, 2032
- Historical Data and Forecast of Indonesia Hydrographic Equipment Revenues & Volume for the Period 2022-2032F
- Indonesia Hydrographic Equipment Market Trend Evolution
- Indonesia Hydrographic Equipment Market Drivers and Challenges
- Indonesia Hydrographic Equipment Price Trends
- Indonesia Hydrographic Equipment Porter's Five Forces
- Indonesia Hydrographic Equipment Industry Life Cycle
- Historical Data and Forecast of Indonesia Hydrographic Equipment Market Revenues & Volume By Product Type for the Period 2022-2032F
- Historical Data and Forecast of Indonesia Hydrographic Equipment Market Revenues & Volume By Multibeam Sonars for the Period 2022-2032F
- Historical Data and Forecast of Indonesia Hydrographic Equipment Market Revenues & Volume By Single-beam Sonars for the Period 2022-2032F
- Historical Data and Forecast of Indonesia Hydrographic Equipment Market Revenues & Volume By LiDAR Systems for the Period 2022-2032F
- Historical Data and Forecast of Indonesia Hydrographic Equipment Market Revenues & Volume By Side Scan Sonars for the Period 2022-2032F
- Historical Data and Forecast of Indonesia Hydrographic Equipment Market Revenues & Volume By Sub-bottom Profilers for the Period 2022-2032F
- Historical Data and Forecast of Indonesia Hydrographic Equipment Market Revenues & Volume By Technology Type for the Period 2022-2032F
- Historical Data and Forecast of Indonesia Hydrographic Equipment Market Revenues & Volume By Acoustic Imaging for the Period 2022-2032F
- Historical Data and Forecast of Indonesia Hydrographic Equipment Market Revenues & Volume By Underwater Drones for the Period 2022-2032F
- Historical Data and Forecast of Indonesia Hydrographic Equipment Market Revenues & Volume By Satellite Navigation for the Period 2022-2032F
- Historical Data and Forecast of Indonesia Hydrographic Equipment Market Revenues & Volume By AI-based Data Processing for the Period 2022-2032F
- Historical Data and Forecast of Indonesia Hydrographic Equipment Market Revenues & Volume By Remote Sensing for the Period 2022-2032F
- Historical Data and Forecast of Indonesia Hydrographic Equipment Market Revenues & Volume By End User for the Period 2022-2032F
- Historical Data and Forecast of Indonesia Hydrographic Equipment Market Revenues & Volume By Marine Surveyors for the Period 2022-2032F
- Historical Data and Forecast of Indonesia Hydrographic Equipment Market Revenues & Volume By Naval Forces for the Period 2022-2032F
- Historical Data and Forecast of Indonesia Hydrographic Equipment Market Revenues & Volume By Offshore Drilling Companies for the Period 2022-2032F
- Historical Data and Forecast of Indonesia Hydrographic Equipment Market Revenues & Volume By Fisheries for the Period 2022-2032F
- Historical Data and Forecast of Indonesia Hydrographic Equipment Market Revenues & Volume By Research Institutions for the Period 2022-2032F
- Historical Data and Forecast of Indonesia Hydrographic Equipment Market Revenues & Volume By Application for the Period 2022-2032F
- Historical Data and Forecast of Indonesia Hydrographic Equipment Market Revenues & Volume By Seabed Mapping for the Period 2022-2032F
- Historical Data and Forecast of Indonesia Hydrographic Equipment Market Revenues & Volume By Defense Applications for the Period 2022-2032F
- Historical Data and Forecast of Indonesia Hydrographic Equipment Market Revenues & Volume By Ocean Exploration for the Period 2022-2032F
- Historical Data and Forecast of Indonesia Hydrographic Equipment Market Revenues & Volume By Aquatic Habitat Studies for the Period 2022-2032F
- Historical Data and Forecast of Indonesia Hydrographic Equipment Market Revenues & Volume By Geophysical Studies for the Period 2022-2032F
- Indonesia Hydrographic Equipment Import Export Trade Statistics
- Market Opportunity Assessment By Product Type
- Market Opportunity Assessment By Technology Type
- Market Opportunity Assessment By End User
- Market Opportunity Assessment By Application
- Indonesia Hydrographic Equipment Top Companies Market Share
- Indonesia Hydrographic Equipment Competitive Benchmarking By Technical and Operational Parameters
- Indonesia Hydrographic Equipment Company Profiles
- Indonesia Hydrographic Equipment Key Strategic Recommendations
Indonesia Hydrographic Equipment Market (2026-2032): FAQs
6Wresearch actively monitors the Indonesia Hydrographic Equipment Market and publishes its comprehensive annual report, highlighting emerging trends, growth drivers, revenue analysis, and forecast outlook. Our insights help businesses to make data-backed strategic decisions with ongoing market dynamics. Our analysts track relevent industries related to the Indonesia Hydrographic Equipment Market, allowing our clients with actionable intelligence and reliable forecasts tailored to emerging regional needs.
Yes, we provide customisation as per your requirements. To learn more, feel free to contact us on sales@6wresearch.com
1 Executive Summary |
2 Introduction |
2.1 Key Highlights of the Report |
2.2 Report Description |
2.3 Market Scope & Segmentation |
2.4 Research Methodology |
2.5 Assumptions |
3 Indonesia Hydrographic Equipment Market Overview |
3.1 Indonesia Country Macro Economic Indicators |
3.2 Indonesia Hydrographic Equipment Market Revenues & Volume, 2022 & 2032F |
3.3 Indonesia Hydrographic Equipment Market - Industry Life Cycle |
3.4 Indonesia Hydrographic Equipment Market - Porter's Five Forces |
3.5 Indonesia Hydrographic Equipment Market Revenues & Volume Share, By Product Type, 2022 & 2032F |
3.6 Indonesia Hydrographic Equipment Market Revenues & Volume Share, By Technology Type, 2022 & 2032F |
3.7 Indonesia Hydrographic Equipment Market Revenues & Volume Share, By End User, 2022 & 2032F |
3.8 Indonesia Hydrographic Equipment Market Revenues & Volume Share, By Application, 2022 & 2032F |
4 Indonesia Hydrographic Equipment Market Dynamics |
4.1 Impact Analysis |
4.2 Market Drivers |
4.2.1 Increasing demand for hydrographic equipment due to growth in marine activities and infrastructure development in Indonesia |
4.2.2 Technological advancements in hydrographic equipment leading to improved efficiency and accuracy |
4.2.3 Government initiatives and investments in coastal and maritime development projects |
4.3 Market Restraints |
4.3.1 High initial investment costs associated with advanced hydrographic equipment |
4.3.2 Lack of skilled professionals and expertise in operating hydrographic equipment |
4.3.3 Challenges related to data accuracy and interpretation in hydrographic surveys |
5 Indonesia Hydrographic Equipment Market Trends |
6 Indonesia Hydrographic Equipment Market, By Types |
6.1 Indonesia Hydrographic Equipment Market, By Product Type |
6.1.1 Overview and Analysis |
6.1.2 Indonesia Hydrographic Equipment Market Revenues & Volume, By Product Type, 2022-2032F |
6.1.3 Indonesia Hydrographic Equipment Market Revenues & Volume, By Multibeam Sonars, 2022-2032F |
6.1.4 Indonesia Hydrographic Equipment Market Revenues & Volume, By Single-beam Sonars, 2022-2032F |
6.1.5 Indonesia Hydrographic Equipment Market Revenues & Volume, By LiDAR Systems, 2022-2032F |
6.1.6 Indonesia Hydrographic Equipment Market Revenues & Volume, By Side Scan Sonars, 2022-2032F |
6.1.7 Indonesia Hydrographic Equipment Market Revenues & Volume, By Sub-bottom Profilers, 2022-2032F |
6.2 Indonesia Hydrographic Equipment Market, By Technology Type |
6.2.1 Overview and Analysis |
6.2.2 Indonesia Hydrographic Equipment Market Revenues & Volume, By Acoustic Imaging, 2022-2032F |
6.2.3 Indonesia Hydrographic Equipment Market Revenues & Volume, By Underwater Drones, 2022-2032F |
6.2.4 Indonesia Hydrographic Equipment Market Revenues & Volume, By Satellite Navigation, 2022-2032F |
6.2.5 Indonesia Hydrographic Equipment Market Revenues & Volume, By AI-based Data Processing, 2022-2032F |
6.2.6 Indonesia Hydrographic Equipment Market Revenues & Volume, By Remote Sensing, 2022-2032F |
6.3 Indonesia Hydrographic Equipment Market, By End User |
6.3.1 Overview and Analysis |
6.3.2 Indonesia Hydrographic Equipment Market Revenues & Volume, By Marine Surveyors, 2022-2032F |
6.3.3 Indonesia Hydrographic Equipment Market Revenues & Volume, By Naval Forces, 2022-2032F |
6.3.4 Indonesia Hydrographic Equipment Market Revenues & Volume, By Offshore Drilling Companies, 2022-2032F |
6.3.5 Indonesia Hydrographic Equipment Market Revenues & Volume, By Fisheries, 2022-2032F |
6.3.6 Indonesia Hydrographic Equipment Market Revenues & Volume, By Research Institutions, 2022-2032F |
6.4 Indonesia Hydrographic Equipment Market, By Application |
6.4.1 Overview and Analysis |
6.4.2 Indonesia Hydrographic Equipment Market Revenues & Volume, By Seabed Mapping, 2022-2032F |
6.4.3 Indonesia Hydrographic Equipment Market Revenues & Volume, By Defense Applications, 2022-2032F |
6.4.4 Indonesia Hydrographic Equipment Market Revenues & Volume, By Ocean Exploration, 2022-2032F |
6.4.5 Indonesia Hydrographic Equipment Market Revenues & Volume, By Aquatic Habitat Studies, 2022-2032F |
6.4.6 Indonesia Hydrographic Equipment Market Revenues & Volume, By Geophysical Studies, 2022-2032F |
7 Indonesia Hydrographic Equipment Market Import-Export Trade Statistics |
7.1 Indonesia Hydrographic Equipment Market Export to Major Countries |
7.2 Indonesia Hydrographic Equipment Market Imports from Major Countries |
8 Indonesia Hydrographic Equipment Market Key Performance Indicators |
8.1 Utilization rate of hydrographic equipment |
8.2 Rate of adoption of new hydrographic technologies in the market |
8.3 Frequency of government tenders or contracts related to hydrographic surveys |
8.4 Number of training programs or certifications for hydrographic equipment operation |
8.5 Customer satisfaction scores for hydrographic equipment performance and accuracy |
9 Indonesia Hydrographic Equipment Market - Opportunity Assessment |
9.1 Indonesia Hydrographic Equipment Market Opportunity Assessment, By Product Type, 2022 & 2032F |
9.2 Indonesia Hydrographic Equipment Market Opportunity Assessment, By Technology Type, 2022 & 2032F |
9.3 Indonesia Hydrographic Equipment Market Opportunity Assessment, By End User, 2022 & 2032F |
9.4 Indonesia Hydrographic Equipment Market Opportunity Assessment, By Application, 2022 & 2032F |
10 Indonesia Hydrographic Equipment Market - Competitive Landscape |
10.1 Indonesia Hydrographic Equipment Market Revenue Share, By Companies, 2025 |
10.2 Indonesia Hydrographic Equipment Market Competitive Benchmarking, By Operating and Technical Parameters |
11 Company Profiles |
12 Recommendations |
13 Disclaimer |
Export potential assessment - trade Analytics for 2030
Export potential enables firms to identify high-growth global markets with greater confidence by combining advanced trade intelligence with a structured quantitative methodology. The framework analyzes emerging demand trends and country-level import patterns while integrating macroeconomic and trade datasets such as GDP and population forecasts, bilateral import–export flows, tariff structures, elasticity differentials between developed and developing economies, geographic distance, and import demand projections. Using weighted trade values from 2020–2024 as the base period to project country-to-country export potential for 2030, these inputs are operationalized through calculated drivers such as gravity model parameters, tariff impact factors, and projected GDP per-capita growth. Through an analysis of hidden potentials, demand hotspots, and market conditions that are most favorable to success, this method enables firms to focus on target countries, maximize returns, and global expansion with data, backed by accuracy.
By factoring in the projected importer demand gap that is currently unmet and could be potential opportunity, it identifies the potential for the Exporter (Country) among 190 countries, against the general trade analysis, which identifies the biggest importer or exporter.
To discover high-growth global markets and optimize your business strategy:
Click Here
Pricing
- Single User License$ 1,995
- Department License$ 2,400
- Site License$ 3,120
- Global License$ 3,795

Search
Thought Leadership and Analyst Meet


Our Clients
Latest Reports
- Canada Cloud CFD Market (2026-2032) | Size & Revenue, Industry, Growth, Competitive Landscape, Forecast, Segmentation, Value, Outlook, Trends, Share, Analysis, Companies
- Taiwan Food Delivery Platform Market (2026-2032) | Companies, Outlook, Analysis, Trends, Value, Revenue, Segmentation, Share, Forecast, Competitive Landscape, Growth, Size & Forecast
- United Kingdom (UK) Long-term Care Insurance Market (2026-2032) | Growth, Share, Consumer Insights, Drivers, Opportunities, Competition, Pricing Analysis, Segments, Restraints, Companies, Competitive, Value, Outlook, Size, Demand, Analysis, Challenges, Strategic Insights, Investment Trends, Revenue, Trends, Supply, Forecast
- United Kingdom (UK) Long Term Care Market (2026-2032) | Companies, Outlook, Analysis, Trends, Value, Revenue, Segmentation, Share, Forecast, Competitive Landscape, Growth, Size & Forecast
- Iraq Insulation and Waterproofing Market (2026-2032) | Outlook, Drivers, Growth, Size, Share, Industry, Revenue, Trends, Demand, Competitive, Strategic Insights, Opportunities, Segments, Companies, Challenges, Strategy, Consumer Insights, Analysis, Investment Trends, Value, Segmentation, Forecast, Restraints
- India Switchgear Market Outlook (2026-2032) | Size, Share, Trends, Growth, Revenue, Forecast, Analysis, Value, Outlook
- Pakistan Contraceptive Implants Market (2025-2031) | Demand, Growth, Size, Share, Industry, Pricing Analysis, Competitive, Strategic Insights, Strategy, Consumer Insights, Analysis, Investment Trends, Opportunities, Revenue, Segments, Value, Segmentation, Supply, Forecast, Restraints, Outlook, Competition, Drivers, Trends, Companies, Challenges
- Sri Lanka Packaging Market (2026-2032) | Outlook, Competition, Drivers, Trends, Demand, Pricing Analysis, Competitive, Strategic Insights, Companies, Challenges, Strategy, Consumer Insights, Analysis, Investment Trends, Opportunities, Growth, Size, Share, Industry, Revenue, Segments, Value, Segmentation, Supply, Forecast, Restraints
- India Kids Watches Market (2026-2032) | Strategy, Consumer Insights, Analysis, Investment Trends, Opportunities, Growth, Size, Share, Industry, Revenue, Segments, Value, Segmentation, Supply, Forecast, Restraints, Outlook, Competition, Drivers, Trends, Demand, Pricing Analysis, Competitive, Strategic Insights, Companies, Challenges
- Saudi Arabia Core Assurance Service Market (2025-2031) | Strategy, Consumer Insights, Analysis, Investment Trends, Opportunities, Growth, Size, Share, Industry, Revenue, Segments, Value, Segmentation, Supply, Forecast, Restraints, Outlook, Competition, Drivers, Trends, Demand, Pricing Analysis, Competitive, Strategic Insights, Companies, Challenges
Industry Events and Analyst Meet

India EV Show 2026

EV tech India Expo 2026

Auto Tech Asia 2026

Battery Tech India 2026

Smart Production Solutions Guangzhou 2026
Whitepaper
- Middle East & Africa Commercial Security Market Click here to view more.
- Middle East & Africa Fire Safety Systems & Equipment Market Click here to view more.
- GCC Drone Market Click here to view more.
- Middle East Lighting Fixture Market Click here to view more.
- GCC Physical & Perimeter Security Market Click here to view more.
6WResearch In News
- Doha a strategic location for EV manufacturing hub: IPA Qatar
- Demand for luxury TVs surging in the GCC, says Samsung
- Empowering Growth: The Thriving Journey of Bangladesh’s Cable Industry
- Demand for luxury TVs surging in the GCC, says Samsung
- Video call with a traditional healer? Once unthinkable, it’s now common in South Africa
- Intelligent Buildings To Smooth GCC’s Path To Net Zero