Indonesia Hydrographic Survey Sensing Systems Market (2026-2032) | Competitive, Pricing Analysis, Analysis, Strategic Insights, Supply, Segments, Revenue, Competition, Trends, Consumer Insights, Strategy, Opportunities, Challenges, Size, Demand, Value, Growth, Restraints, Industry, Drivers, Investment Trends, Companies, Segmentation, Share, Outlook, Forecast
Market Forecast By Product Type (Single Beam Echosounders, Multibeam Echosounders, Side Scan Sonars, Sub-bottom Profilers, LiDAR-based Systems), By Technology Type (Sonar Systems, High-Frequency Sensors, Acoustic Imaging, Seismic Technology, Light Detection and Ranging), By End User (Research Institutions, Government Agencies, Offshore Drilling Companies, Environmental Agencies, Maritime Industry), By Application (Bathymetric Surveying, Seafloor Mapping, Pipeline Inspection, Geological Studies, Coastal Engineering) And Competitive Landscape
| Product Code: ETC12502543 | Publication Date: Apr 2025 | Updated Date: Feb 2026 | Product Type: Market Research Report | |
| Publisher: 6Wresearch | Author: Sachin Kumar Rai | No. of Pages: 65 | No. of Figures: 34 | No. of Tables: 19 |
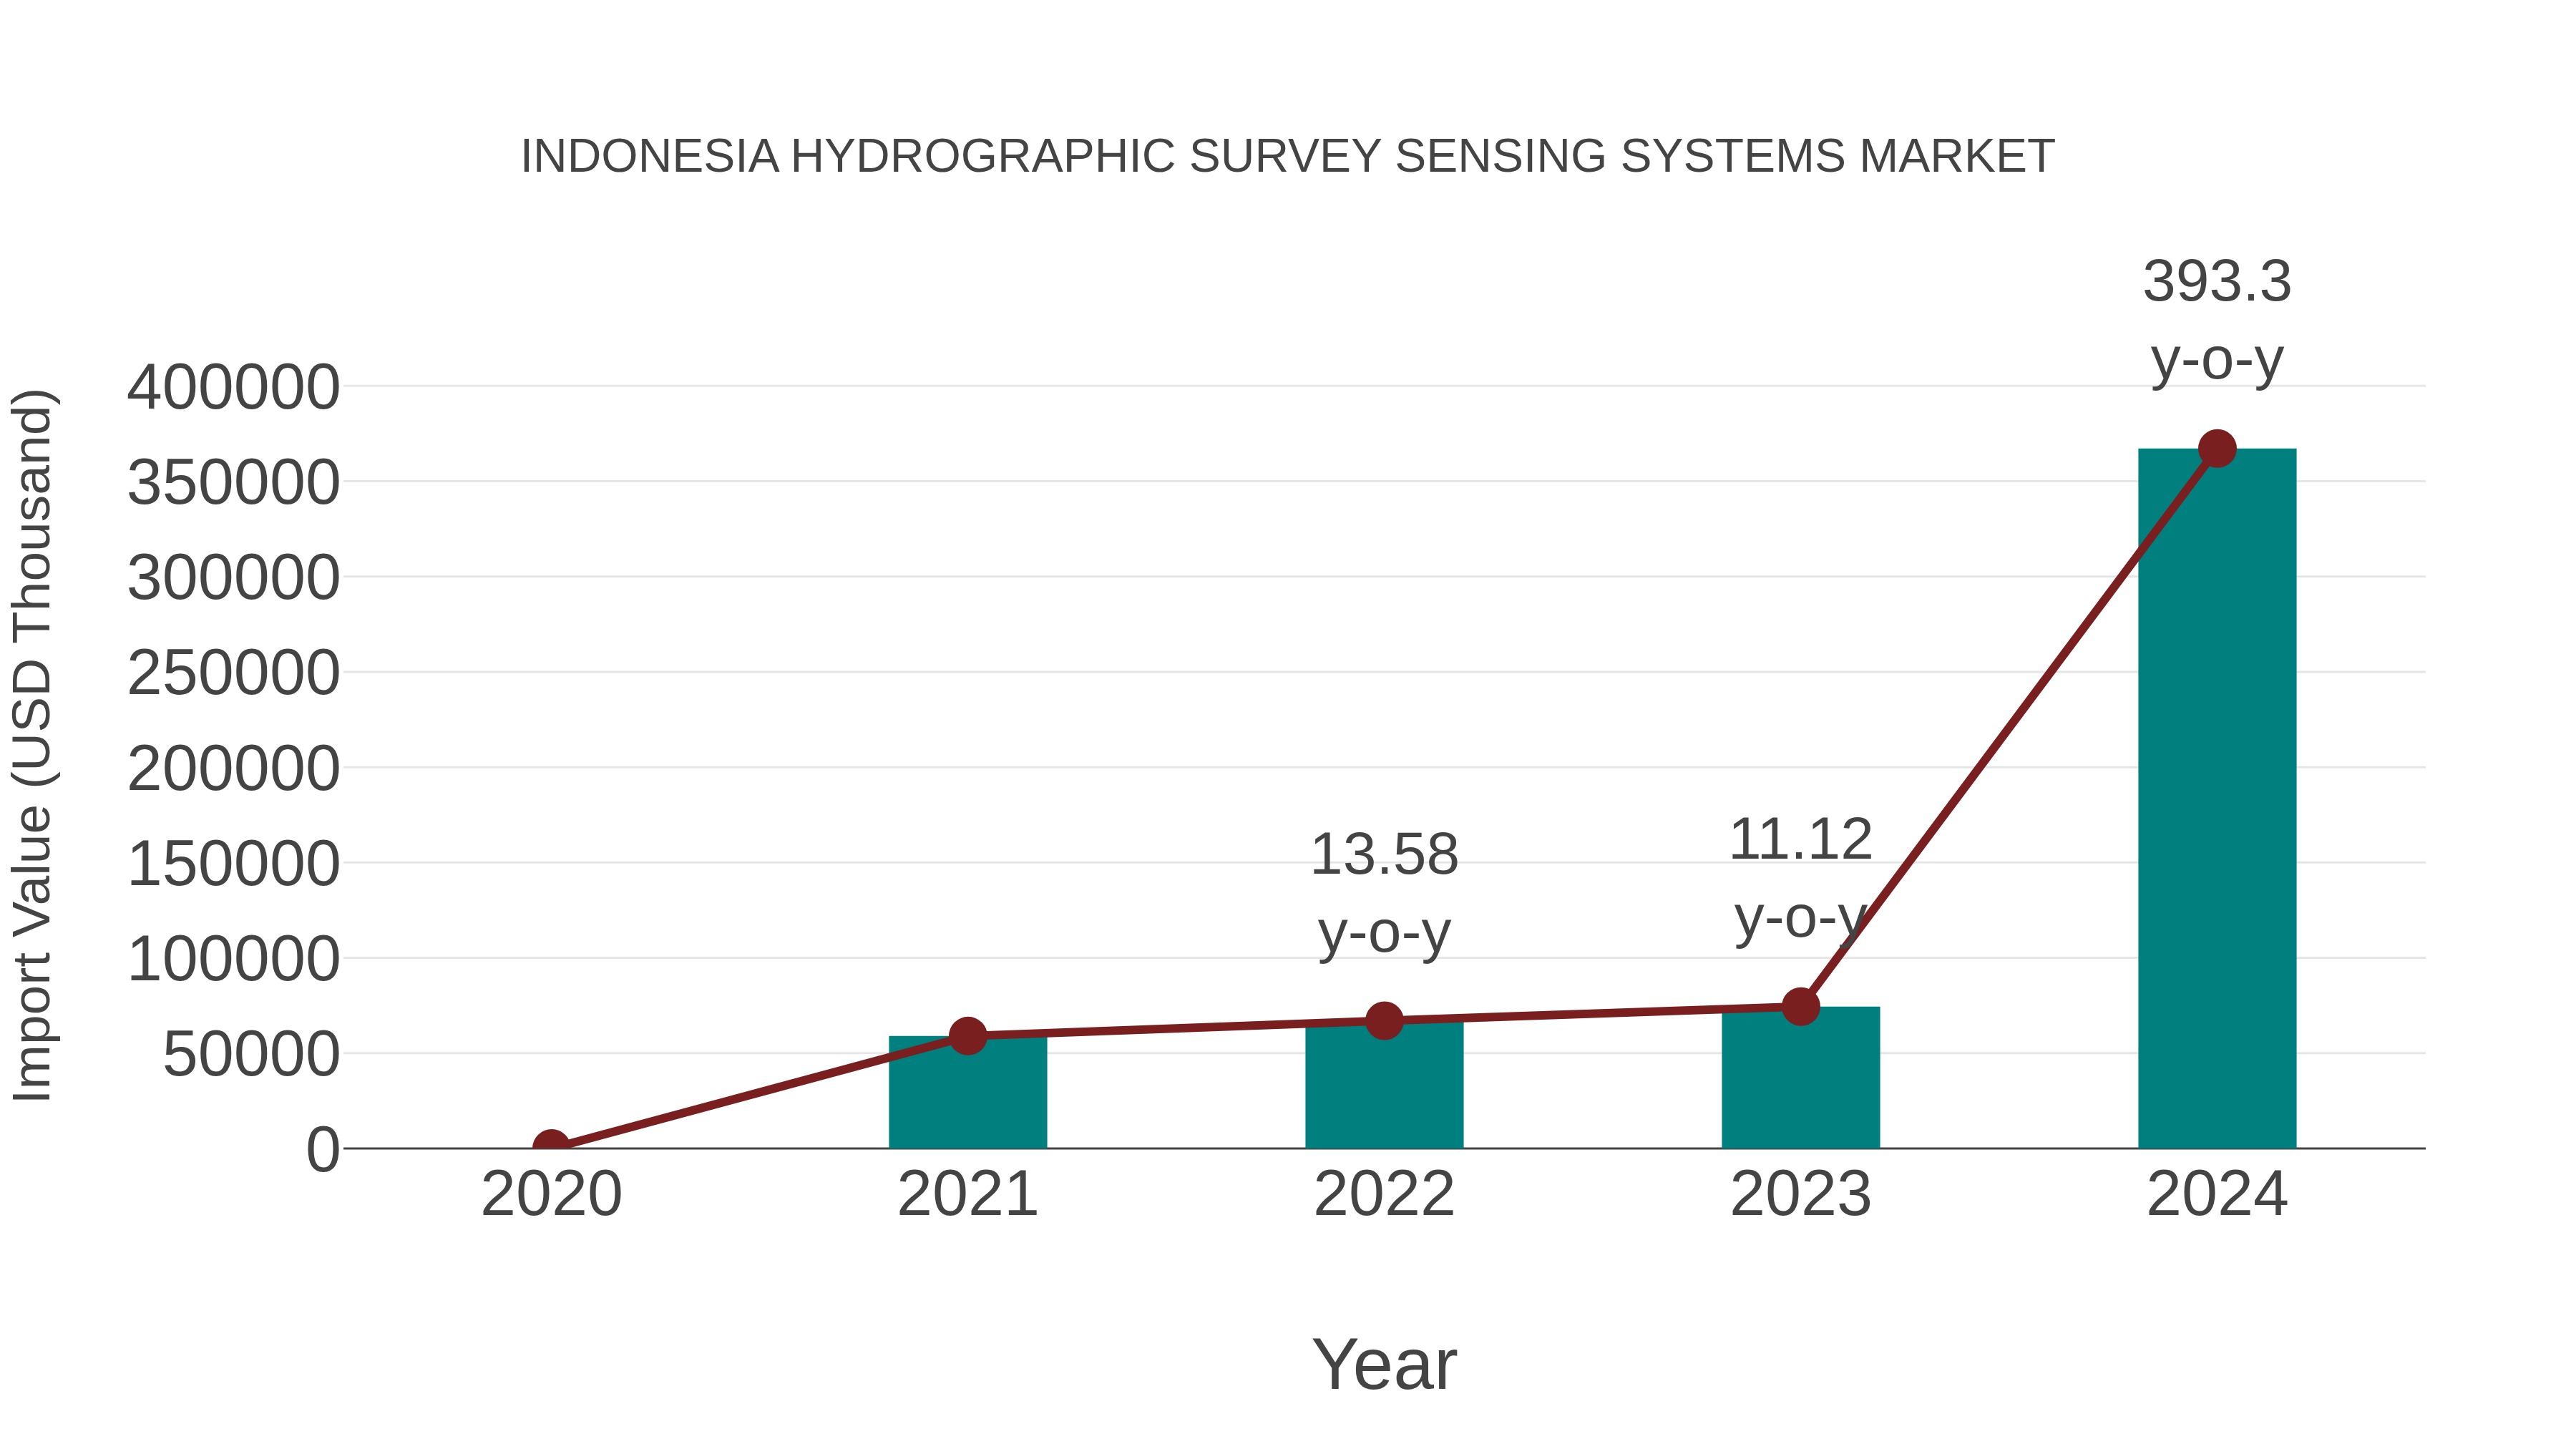
Indonesia Hydrographic Survey Sensing Systems Market: Import Trend Analysis
In 2024, Indonesia`s import momentum for hydrographic survey sensing systems experienced significant growth, with a 393.3% increase from 2023. The compound annual growth rate (CAGR) from 2020 to 2024 stood at 83.96%. This surge in imports can be attributed to a heightened demand for advanced technology in marine surveying applications, reflecting a shift towards more sophisticated systems in the market.
Key Highlights of the Report:
- Indonesia Hydrographic Survey Sensing Systems Market Outlook
- Market Size of Indonesia Hydrographic Survey Sensing Systems Market, 2025
- Forecast of Indonesia Hydrographic Survey Sensing Systems Market, 2032
- Historical Data and Forecast of Indonesia Hydrographic Survey Sensing Systems Revenues & Volume for the Period 2022-2032F
- Indonesia Hydrographic Survey Sensing Systems Market Trend Evolution
- Indonesia Hydrographic Survey Sensing Systems Market Drivers and Challenges
- Indonesia Hydrographic Survey Sensing Systems Price Trends
- Indonesia Hydrographic Survey Sensing Systems Porter's Five Forces
- Indonesia Hydrographic Survey Sensing Systems Industry Life Cycle
- Historical Data and Forecast of Indonesia Hydrographic Survey Sensing Systems Market Revenues & Volume By Product Type for the Period 2022-2032F
- Historical Data and Forecast of Indonesia Hydrographic Survey Sensing Systems Market Revenues & Volume By Single Beam Echosounders for the Period 2022-2032F
- Historical Data and Forecast of Indonesia Hydrographic Survey Sensing Systems Market Revenues & Volume By Multibeam Echosounders for the Period 2022-2032F
- Historical Data and Forecast of Indonesia Hydrographic Survey Sensing Systems Market Revenues & Volume By Side Scan Sonars for the Period 2022-2032F
- Historical Data and Forecast of Indonesia Hydrographic Survey Sensing Systems Market Revenues & Volume By Sub-bottom Profilers for the Period 2022-2032F
- Historical Data and Forecast of Indonesia Hydrographic Survey Sensing Systems Market Revenues & Volume By LiDAR-based Systems for the Period 2022 - 2032F
- Historical Data and Forecast of Indonesia Hydrographic Survey Sensing Systems Market Revenues & Volume By Technology Type for the Period 2022-2032F
- Historical Data and Forecast of Indonesia Hydrographic Survey Sensing Systems Market Revenues & Volume By Sonar Systems for the Period 2022-2032F
- Historical Data and Forecast of Indonesia Hydrographic Survey Sensing Systems Market Revenues & Volume By High-Frequency Sensors for the Period 2022-2032F
- Historical Data and Forecast of Indonesia Hydrographic Survey Sensing Systems Market Revenues & Volume By Acoustic Imaging for the Period 2022-2032F
- Historical Data and Forecast of Indonesia Hydrographic Survey Sensing Systems Market Revenues & Volume By Seismic Technology for the Period 2022-2032F
- Historical Data and Forecast of Indonesia Hydrographic Survey Sensing Systems Market Revenues & Volume By Light Detection and Ranging for the Period 2022 - 2032F
- Historical Data and Forecast of Indonesia Hydrographic Survey Sensing Systems Market Revenues & Volume By End User for the Period 2022-2032F
- Historical Data and Forecast of Indonesia Hydrographic Survey Sensing Systems Market Revenues & Volume By Research Institutions for the Period 2022-2032F
- Historical Data and Forecast of Indonesia Hydrographic Survey Sensing Systems Market Revenues & Volume By Government Agencies for the Period 2022-2032F
- Historical Data and Forecast of Indonesia Hydrographic Survey Sensing Systems Market Revenues & Volume By Offshore Drilling Companies for the Period 2022-2032F
- Historical Data and Forecast of Indonesia Hydrographic Survey Sensing Systems Market Revenues & Volume By Environmental Agencies for the Period 2022-2032F
- Historical Data and Forecast of Indonesia Hydrographic Survey Sensing Systems Market Revenues & Volume By Maritime Industry for the Period 2022 - 2032F
- Historical Data and Forecast of Indonesia Hydrographic Survey Sensing Systems Market Revenues & Volume By Application for the Period 2022-2032F
- Historical Data and Forecast of Indonesia Hydrographic Survey Sensing Systems Market Revenues & Volume By Bathymetric Surveying for the Period 2022-2032F
- Historical Data and Forecast of Indonesia Hydrographic Survey Sensing Systems Market Revenues & Volume By Seafloor Mapping for the Period 2022-2032F
- Historical Data and Forecast of Indonesia Hydrographic Survey Sensing Systems Market Revenues & Volume By Pipeline Inspection for the Period 2022-2032F
- Historical Data and Forecast of Indonesia Hydrographic Survey Sensing Systems Market Revenues & Volume By Geological Studies for the Period 2022-2032F
- Historical Data and Forecast of Indonesia Hydrographic Survey Sensing Systems Market Revenues & Volume By Coastal Engineering for the Period 2022 - 2032F
- Indonesia Hydrographic Survey Sensing Systems Import Export Trade Statistics
- Market Opportunity Assessment By Product Type
- Market Opportunity Assessment By Technology Type
- Market Opportunity Assessment By End User
- Market Opportunity Assessment By Application
- Indonesia Hydrographic Survey Sensing Systems Top Companies Market Share
- Indonesia Hydrographic Survey Sensing Systems Competitive Benchmarking By Technical and Operational Parameters
- Indonesia Hydrographic Survey Sensing Systems Company Profiles
- Indonesia Hydrographic Survey Sensing Systems Key Strategic Recommendations
Frequently Asked Questions About the Market Study (FAQs):
6Wresearch actively monitors the Indonesia Hydrographic Survey Sensing Systems Market and publishes its comprehensive annual report, highlighting emerging trends, growth drivers, revenue analysis, and forecast outlook. Our insights help businesses to make data-backed strategic decisions with ongoing market dynamics. Our analysts track relevent industries related to the Indonesia Hydrographic Survey Sensing Systems Market, allowing our clients with actionable intelligence and reliable forecasts tailored to emerging regional needs.
Yes, we provide customisation as per your requirements. To learn more, feel free to contact us on sales@6wresearch.com
1 Executive Summary |
2 Introduction |
2.1 Key Highlights of the Report |
2.2 Report Description |
2.3 Market Scope & Segmentation |
2.4 Research Methodology |
2.5 Assumptions |
3 Indonesia Hydrographic Survey Sensing Systems Market Overview |
3.1 Indonesia Country Macro Economic Indicators |
3.2 Indonesia Hydrographic Survey Sensing Systems Market Revenues & Volume, 2022 & 2032F |
3.3 Indonesia Hydrographic Survey Sensing Systems Market - Industry Life Cycle |
3.4 Indonesia Hydrographic Survey Sensing Systems Market - Porter's Five Forces |
3.5 Indonesia Hydrographic Survey Sensing Systems Market Revenues & Volume Share, By Product Type, 2022 & 2032F |
3.6 Indonesia Hydrographic Survey Sensing Systems Market Revenues & Volume Share, By Technology Type, 2022 & 2032F |
3.7 Indonesia Hydrographic Survey Sensing Systems Market Revenues & Volume Share, By End User, 2022 & 2032F |
3.8 Indonesia Hydrographic Survey Sensing Systems Market Revenues & Volume Share, By Application, 2022 & 2032F |
4 Indonesia Hydrographic Survey Sensing Systems Market Dynamics |
4.1 Impact Analysis |
4.2 Market Drivers |
4.2.1 Increasing demand for accurate mapping of underwater terrains for various applications such as marine resource exploration, coastal development, and disaster management. |
4.2.2 Government initiatives to enhance maritime safety and security through effective hydrographic surveying. |
4.2.3 Technological advancements in hydrographic survey sensing systems leading to higher efficiency and accuracy. |
4.3 Market Restraints |
4.3.1 High initial investment and operational costs associated with acquiring and maintaining hydrographic survey sensing systems. |
4.3.2 Lack of skilled professionals proficient in operating advanced hydrographic survey sensing technologies. |
4.3.3 Environmental regulations and restrictions affecting the deployment of hydrographic survey sensing systems in certain areas. |
5 Indonesia Hydrographic Survey Sensing Systems Market Trends |
6 Indonesia Hydrographic Survey Sensing Systems Market, By Types |
6.1 Indonesia Hydrographic Survey Sensing Systems Market, By Product Type |
6.1.1 Overview and Analysis |
6.1.2 Indonesia Hydrographic Survey Sensing Systems Market Revenues & Volume, By Product Type, 2022 - 2032F |
6.1.3 Indonesia Hydrographic Survey Sensing Systems Market Revenues & Volume, By Single Beam Echosounders, 2022 - 2032F |
6.1.4 Indonesia Hydrographic Survey Sensing Systems Market Revenues & Volume, By Multibeam Echosounders, 2022 - 2032F |
6.1.5 Indonesia Hydrographic Survey Sensing Systems Market Revenues & Volume, By Side Scan Sonars, 2022 - 2032F |
6.1.6 Indonesia Hydrographic Survey Sensing Systems Market Revenues & Volume, By Sub-bottom Profilers, 2022 - 2032F |
6.1.7 Indonesia Hydrographic Survey Sensing Systems Market Revenues & Volume, By LiDAR-based Systems, 2022 - 2032F |
6.2 Indonesia Hydrographic Survey Sensing Systems Market, By Technology Type |
6.2.1 Overview and Analysis |
6.2.2 Indonesia Hydrographic Survey Sensing Systems Market Revenues & Volume, By Sonar Systems, 2022 - 2032F |
6.2.3 Indonesia Hydrographic Survey Sensing Systems Market Revenues & Volume, By High-Frequency Sensors, 2022 - 2032F |
6.2.4 Indonesia Hydrographic Survey Sensing Systems Market Revenues & Volume, By Acoustic Imaging, 2022 - 2032F |
6.2.5 Indonesia Hydrographic Survey Sensing Systems Market Revenues & Volume, By Seismic Technology, 2022 - 2032F |
6.2.6 Indonesia Hydrographic Survey Sensing Systems Market Revenues & Volume, By Light Detection and Ranging, 2022 - 2032F |
6.3 Indonesia Hydrographic Survey Sensing Systems Market, By End User |
6.3.1 Overview and Analysis |
6.3.2 Indonesia Hydrographic Survey Sensing Systems Market Revenues & Volume, By Research Institutions, 2022 - 2032F |
6.3.3 Indonesia Hydrographic Survey Sensing Systems Market Revenues & Volume, By Government Agencies, 2022 - 2032F |
6.3.4 Indonesia Hydrographic Survey Sensing Systems Market Revenues & Volume, By Offshore Drilling Companies, 2022 - 2032F |
6.3.5 Indonesia Hydrographic Survey Sensing Systems Market Revenues & Volume, By Environmental Agencies, 2022 - 2032F |
6.3.6 Indonesia Hydrographic Survey Sensing Systems Market Revenues & Volume, By Maritime Industry, 2022 - 2032F |
6.4 Indonesia Hydrographic Survey Sensing Systems Market, By Application |
6.4.1 Overview and Analysis |
6.4.2 Indonesia Hydrographic Survey Sensing Systems Market Revenues & Volume, By Bathymetric Surveying, 2022 - 2032F |
6.4.3 Indonesia Hydrographic Survey Sensing Systems Market Revenues & Volume, By Seafloor Mapping, 2022 - 2032F |
6.4.4 Indonesia Hydrographic Survey Sensing Systems Market Revenues & Volume, By Pipeline Inspection, 2022 - 2032F |
6.4.5 Indonesia Hydrographic Survey Sensing Systems Market Revenues & Volume, By Geological Studies, 2022 - 2032F |
6.4.6 Indonesia Hydrographic Survey Sensing Systems Market Revenues & Volume, By Coastal Engineering, 2022 - 2032F |
7 Indonesia Hydrographic Survey Sensing Systems Market Import-Export Trade Statistics |
7.1 Indonesia Hydrographic Survey Sensing Systems Market Export to Major Countries |
7.2 Indonesia Hydrographic Survey Sensing Systems Market Imports from Major Countries |
8 Indonesia Hydrographic Survey Sensing Systems Market Key Performance Indicators |
8.1 Average surveying time per unit area, indicating the efficiency of the hydrographic survey sensing systems. |
8.2 Rate of accuracy in mapping underwater terrains, reflecting the quality of data provided by the systems. |
8.3 Number of successful project completions within the estimated time frame, demonstrating the reliability and effectiveness of the systems. |
9 Indonesia Hydrographic Survey Sensing Systems Market - Opportunity Assessment |
9.1 Indonesia Hydrographic Survey Sensing Systems Market Opportunity Assessment, By Product Type, 2022 & 2032F |
9.2 Indonesia Hydrographic Survey Sensing Systems Market Opportunity Assessment, By Technology Type, 2022 & 2032F |
9.3 Indonesia Hydrographic Survey Sensing Systems Market Opportunity Assessment, By End User, 2022 & 2032F |
9.4 Indonesia Hydrographic Survey Sensing Systems Market Opportunity Assessment, By Application, 2022 & 2032F |
10 Indonesia Hydrographic Survey Sensing Systems Market - Competitive Landscape |
10.1 Indonesia Hydrographic Survey Sensing Systems Market Revenue Share, By Companies, 2025 |
10.2 Indonesia Hydrographic Survey Sensing Systems Market Competitive Benchmarking, By Operating and Technical Parameters |
11 Company Profiles |
12 Recommendations |
13 Disclaimer |
Export potential assessment - trade Analytics for 2030
Export potential enables firms to identify high-growth global markets with greater confidence by combining advanced trade intelligence with a structured quantitative methodology. The framework analyzes emerging demand trends and country-level import patterns while integrating macroeconomic and trade datasets such as GDP and population forecasts, bilateral import–export flows, tariff structures, elasticity differentials between developed and developing economies, geographic distance, and import demand projections. Using weighted trade values from 2020–2024 as the base period to project country-to-country export potential for 2030, these inputs are operationalized through calculated drivers such as gravity model parameters, tariff impact factors, and projected GDP per-capita growth. Through an analysis of hidden potentials, demand hotspots, and market conditions that are most favorable to success, this method enables firms to focus on target countries, maximize returns, and global expansion with data, backed by accuracy.
By factoring in the projected importer demand gap that is currently unmet and could be potential opportunity, it identifies the potential for the Exporter (Country) among 190 countries, against the general trade analysis, which identifies the biggest importer or exporter.
To discover high-growth global markets and optimize your business strategy:
Click Here
Pricing
- Single User License$ 1,995
- Department License$ 2,400
- Site License$ 3,120
- Global License$ 3,795

Search
Thought Leadership and Analyst Meet


Our Clients
Latest Reports
- Canada Cloud CFD Market (2026-2032) | Size & Revenue, Industry, Growth, Competitive Landscape, Forecast, Segmentation, Value, Outlook, Trends, Share, Analysis, Companies
- Taiwan Food Delivery Platform Market (2026-2032) | Companies, Outlook, Analysis, Trends, Value, Revenue, Segmentation, Share, Forecast, Competitive Landscape, Growth, Size & Forecast
- United Kingdom (UK) Long-term Care Insurance Market (2026-2032) | Growth, Share, Consumer Insights, Drivers, Opportunities, Competition, Pricing Analysis, Segments, Restraints, Companies, Competitive, Value, Outlook, Size, Demand, Analysis, Challenges, Strategic Insights, Investment Trends, Revenue, Trends, Supply, Forecast
- United Kingdom (UK) Long Term Care Market (2026-2032) | Companies, Outlook, Analysis, Trends, Value, Revenue, Segmentation, Share, Forecast, Competitive Landscape, Growth, Size & Forecast
- Iraq Insulation and Waterproofing Market (2026-2032) | Outlook, Drivers, Growth, Size, Share, Industry, Revenue, Trends, Demand, Competitive, Strategic Insights, Opportunities, Segments, Companies, Challenges, Strategy, Consumer Insights, Analysis, Investment Trends, Value, Segmentation, Forecast, Restraints
- India Switchgear Market Outlook (2026-2032) | Size, Share, Trends, Growth, Revenue, Forecast, Analysis, Value, Outlook
- Pakistan Contraceptive Implants Market (2025-2031) | Demand, Growth, Size, Share, Industry, Pricing Analysis, Competitive, Strategic Insights, Strategy, Consumer Insights, Analysis, Investment Trends, Opportunities, Revenue, Segments, Value, Segmentation, Supply, Forecast, Restraints, Outlook, Competition, Drivers, Trends, Companies, Challenges
- Sri Lanka Packaging Market (2026-2032) | Outlook, Competition, Drivers, Trends, Demand, Pricing Analysis, Competitive, Strategic Insights, Companies, Challenges, Strategy, Consumer Insights, Analysis, Investment Trends, Opportunities, Growth, Size, Share, Industry, Revenue, Segments, Value, Segmentation, Supply, Forecast, Restraints
- India Kids Watches Market (2026-2032) | Strategy, Consumer Insights, Analysis, Investment Trends, Opportunities, Growth, Size, Share, Industry, Revenue, Segments, Value, Segmentation, Supply, Forecast, Restraints, Outlook, Competition, Drivers, Trends, Demand, Pricing Analysis, Competitive, Strategic Insights, Companies, Challenges
- Saudi Arabia Core Assurance Service Market (2025-2031) | Strategy, Consumer Insights, Analysis, Investment Trends, Opportunities, Growth, Size, Share, Industry, Revenue, Segments, Value, Segmentation, Supply, Forecast, Restraints, Outlook, Competition, Drivers, Trends, Demand, Pricing Analysis, Competitive, Strategic Insights, Companies, Challenges
Industry Events and Analyst Meet

India EV Show 2026

EV tech India Expo 2026

Auto Tech Asia 2026

Battery Tech India 2026

Smart Production Solutions Guangzhou 2026
Whitepaper
- Middle East & Africa Commercial Security Market Click here to view more.
- Middle East & Africa Fire Safety Systems & Equipment Market Click here to view more.
- GCC Drone Market Click here to view more.
- Middle East Lighting Fixture Market Click here to view more.
- GCC Physical & Perimeter Security Market Click here to view more.
6WResearch In News
- Doha a strategic location for EV manufacturing hub: IPA Qatar
- Demand for luxury TVs surging in the GCC, says Samsung
- Empowering Growth: The Thriving Journey of Bangladesh’s Cable Industry
- Demand for luxury TVs surging in the GCC, says Samsung
- Video call with a traditional healer? Once unthinkable, it’s now common in South Africa
- Intelligent Buildings To Smooth GCC’s Path To Net Zero