Indonesia Manganese Bronze Market (2026-2032) Outlook | Analysis, Growth, Forecast, Companies, Industry, Revenue, Size, Value, Trends & Share
Market Forecast By Type (QMn1.5 (Cu-1.5Mn), QMn5 (Cu-5Mn)), By Application (Marine Industry, Space Industry, Automotive, Industrial, Other) And Competitive Landscape
| Product Code: ETC278248 | Publication Date: Aug 2023 | Updated Date: Mar 2026 | Product Type: Market Research Report | |
| Publisher: 6Wresearch | Author: Ravi Bhandari | No. of Pages: 75 | No. of Figures: 35 | No. of Tables: 20 |
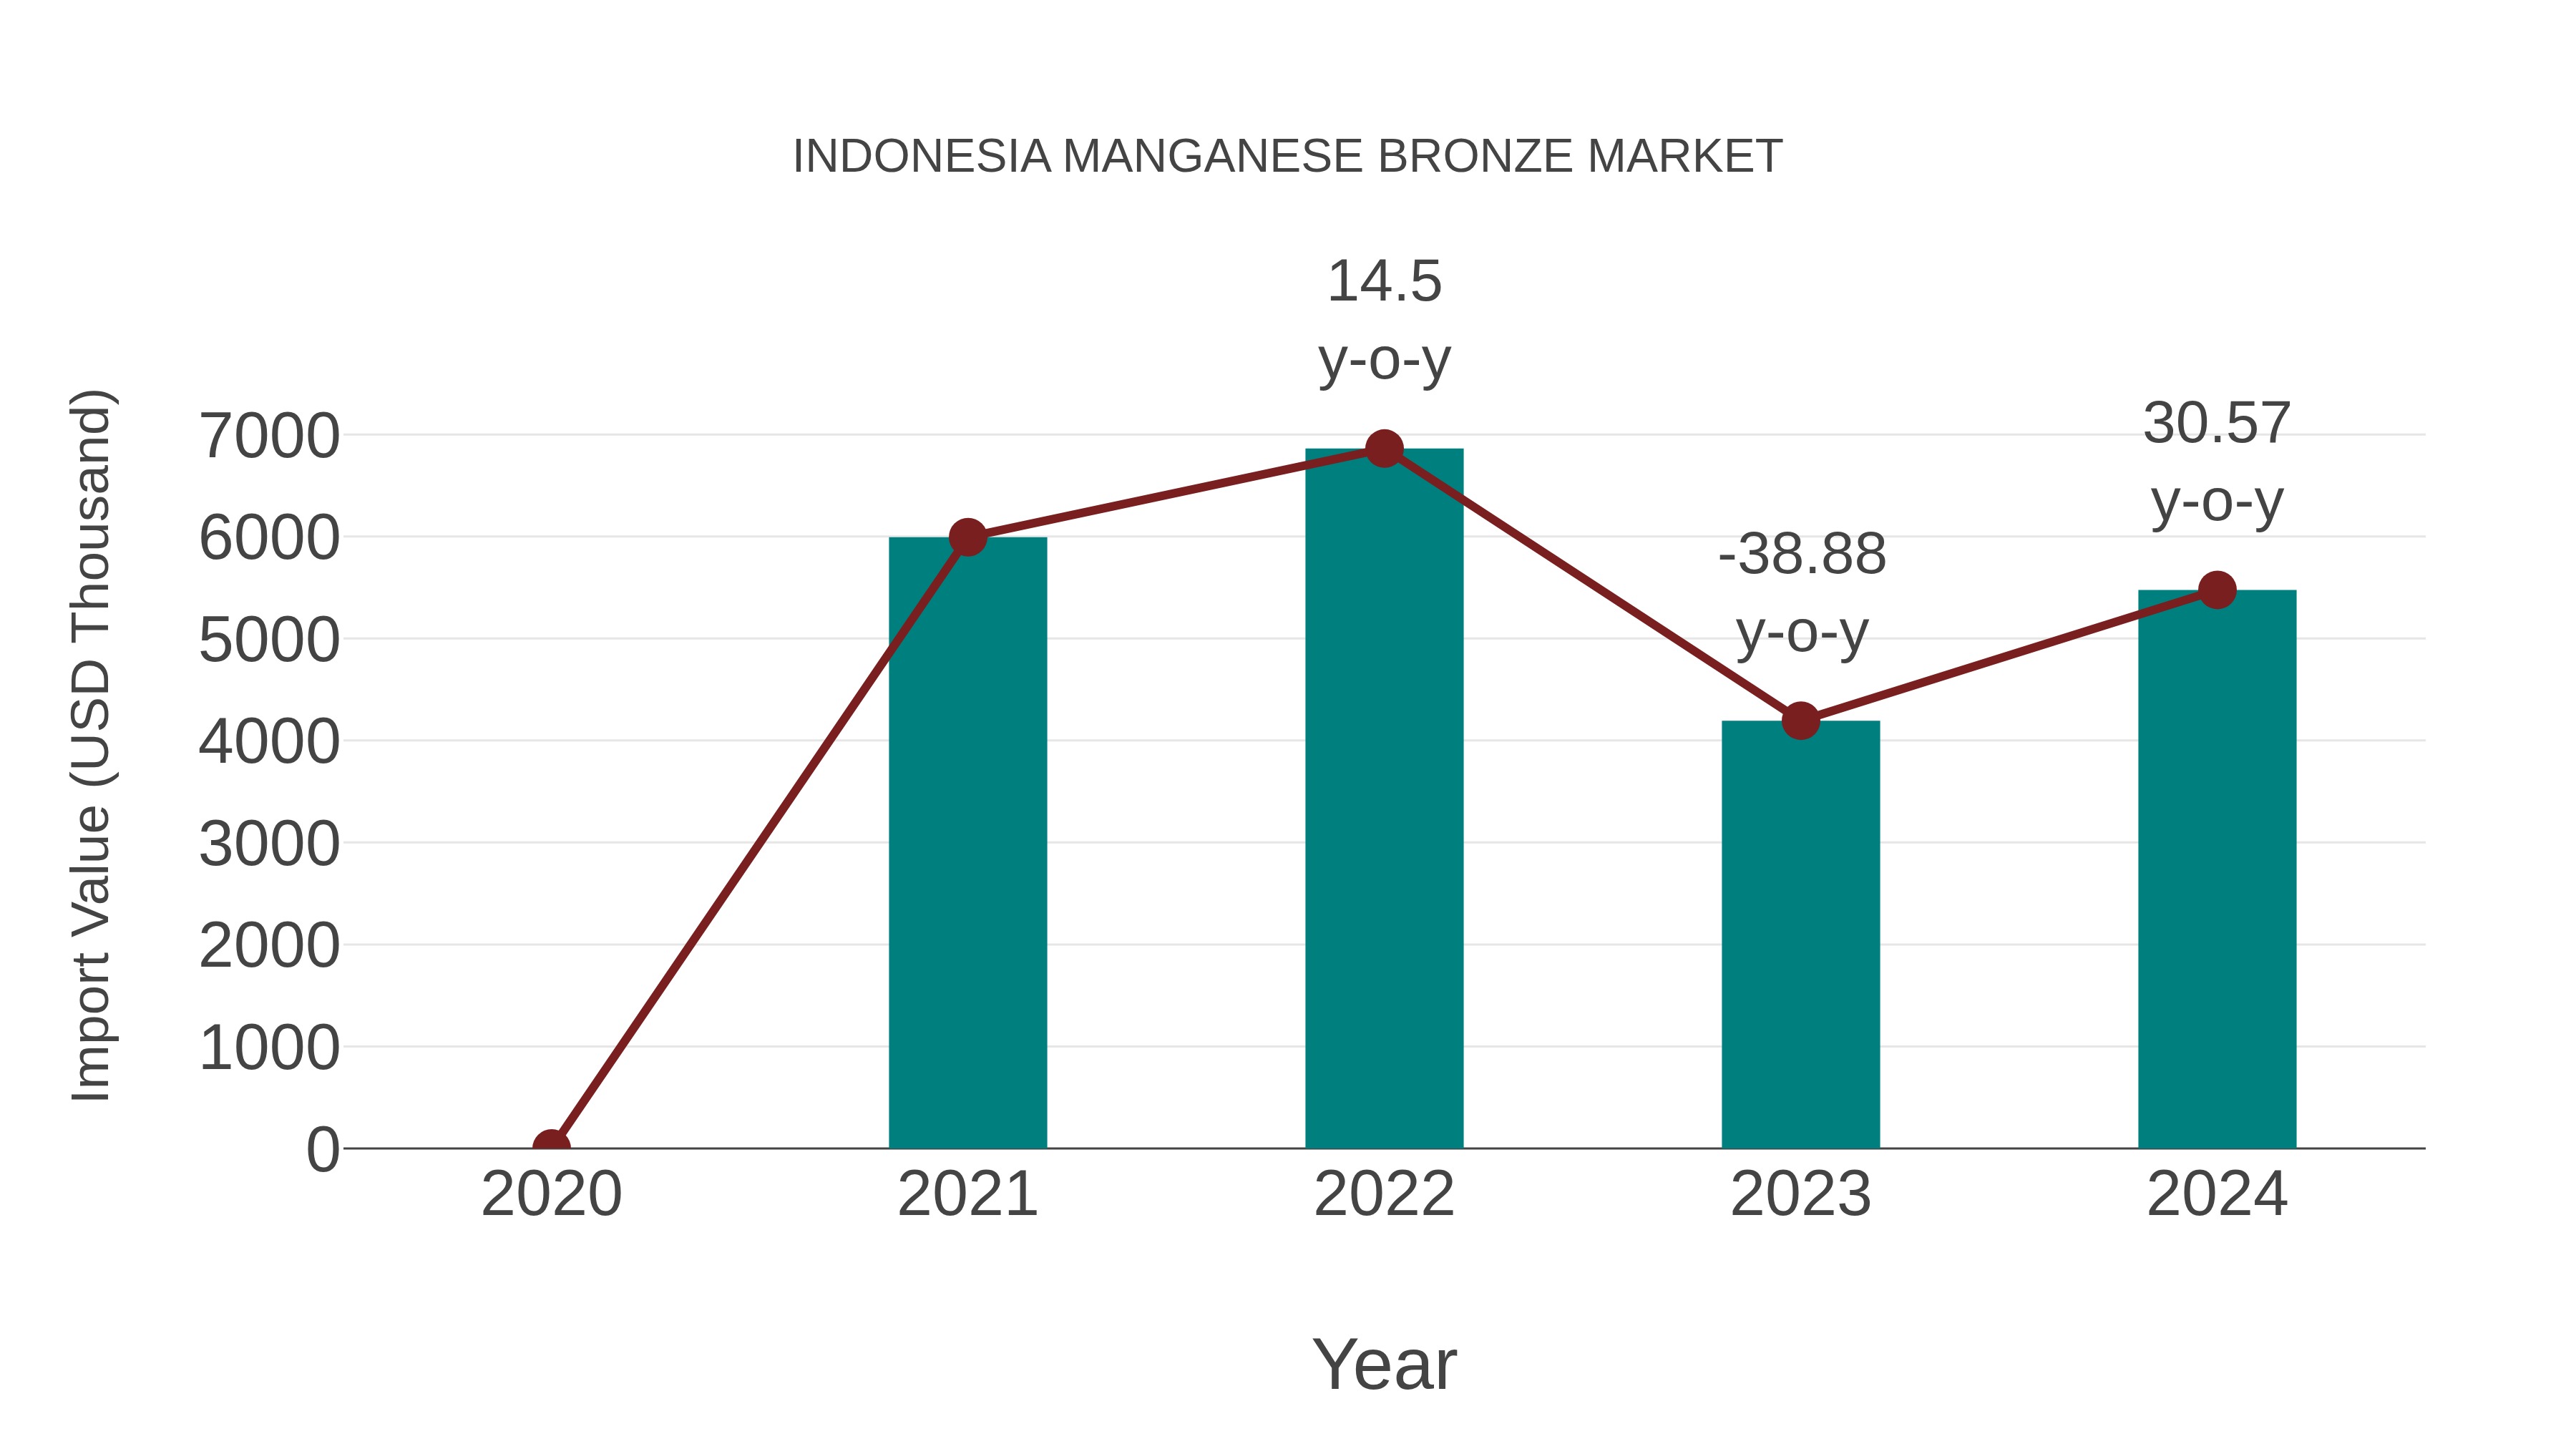
Indonesia Manganese Bronze Market: Import Trend Analysis
In 2024, Indonesia`s import trend for manganese bronze saw a growth rate of 30.57%, contrasting with a -2.96% compound annual growth rate (CAGR) from 2020 to 2023. This significant upturn in import momentum from 2023 to 2024 could be attributed to a notable demand shift in the market, potentially influenced by changing consumer preferences or shifts in industrial requirements.
Indonesia Manganese Bronze Market Synopsis
The Indonesia Manganese Bronze Market involves the production and distribution of manganese bronze, an alloy composed of copper, manganese, and other elements. Manganese bronze is valued for its mechanical properties and corrosion resistance. The Indonesia Manganese Bronze Market caters to industries such as marine, automotive, industrial equipment, and infrastructure. The alloy`s durability and resistance to seawater corrosion make it suitable for marine applications. Market trends may be influenced by developments in these industries, construction projects, and global supply and demand for metal alloys.
Drivers of the Market
The Indonesia Manganese Bronze Market is influenced by the demand for corrosion-resistant and durable materials in applications like marine equipment, architectural structures, and industrial components. Manganese bronze`s unique properties make it a preferred choice for environments requiring both strength and resistance to harsh conditions.
Challenges of the Market
The manganese bronze market might face challenges due to fluctuations in raw material prices, including copper and manganese. Volatility in these input costs can impact production expenses and overall profitability for manufacturers.
COVID-19 Impact on the Market
The pandemic led to reduced industrial activity, affecting the demand for manganese-based products. Manufacturing slowdowns and supply chain interruptions impacted both the production and consumption of manganese bronze and manganese powder. The recovery of these markets depends on the revival of industrial sectors and infrastructure projects.
Key Highlights of the Report:
- Indonesia Manganese Bronze Market Outlook
- Market Size of Indonesia Manganese Bronze Market, 2025
- Forecast of Indonesia Manganese Bronze Market, 2032
- Historical Data and Forecast of Indonesia Manganese Bronze Revenues & Volume for the Period 2022-2032F
- Indonesia Manganese Bronze Market Trend Evolution
- Indonesia Manganese Bronze Market Drivers and Challenges
- Indonesia Manganese Bronze Price Trends
- Indonesia Manganese Bronze Porter's Five Forces
- Indonesia Manganese Bronze Industry Life Cycle
- Historical Data and Forecast of Indonesia Manganese Bronze Market Revenues & Volume By Type for the Period 2022-2032F
- Historical Data and Forecast of Indonesia Manganese Bronze Market Revenues & Volume By QMn1.5 (Cu-1.5Mn) for the Period 2022-2032F
- Historical Data and Forecast of Indonesia Manganese Bronze Market Revenues & Volume By QMn5 (Cu-5Mn) for the Period 2022-2032F
- Historical Data and Forecast of Indonesia Manganese Bronze Market Revenues & Volume By Application for the Period 2022-2032F
- Historical Data and Forecast of Indonesia Manganese Bronze Market Revenues & Volume By Marine Industry for the Period 2022-2032F
- Historical Data and Forecast of Indonesia Manganese Bronze Market Revenues & Volume By Space Industry for the Period 2022-2032F
- Historical Data and Forecast of Indonesia Manganese Bronze Market Revenues & Volume By Automotive for the Period 2022-2032F
- Historical Data and Forecast of Indonesia Manganese Bronze Market Revenues & Volume By Industrial for the Period 2022-2032F
- Historical Data and Forecast of Indonesia Manganese Bronze Market Revenues & Volume By Other for the Period 2022-2032F
- Indonesia Manganese Bronze Import Export Trade Statistics
- Market Opportunity Assessment By Type
- Market Opportunity Assessment By Application
- Indonesia Manganese Bronze Top Companies Market Share
- Indonesia Manganese Bronze Competitive Benchmarking By Technical and Operational Parameters
- Indonesia Manganese Bronze Company Profiles
- Indonesia Manganese Bronze Key Strategic Recommendations
Indonesia Manganese Bronze Market (2026-2032): FAQs
6Wresearch actively monitors the Indonesia Manganese Bronze Market and publishes its comprehensive annual report, highlighting emerging trends, growth drivers, revenue analysis, and forecast outlook. Our insights help businesses to make data-backed strategic decisions with ongoing market dynamics. Our analysts track relevent industries related to the Indonesia Manganese Bronze Market, allowing our clients with actionable intelligence and reliable forecasts tailored to emerging regional needs.
Yes, we provide customisation as per your requirements. To learn more, feel free to contact us on sales@6wresearch.com
1 Executive Summary |
2 Introduction |
2.1 Key Highlights of the Report |
2.2 Report Description |
2.3 Market Scope & Segmentation |
2.4 Research Methodology |
2.5 Assumptions |
3 Indonesia Manganese Bronze Market Overview |
3.1 Indonesia Country Macro Economic Indicators |
3.2 Indonesia Manganese Bronze Market Revenues & Volume, 2022 & 2032F |
3.3 Indonesia Manganese Bronze Market - Industry Life Cycle |
3.4 Indonesia Manganese Bronze Market - Porter's Five Forces |
3.5 Indonesia Manganese Bronze Market Revenues & Volume Share, By Type, 2022 & 2032F |
3.6 Indonesia Manganese Bronze Market Revenues & Volume Share, By Application, 2022 & 2032F |
4 Indonesia Manganese Bronze Market Dynamics |
4.1 Impact Analysis |
4.2 Market Drivers |
4.2.1 Increasing demand for manganese bronze in automotive and industrial applications |
4.2.2 Growth in infrastructure development projects in Indonesia driving demand for manganese bronze products |
4.2.3 Technological advancements leading to the development of high-performance manganese bronze alloys |
4.3 Market Restraints |
4.3.1 Fluctuating prices of raw materials impacting production costs |
4.3.2 Competition from alternative materials in certain applications |
4.3.3 Regulatory challenges related to environmental and safety standards affecting production processes |
5 Indonesia Manganese Bronze Market Trends |
6 Indonesia Manganese Bronze Market, By Types |
6.1 Indonesia Manganese Bronze Market, By Type |
6.1.1 Overview and Analysis |
6.1.2 Indonesia Manganese Bronze Market Revenues & Volume, By Type, 2022-2032F |
6.1.3 Indonesia Manganese Bronze Market Revenues & Volume, By QMn1.5 (Cu-1.5Mn), 2022-2032F |
6.1.4 Indonesia Manganese Bronze Market Revenues & Volume, By QMn5 (Cu-5Mn), 2022-2032F |
6.2 Indonesia Manganese Bronze Market, By Application |
6.2.1 Overview and Analysis |
6.2.2 Indonesia Manganese Bronze Market Revenues & Volume, By Marine Industry, 2022-2032F |
6.2.3 Indonesia Manganese Bronze Market Revenues & Volume, By Space Industry, 2022-2032F |
6.2.4 Indonesia Manganese Bronze Market Revenues & Volume, By Automotive, 2022-2032F |
6.2.5 Indonesia Manganese Bronze Market Revenues & Volume, By Industrial, 2022-2032F |
6.2.6 Indonesia Manganese Bronze Market Revenues & Volume, By Other, 2022-2032F |
7 Indonesia Manganese Bronze Market Import-Export Trade Statistics |
7.1 Indonesia Manganese Bronze Market Export to Major Countries |
7.2 Indonesia Manganese Bronze Market Imports from Major Countries |
8 Indonesia Manganese Bronze Market Key Performance Indicators |
8.1 Percentage increase in demand from automotive and industrial sectors |
8.2 Number of infrastructure projects utilizing manganese bronze products |
8.3 Research and development investment in new manganese bronze alloy formulations |
8.4 Percentage change in raw material prices impacting production costs |
8.5 Compliance rate with environmental and safety standards |
9 Indonesia Manganese Bronze Market - Opportunity Assessment |
9.1 Indonesia Manganese Bronze Market Opportunity Assessment, By Type, 2022 & 2032F |
9.2 Indonesia Manganese Bronze Market Opportunity Assessment, By Application, 2022 & 2032F |
10 Indonesia Manganese Bronze Market - Competitive Landscape |
10.1 Indonesia Manganese Bronze Market Revenue Share, By Companies, 2025 |
10.2 Indonesia Manganese Bronze Market Competitive Benchmarking, By Operating and Technical Parameters |
11 Company Profiles |
12 Recommendations |
13 Disclaimer |
Global Go To Market Strategy - 2030
Export potential enables firms to identify high-growth global markets with greater confidence by combining advanced trade intelligence with a structured quantitative methodology. The framework analyzes emerging demand trends and country-level import patterns while integrating macroeconomic and trade datasets such as GDP and population forecasts, bilateral import–export flows, tariff structures, elasticity differentials between developed and developing economies, geographic distance, and import demand projections. Using weighted trade values from 2020–2024 as the base period to project country-to-country export potential for 2030, these inputs are operationalized through calculated drivers such as gravity model parameters, tariff impact factors, and projected GDP per-capita growth. Through an analysis of hidden potentials, demand hotspots, and market conditions that are most favorable to success, this method enables firms to focus on target countries, maximize returns, and global expansion with data, backed by accuracy.
By factoring in the projected importer demand gap that is currently unmet and could be potential opportunity, it identifies the potential for the Exporter (Country) among 190 countries, against the general trade analysis, which identifies the biggest importer or exporter.
To discover high-growth global markets and optimize your business strategy:
Click Here
Pricing
- Single User License$ 1,995
- Department License$ 2,400
- Site License$ 3,120
- Global License$ 3,795

Leadership Perspectives from Industry Events
Search
Thought Leadership and Analyst Meet


Our Clients
6WResearch In News
- India Air Conditioner Market Set for Strong Rebound in 2026 After Weather-Led Correction and GST-Driven Recovery: 6Wresearch
- ADAS in India: How Automatic Emergency Braking, Blind Spot Detection & Driver Monitoring are Transforming Road Safety
- Doha a strategic location for EV manufacturing hub: IPA Qatar
- Demand for luxury TVs surging in the GCC, says Samsung
- Empowering Growth: The Thriving Journey of Bangladesh’s Cable Industry
- Demand for luxury TVs surging in the GCC, says Samsung
Latest Reports
- Nicaragua RPG Gaming Market (2026-2032)
- New Zealand RPG Gaming Market (2026-2032)
- Netherlands RPG Gaming Market (2026-2032)
- Nauru RPG Gaming Market (2026-2032)
- Namibia RPG Gaming Market (2026-2032)
- Mozambique RPG Gaming Market (2026-2032)
- Montenegro RPG Gaming Market (2026-2032)
- Mongolia RPG Gaming Market (2026-2032)
- Monaco RPG Gaming Market (2026-2032)
- Micronesia RPG Gaming Market (2026-2032)
Industry Events and Analyst Meet

HIMTEX 2026

India Refining Summit 2026

India EV Show 2026

EV tech India Expo 2026

Auto Tech Asia 2026
Whitepaper
- Middle East & Africa Commercial Security Market Click here to view more.
- Middle East & Africa Fire Safety Systems & Equipment Market Click here to view more.
- GCC Drone Market Click here to view more.
- Middle East Lighting Fixture Market Click here to view more.
- GCC Physical & Perimeter Security Market Click here to view more.