Indonesia Nondurable Goods Market (2026-2032) Outlook | Growth, Value, Size, Analysis, Forecast, Share, Revenue, Companies, Trends & Industry
Market Forecast By Product Type (Food, Drinks, Medication, Cleaning Supplies, Cosmetics, Office Supplies, Apparel, Cigarettes And Tobacco), By Applications (Offline, Online) And Competitive Landscape
| Product Code: ETC254308 | Publication Date: Aug 2023 | Updated Date: Mar 2026 | Product Type: Market Research Report | |
| Publisher: 6Wresearch | Author: Ravi Bhandari | No. of Pages: 75 | No. of Figures: 35 | No. of Tables: 20 |
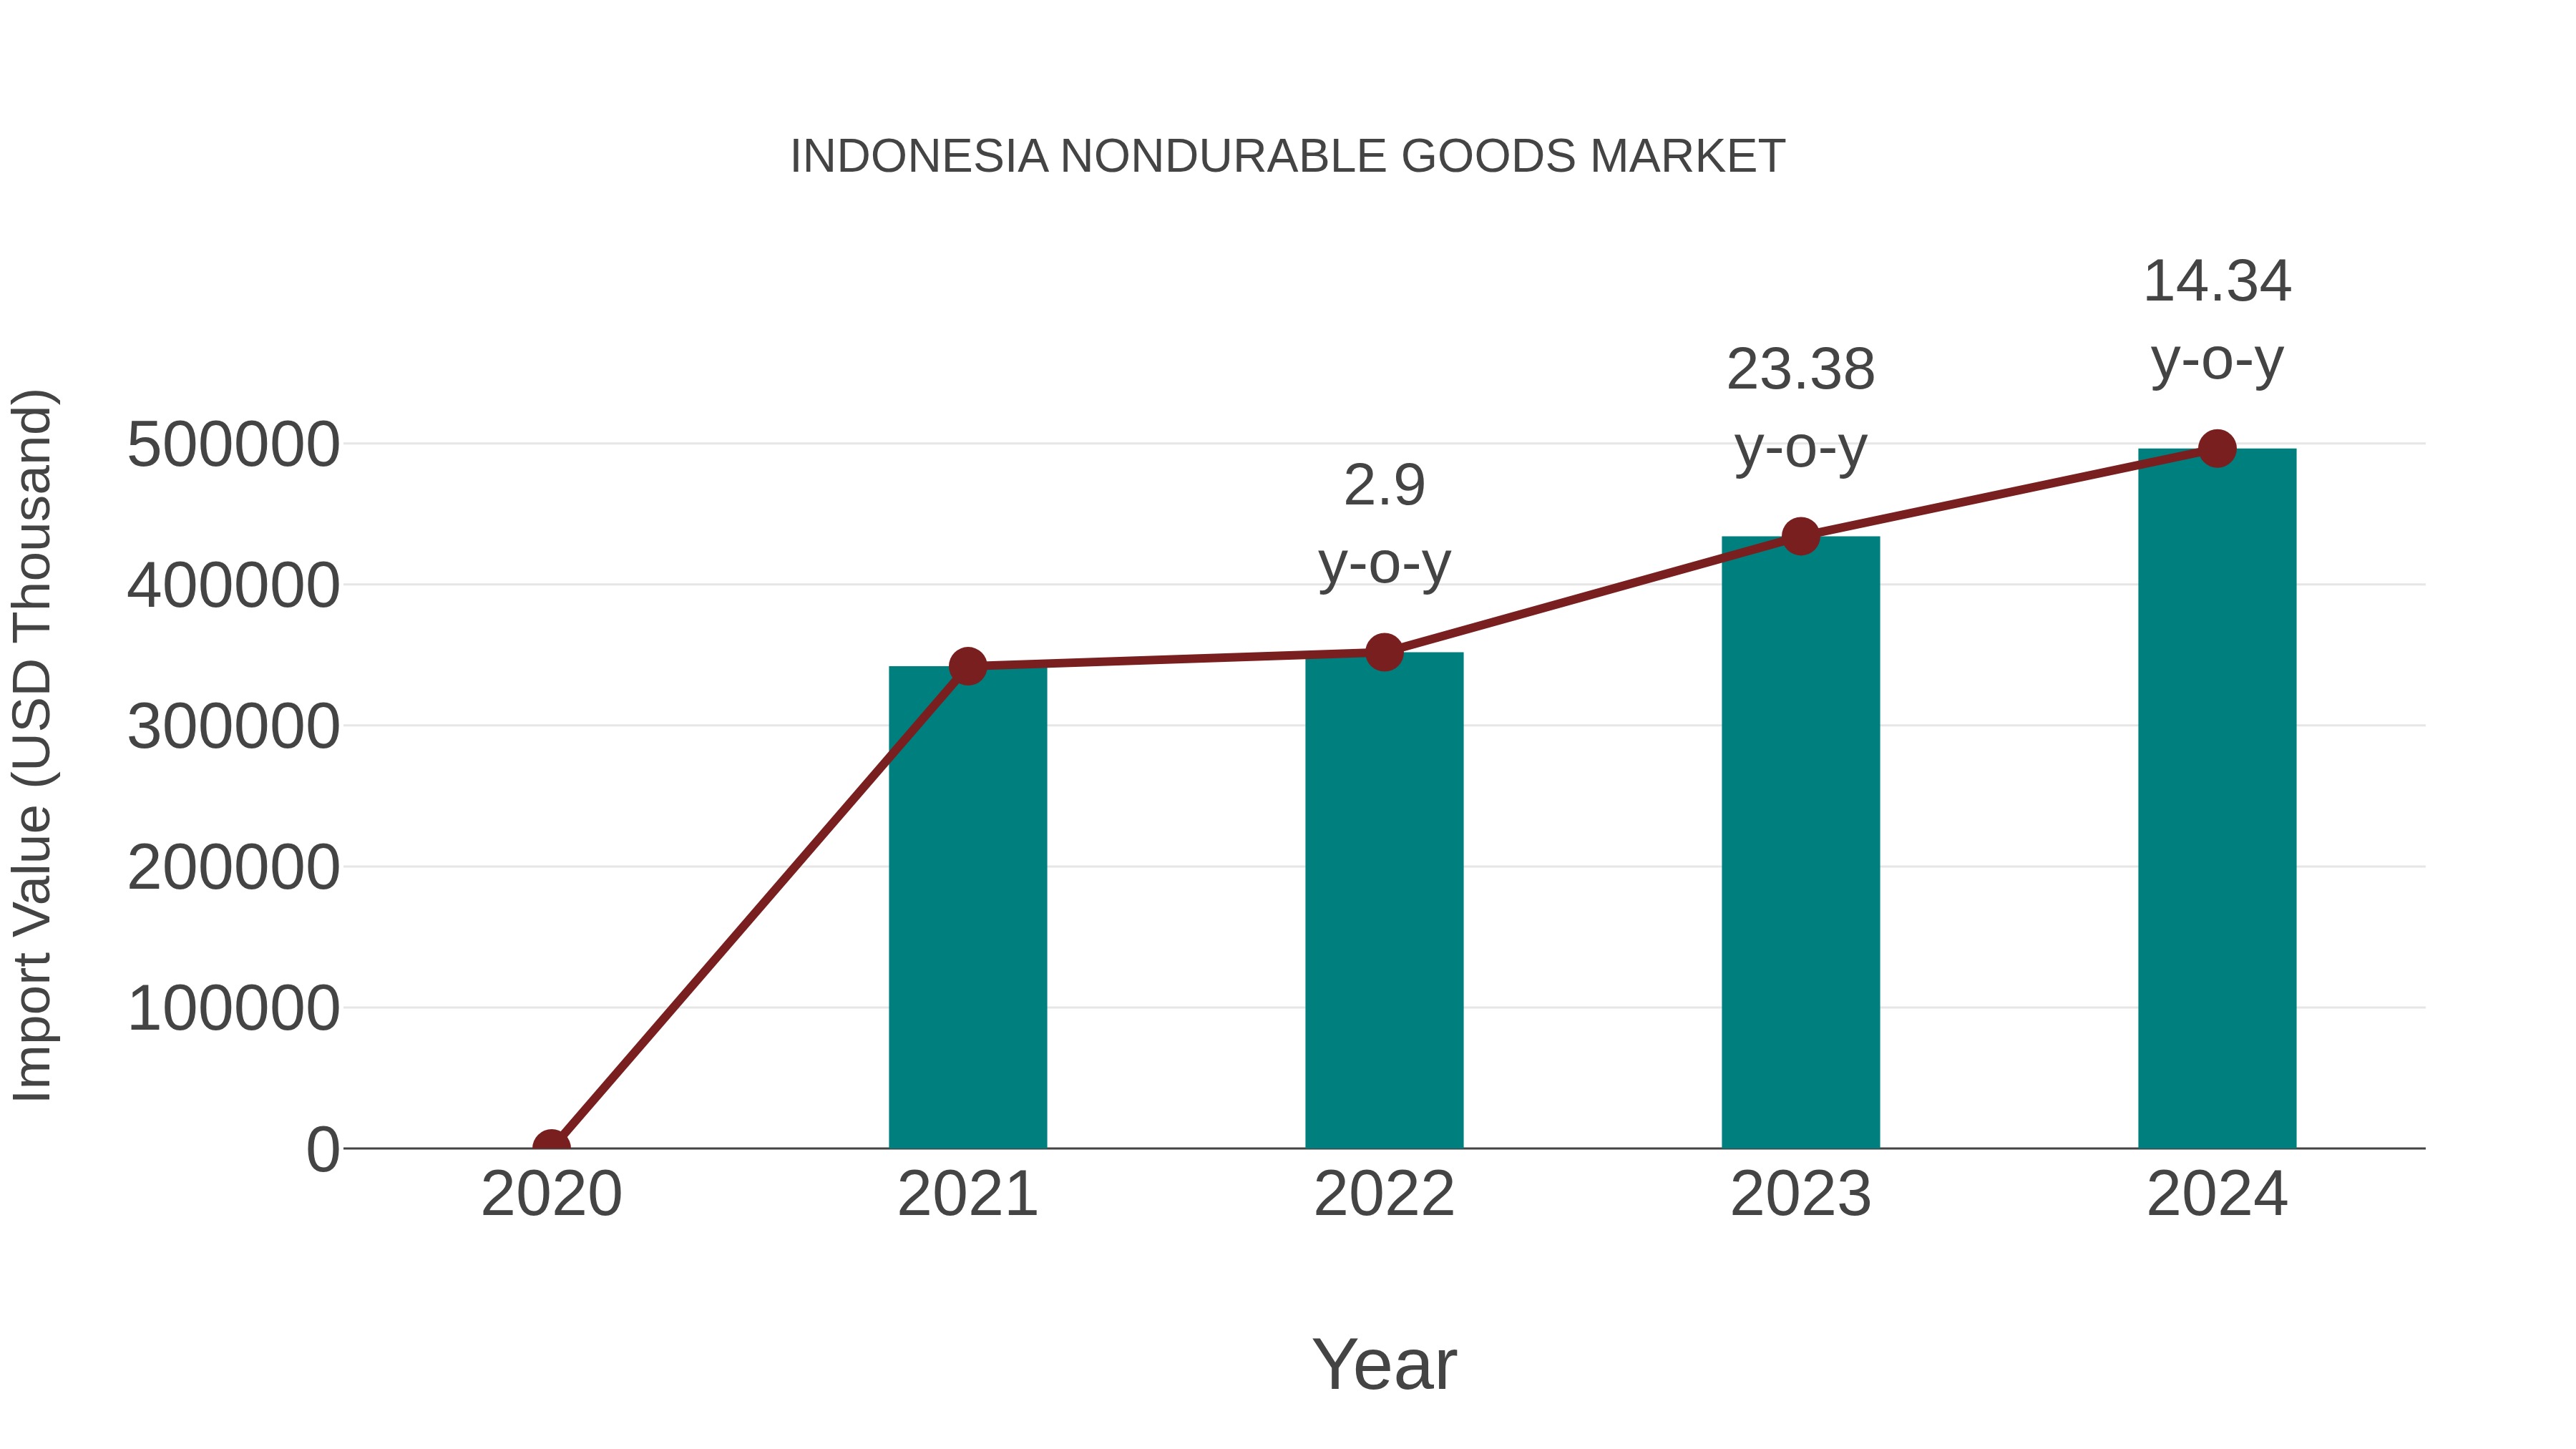
Indonesia Nondurable Goods Market: Import Trend Analysis
In the Indonesia nondurable goods market, the import trend exhibited a notable growth rate of 14.34% from 2023 to 2024, with a compound annual growth rate (CAGR) of 13.23% for the period 2020-2024. This import momentum likely reflects a sustained demand shift towards nondurable goods in Indonesia, driven by changing consumer preferences or market dynamics.
Indonesia Nondurable Goods Market Synopsis
The Indonesia nondurable goods market is estimated to reach a value of US$ 23. 7 billion in 2025, growing at a CAGR of 11. 5% in the coming years. The diversified consumer base and increasing disposable income are expected to drive the demand for non-durables within the country. Moreover, rapid urbanization and rising awareness about health-related products are also anticipated to boost the market growth during the forecast period (2025-2031).
Drivers of the Market
the nondurable goods market is driven by the increasing demand for everyday consumer products, such as food, beverages, toiletries, and textiles. As the population continues to grow and urbanization accelerates, the consumption of these nondurable goods is expected to rise.
Challenges of the Market
n the Indonesia Nondurable Goods Market, businesses may face various challenges in a rapidly evolving economic landscape. With changing consumer preferences and purchasing behavior, companies must continually adapt their strategies to meet the demands of the market. Additionally, increased competition from both domestic and international players can put pressure on profit margins and market share.
COVID-19 Impact on the Market
The outbreak of COVID-19 had a significant impact on various sectors of the Indonesian economy, including the markets for nondurable goods, paint rollers, palladium, pen holders, pen nibs, perfume atomizers and sprayers, piezoelectric materials, platinum ingots, and plumbing fixtures.
Key Highlights of the Report:
- Indonesia Nondurable Goods Market Outlook
- Market Size of Indonesia Nondurable Goods Market, 2025
- Forecast of Indonesia Nondurable Goods Market, 2032
- Historical Data and Forecast of Indonesia Nondurable Goods Revenues & Volume for the Period 2022-2032F
- Indonesia Nondurable Goods Market Trend Evolution
- Indonesia Nondurable Goods Market Drivers and Challenges
- Indonesia Nondurable Goods Price Trends
- Indonesia Nondurable Goods Porter's Five Forces
- Indonesia Nondurable Goods Industry Life Cycle
- Historical Data and Forecast of Indonesia Nondurable Goods Market Revenues & Volume By Product Type for the Period 2022-2032F
- Historical Data and Forecast of Indonesia Nondurable Goods Market Revenues & Volume By Food for the Period 2022-2032F
- Historical Data and Forecast of Indonesia Nondurable Goods Market Revenues & Volume By Drinks for the Period 2022-2032F
- Historical Data and Forecast of Indonesia Nondurable Goods Market Revenues & Volume By Medication for the Period 2022-2032F
- Historical Data and Forecast of Indonesia Nondurable Goods Market Revenues & Volume By Cleaning Supplies for the Period 2022-2032F
- Historical Data and Forecast of Indonesia Nondurable Goods Market Revenues & Volume By Cosmetics for the Period 2022-2032F
- Historical Data and Forecast of Indonesia Nondurable Goods Market Revenues & Volume By Office Supplies for the Period 2022-2032F
- Historical Data and Forecast of Indonesia Nondurable Goods Market Revenues & Volume By Apparel for the Period 2022-2032F
- Historical Data and Forecast of Indonesia Food Nondurable Goods Market Revenues & Volume By Cigarettes And Tobacco for the Period 2022-2032F
- Historical Data and Forecast of Indonesia Nondurable Goods Market Revenues & Volume By Applications for the Period 2022-2032F
- Historical Data and Forecast of Indonesia Nondurable Goods Market Revenues & Volume By Offline for the Period 2022-2032F
- Historical Data and Forecast of Indonesia Nondurable Goods Market Revenues & Volume By Online for the Period 2022-2032F
- Indonesia Nondurable Goods Import Export Trade Statistics
- Market Opportunity Assessment By Product Type
- Market Opportunity Assessment By Applications
- Indonesia Nondurable Goods Top Companies Market Share
- Indonesia Nondurable Goods Competitive Benchmarking By Technical and Operational Parameters
- Indonesia Nondurable Goods Company Profiles
- Indonesia Nondurable Goods Key Strategic Recommendations
Indonesia Nondurable Goods Market (2026-2032): FAQs
6Wresearch actively monitors the Indonesia Nondurable Goods Market and publishes its comprehensive annual report, highlighting emerging trends, growth drivers, revenue analysis, and forecast outlook. Our insights help businesses to make data-backed strategic decisions with ongoing market dynamics. Our analysts track relevent industries related to the Indonesia Nondurable Goods Market, allowing our clients with actionable intelligence and reliable forecasts tailored to emerging regional needs.
Yes, we provide customisation as per your requirements. To learn more, feel free to contact us on sales@6wresearch.com
1 Executive Summary |
2 Introduction |
2.1 Key Highlights of the Report |
2.2 Report Description |
2.3 Market Scope & Segmentation |
2.4 Research Methodology |
2.5 Assumptions |
3 Indonesia Nondurable Goods Market Overview |
3.1 Indonesia Country Macro Economic Indicators |
3.2 Indonesia Nondurable Goods Market Revenues & Volume, 2022 & 2032F |
3.3 Indonesia Nondurable Goods Market - Industry Life Cycle |
3.4 Indonesia Nondurable Goods Market - Porter's Five Forces |
3.5 Indonesia Nondurable Goods Market Revenues & Volume Share, By Product Type, 2022 & 2032F |
3.6 Indonesia Nondurable Goods Market Revenues & Volume Share, By Applications, 2022 & 2032F |
4 Indonesia Nondurable Goods Market Dynamics |
4.1 Impact Analysis |
4.2 Market Drivers |
4.2.1 Growing population and increasing urbanization in Indonesia leading to higher demand for nondurable goods. |
4.2.2 Rising disposable income levels and changing consumer preferences towards convenience and lifestyle products. |
4.2.3 Government initiatives to boost domestic manufacturing and reduce import dependency in the nondurable goods sector. |
4.3 Market Restraints |
4.3.1 Volatile raw material prices impacting production costs and profitability of nondurable goods manufacturers. |
4.3.2 Intense competition among local and international brands leading to pricing pressures and margin erosion. |
4.3.3 Economic instability and currency fluctuations affecting consumer purchasing power and overall demand for nondurable goods. |
5 Indonesia Nondurable Goods Market Trends |
6 Indonesia Nondurable Goods Market, By Types |
6.1 Indonesia Nondurable Goods Market, By Product Type |
6.1.1 Overview and Analysis |
6.1.2 Indonesia Nondurable Goods Market Revenues & Volume, By Product Type, 2022-2032F |
6.1.3 Indonesia Nondurable Goods Market Revenues & Volume, By Food, 2022-2032F |
6.1.4 Indonesia Nondurable Goods Market Revenues & Volume, By Drinks, 2022-2032F |
6.1.5 Indonesia Nondurable Goods Market Revenues & Volume, By Medication, 2022-2032F |
6.1.6 Indonesia Nondurable Goods Market Revenues & Volume, By Cleaning Supplies, 2022-2032F |
6.1.7 Indonesia Nondurable Goods Market Revenues & Volume, By Cosmetics, 2022-2032F |
6.1.8 Indonesia Nondurable Goods Market Revenues & Volume, By Office Supplies, 2022-2032F |
6.1.9 Indonesia Nondurable Goods Market Revenues & Volume, By Cigarettes And Tobacco, 2022-2032F |
6.1.10 Indonesia Nondurable Goods Market Revenues & Volume, By Cigarettes And Tobacco, 2022-2032F |
6.2 Indonesia Nondurable Goods Market, By Applications |
6.2.1 Overview and Analysis |
6.2.2 Indonesia Nondurable Goods Market Revenues & Volume, By Offline, 2022-2032F |
6.2.3 Indonesia Nondurable Goods Market Revenues & Volume, By Online, 2022-2032F |
7 Indonesia Nondurable Goods Market Import-Export Trade Statistics |
7.1 Indonesia Nondurable Goods Market Export to Major Countries |
7.2 Indonesia Nondurable Goods Market Imports from Major Countries |
8 Indonesia Nondurable Goods Market Key Performance Indicators |
8.1 Consumer sentiment index measuring the confidence levels of Indonesian consumers in the economy and their willingness to spend on nondurable goods. |
8.2 Retail foot traffic data indicating the level of consumer engagement and interest in purchasing nondurable goods. |
8.3 Household savings rate reflecting the propensity of households to allocate funds towards nondurable goods purchases. |
9 Indonesia Nondurable Goods Market - Opportunity Assessment |
9.1 Indonesia Nondurable Goods Market Opportunity Assessment, By Product Type, 2022 & 2032F |
9.2 Indonesia Nondurable Goods Market Opportunity Assessment, By Applications, 2022 & 2032F |
10 Indonesia Nondurable Goods Market - Competitive Landscape |
10.1 Indonesia Nondurable Goods Market Revenue Share, By Companies, 2025 |
10.2 Indonesia Nondurable Goods Market Competitive Benchmarking, By Operating and Technical Parameters |
11 Company Profiles |
12 Recommendations |
13 Disclaimer |
Global Go To Market Strategy - 2030
Export potential enables firms to identify high-growth global markets with greater confidence by combining advanced trade intelligence with a structured quantitative methodology. The framework analyzes emerging demand trends and country-level import patterns while integrating macroeconomic and trade datasets such as GDP and population forecasts, bilateral import–export flows, tariff structures, elasticity differentials between developed and developing economies, geographic distance, and import demand projections. Using weighted trade values from 2020–2024 as the base period to project country-to-country export potential for 2030, these inputs are operationalized through calculated drivers such as gravity model parameters, tariff impact factors, and projected GDP per-capita growth. Through an analysis of hidden potentials, demand hotspots, and market conditions that are most favorable to success, this method enables firms to focus on target countries, maximize returns, and global expansion with data, backed by accuracy.
By factoring in the projected importer demand gap that is currently unmet and could be potential opportunity, it identifies the potential for the Exporter (Country) among 190 countries, against the general trade analysis, which identifies the biggest importer or exporter.
To discover high-growth global markets and optimize your business strategy:
Click Here
Pricing
- Single User License$ 1,995
- Department License$ 2,400
- Site License$ 3,120
- Global License$ 3,795

Leadership Perspectives from Industry Events
Search
Thought Leadership and Analyst Meet


Our Clients
6WResearch In News
- India Air Conditioner Market Set for Strong Rebound in 2026 After Weather-Led Correction and GST-Driven Recovery: 6Wresearch
- ADAS in India: How Automatic Emergency Braking, Blind Spot Detection & Driver Monitoring are Transforming Road Safety
- Doha a strategic location for EV manufacturing hub: IPA Qatar
- Demand for luxury TVs surging in the GCC, says Samsung
- Empowering Growth: The Thriving Journey of Bangladesh’s Cable Industry
- Demand for luxury TVs surging in the GCC, says Samsung
Latest Reports
- Poland Fire Protection Systems Market (2026-2032)
- Cape Verde Portable Hand-Thrown Extinguisher Market (2026-2032)
- Canada Portable Hand-Thrown Extinguisher Market (2026-2032)
- Cameroon Portable Hand-Thrown Extinguisher Market (2026-2032)
- Burundi Portable Hand-Thrown Extinguisher Market (2026-2032)
- Burkina Faso Portable Hand-Thrown Extinguisher Market (2026-2032)
- Bulgaria Portable Hand-Thrown Extinguisher Market (2026-2032)
- Brunei Portable Hand-Thrown Extinguisher Market (2026-2032)
- Botswana Portable Hand-Thrown Extinguisher Market (2026-2032)
- Bosnia and Herzegovina Portable Hand-Thrown Extinguisher Market (2026-2032)
Industry Events and Analyst Meet

HIMTEX 2026

India Refining Summit 2026

India EV Show 2026

EV tech India Expo 2026

Auto Tech Asia 2026
Whitepaper
- Middle East & Africa Commercial Security Market Click here to view more.
- Middle East & Africa Fire Safety Systems & Equipment Market Click here to view more.
- GCC Drone Market Click here to view more.
- Middle East Lighting Fixture Market Click here to view more.
- GCC Physical & Perimeter Security Market Click here to view more.