Indonesia Polyurethane (PU) Microspheres Market (2026-2032) Outlook | Trends, Companies, Share, Forecast, Growth, Size, Value, Industry, Revenue & Analysis
Market Forecast By Applications (Encapsulation, Paints & coatings, Adhesives films, Cosmetics, Other applications) And Competitive Landscape
| Product Code: ETC4512209 | Publication Date: Jul 2023 | Updated Date: Mar 2026 | Product Type: Report | |
| Publisher: 6Wresearch | Author: Ravi Bhandari | No. of Pages: 85 | No. of Figures: 45 | No. of Tables: 25 |
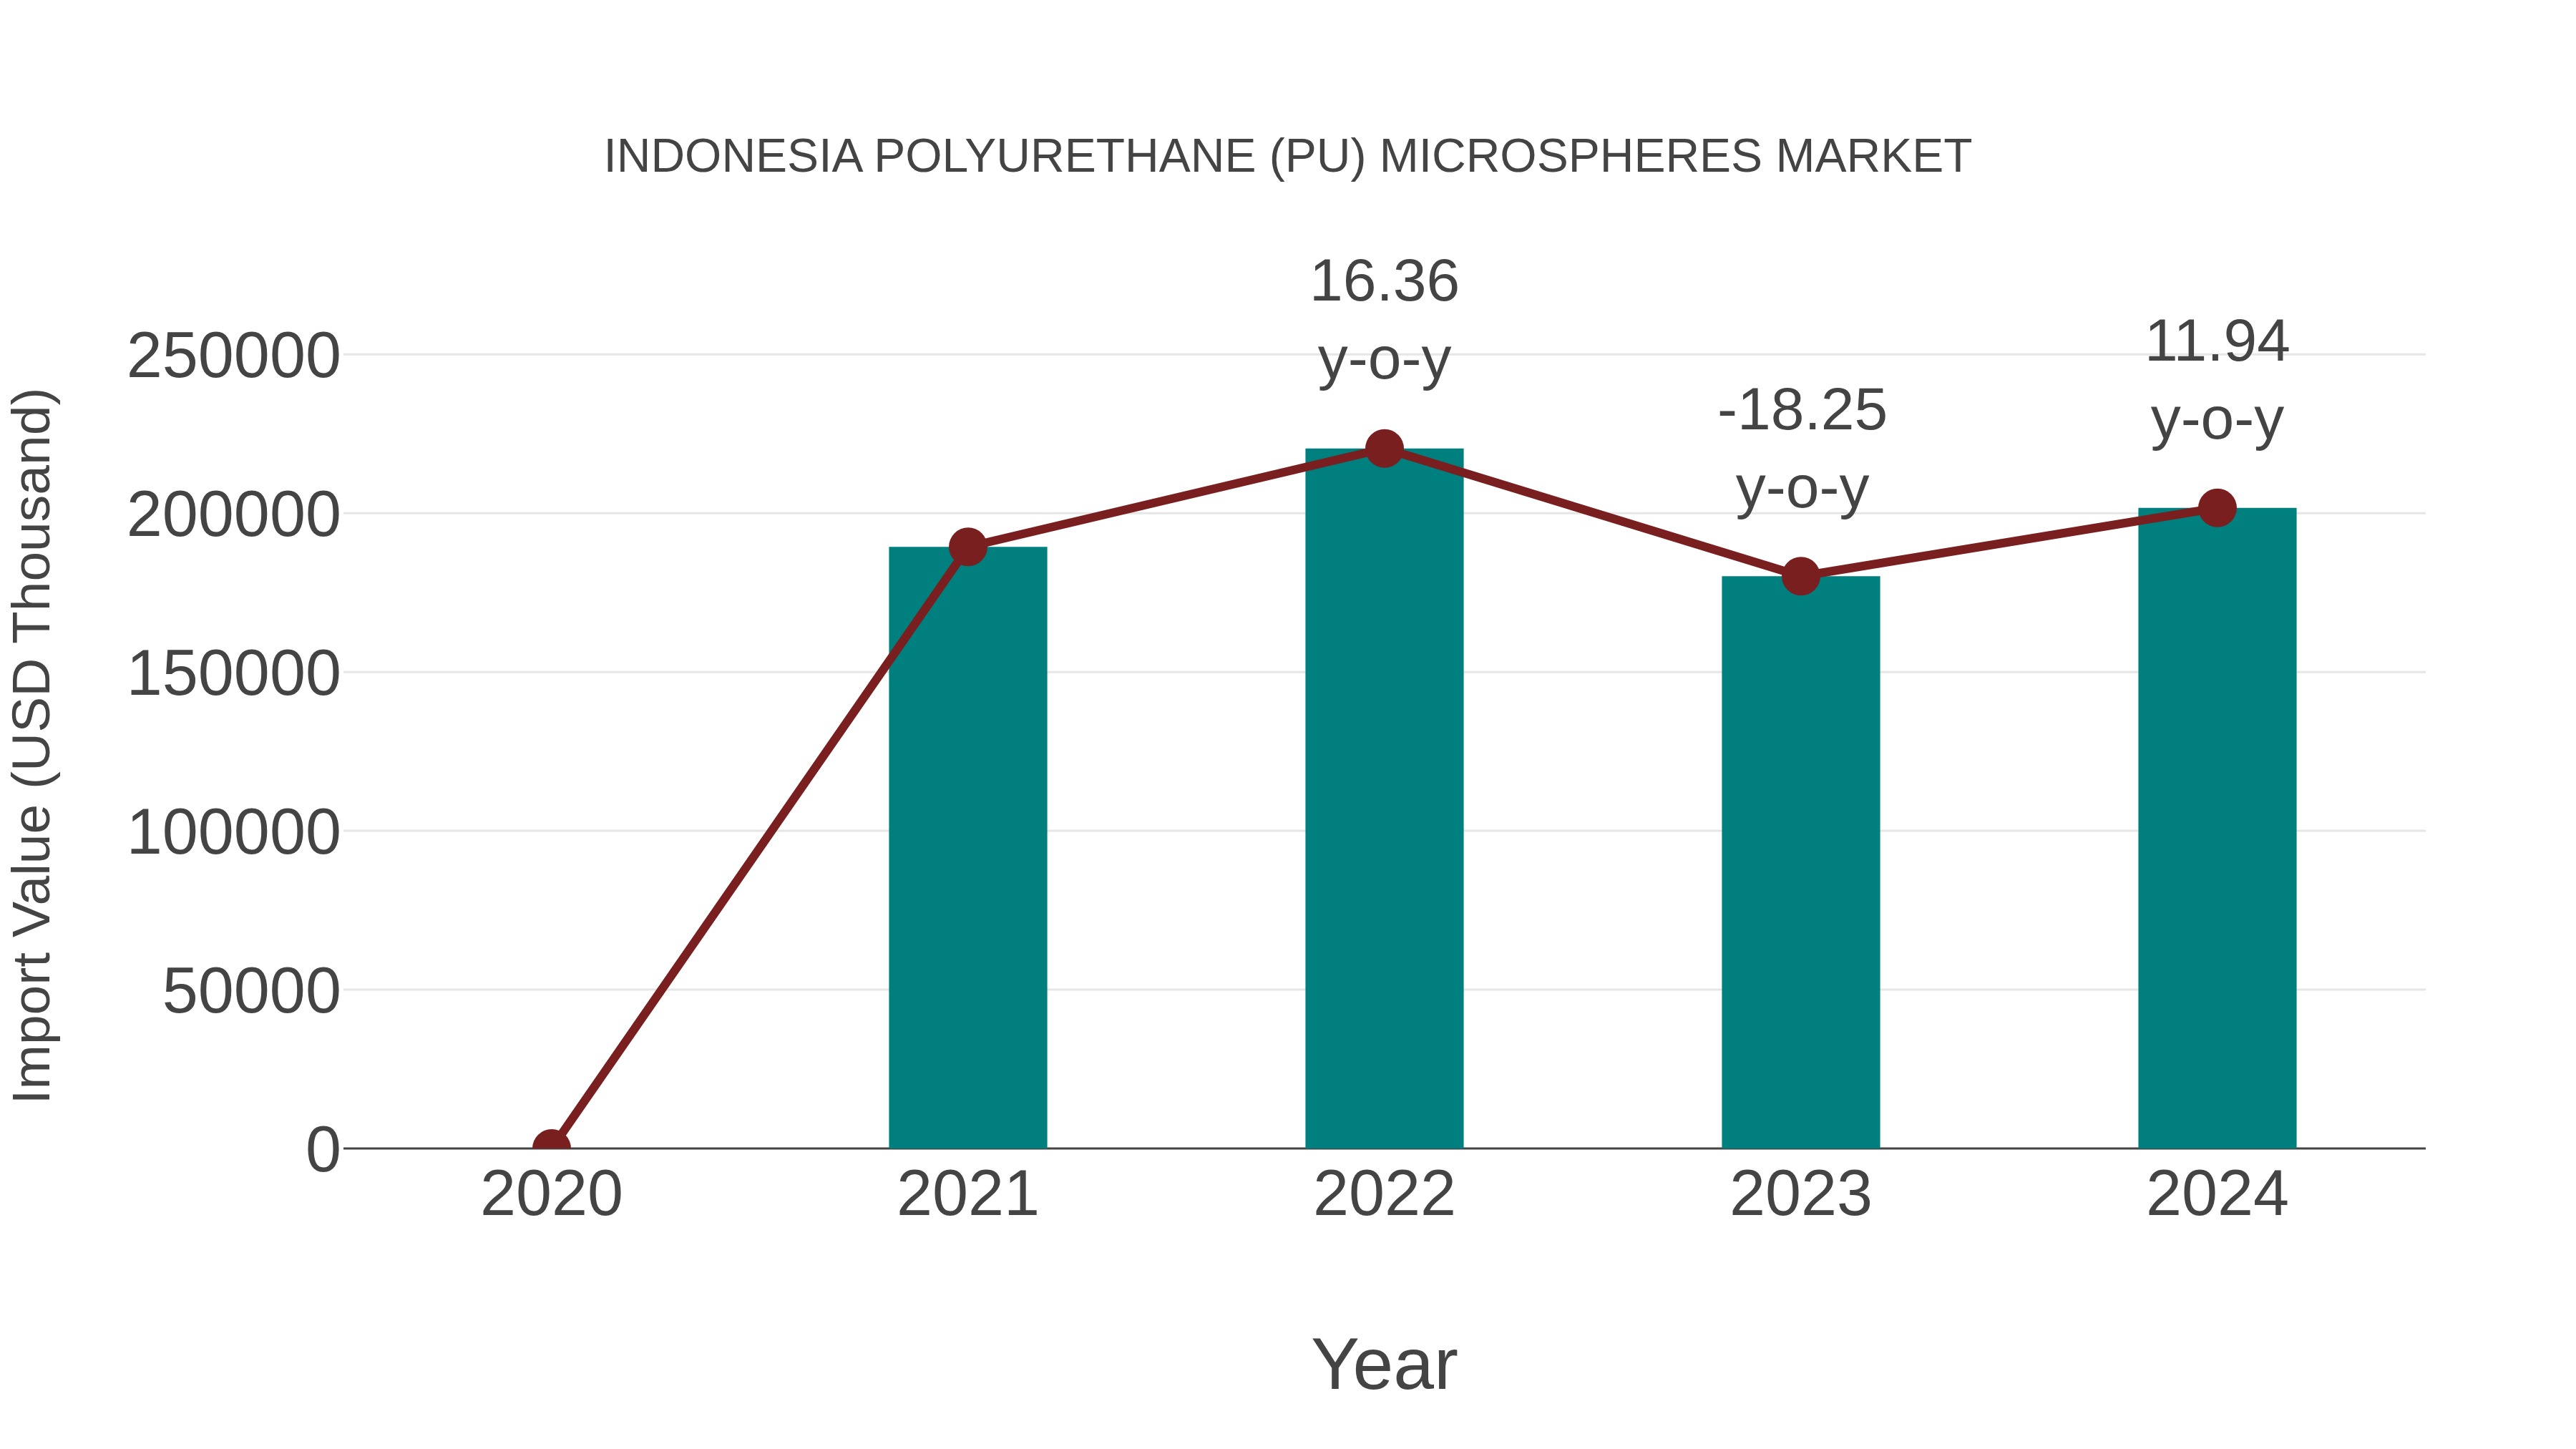
Indonesia Polyurethane (Pu) Microspheres Market: Import Trend Analysis
Indonesia`s import momentum for polyurethane (PU) microspheres saw a notable increase from 2023 to 2024, with a growth rate of 11.94%. The compound annual growth rate (CAGR) for the period of 2020 to 2024 stood at 2.12%. This growth can be attributed to a shift in demand towards PU microspheres, possibly driven by advancements in industries requiring these materials or changes in trade policies promoting imports.
Indonesia Polyurethane Pu Microspheres Market Overview
Indonesia`s polyurethane microspheres market is experiencing growth as industries recognize their value as lightweight fillers, additives, and carriers. From cosmetics to composites, these microspheres enhance product performance and quality across diverse applications.
Drivers of the Market
The Indonesia Polyurethane PU Microspheres market is primarily driven by the automotive and coatings industries. PU microspheres, known for their lightweight and insulating properties, find extensive use in automotive components and coatings formulations. The demand for lightweight materials to enhance fuel efficiency in vehicles is a significant driver. Additionally, the expanding construction and architectural coatings sector are contributing to the growing adoption of PU microspheres.
Challenges of the Market
The Indonesian polyurethane microspheres market encounters difficulties in achieving a balance between cost-effectiveness and producing high-quality microspheres. Furthermore, ensuring a sustainable and eco-friendly production process is essential but can be challenging.
COVID-19 Impacts on the Market
The PU microspheres market faced challenges during the pandemic, especially in industries like automotive and construction where these materials are commonly used. Reduced production and construction activities impacted the demand for PU microspheres.
Key Players of the Makret
Leading participants in the PU microspheres market include Merck KGaA, SpheriTech, and Stepan Company. They offer microsphere products used in a variety of applications, such as paints, coatings, and composites.
Key Highlights of the Report:
- Indonesia Polyurethane (PU) Microspheres Market Outlook
- Market Size of Indonesia Polyurethane (PU) Microspheres Market, 2025
- Forecast of Indonesia Polyurethane (PU) Microspheres Market, 2032
- Historical Data and Forecast of Indonesia Polyurethane (PU) Microspheres Revenues & Volume for the Period 2022-2032F
- Indonesia Polyurethane (PU) Microspheres Market Trend Evolution
- Indonesia Polyurethane (PU) Microspheres Market Drivers and Challenges
- Indonesia Polyurethane (PU) Microspheres Price Trends
- Indonesia Polyurethane (PU) Microspheres Porter's Five Forces
- Indonesia Polyurethane (PU) Microspheres Industry Life Cycle
- Historical Data and Forecast of Indonesia Polyurethane (PU) Microspheres Market Revenues & Volume By Applications for the Period 2022-2032F
- Historical Data and Forecast of Indonesia Polyurethane (PU) Microspheres Market Revenues & Volume By Encapsulation for the Period 2022-2032F
- Historical Data and Forecast of Indonesia Polyurethane (PU) Microspheres Market Revenues & Volume By Paints & coatings for the Period 2022-2032F
- Historical Data and Forecast of Indonesia Polyurethane (PU) Microspheres Market Revenues & Volume By Adhesives films for the Period 2022-2032F
- Historical Data and Forecast of Indonesia Polyurethane (PU) Microspheres Market Revenues & Volume By Cosmetics for the Period 2022-2032F
- Historical Data and Forecast of Indonesia Polyurethane (PU) Microspheres Market Revenues & Volume By Other applications for the Period 2022-2032F
- Indonesia Polyurethane (PU) Microspheres Import Export Trade Statistics
- Market Opportunity Assessment By Applications
- Indonesia Polyurethane (PU) Microspheres Top Companies Market Share
- Indonesia Polyurethane (PU) Microspheres Competitive Benchmarking By Technical and Operational Parameters
- Indonesia Polyurethane (PU) Microspheres Company Profiles
- Indonesia Polyurethane (PU) Microspheres Key Strategic Recommendations
Indonesia Polyurethane (PU) Microspheres Market (2026-2032): FAQs
6Wresearch actively monitors the Indonesia Polyurethane (PU) Microspheres Market and publishes its comprehensive annual report, highlighting emerging trends, growth drivers, revenue analysis, and forecast outlook. Our insights help businesses to make data-backed strategic decisions with ongoing market dynamics. Our analysts track relevent industries related to the Indonesia Polyurethane (PU) Microspheres Market, allowing our clients with actionable intelligence and reliable forecasts tailored to emerging regional needs.
Yes, we provide customisation as per your requirements. To learn more, feel free to contact us on sales@6wresearch.com
1 Executive Summary |
2 Introduction |
2.1 Key Highlights of the Report |
2.2 Report Description |
2.3 Market Scope & Segmentation |
2.4 Research Methodology |
2.5 Assumptions |
3 Indonesia Polyurethane (PU) Microspheres Market Overview |
3.1 Indonesia Country Macro Economic Indicators |
3.2 Indonesia Polyurethane (PU) Microspheres Market Revenues & Volume, 2022 & 2032F |
3.3 Indonesia Polyurethane (PU) Microspheres Market - Industry Life Cycle |
3.4 Indonesia Polyurethane (PU) Microspheres Market - Porter's Five Forces |
3.5 Indonesia Polyurethane (PU) Microspheres Market Revenues & Volume Share, By Applications, 2022 & 2032F |
4 Indonesia Polyurethane (PU) Microspheres Market Dynamics |
4.1 Impact Analysis |
4.2 Market Drivers |
4.2.1 Increasing demand for lightweight materials in various industries such as automotive, construction, and packaging |
4.2.2 Growing awareness about the benefits of using polyurethane microspheres in coatings, adhesives, and sealants |
4.2.3 Technological advancements leading to the development of innovative applications for polyurethane microspheres |
4.3 Market Restraints |
4.3.1 Fluctuations in raw material prices impacting production costs |
4.3.2 Stringent regulations related to environmental concerns and product safety |
4.3.3 Competition from alternative materials in the market |
5 Indonesia Polyurethane (PU) Microspheres Market Trends |
6 Indonesia Polyurethane (PU) Microspheres Market, By Types |
6.1 Indonesia Polyurethane (PU) Microspheres Market, By Applications |
6.1.1 Overview and Analysis |
6.1.2 Indonesia Polyurethane (PU) Microspheres Market Revenues & Volume, By Applications, 2022-2032F |
6.1.3 Indonesia Polyurethane (PU) Microspheres Market Revenues & Volume, By Encapsulation, 2022-2032F |
6.1.4 Indonesia Polyurethane (PU) Microspheres Market Revenues & Volume, By Paints & coatings, 2022-2032F |
6.1.5 Indonesia Polyurethane (PU) Microspheres Market Revenues & Volume, By Adhesives films, 2022-2032F |
6.1.6 Indonesia Polyurethane (PU) Microspheres Market Revenues & Volume, By Cosmetics, 2022-2032F |
6.1.7 Indonesia Polyurethane (PU) Microspheres Market Revenues & Volume, By Other applications, 2022-2032F |
7 Indonesia Polyurethane (PU) Microspheres Market Import-Export Trade Statistics |
7.1 Indonesia Polyurethane (PU) Microspheres Market Export to Major Countries |
7.2 Indonesia Polyurethane (PU) Microspheres Market Imports from Major Countries |
8 Indonesia Polyurethane (PU) Microspheres Market Key Performance Indicators |
8.1 Research and development investment in new polyurethane microsphere applications |
8.2 Percentage increase in adoption of polyurethane microspheres in key industries |
8.3 Number of patents filed for polyurethane microsphere technology |
8.4 Growth in number of partnerships and collaborations for product development and market expansion |
9 Indonesia Polyurethane (PU) Microspheres Market - Opportunity Assessment |
9.1 Indonesia Polyurethane (PU) Microspheres Market Opportunity Assessment, By Applications, 2022 & 2032F |
10 Indonesia Polyurethane (PU) Microspheres Market - Competitive Landscape |
10.1 Indonesia Polyurethane (PU) Microspheres Market Revenue Share, By Companies, 2025 |
10.2 Indonesia Polyurethane (PU) Microspheres Market Competitive Benchmarking, By Operating and Technical Parameters |
11 Company Profiles |
12 Recommendations |
13 Disclaimer |
Global Go To Market Strategy - 2030
Export potential enables firms to identify high-growth global markets with greater confidence by combining advanced trade intelligence with a structured quantitative methodology. The framework analyzes emerging demand trends and country-level import patterns while integrating macroeconomic and trade datasets such as GDP and population forecasts, bilateral import–export flows, tariff structures, elasticity differentials between developed and developing economies, geographic distance, and import demand projections. Using weighted trade values from 2020–2024 as the base period to project country-to-country export potential for 2030, these inputs are operationalized through calculated drivers such as gravity model parameters, tariff impact factors, and projected GDP per-capita growth. Through an analysis of hidden potentials, demand hotspots, and market conditions that are most favorable to success, this method enables firms to focus on target countries, maximize returns, and global expansion with data, backed by accuracy.
By factoring in the projected importer demand gap that is currently unmet and could be potential opportunity, it identifies the potential for the Exporter (Country) among 190 countries, against the general trade analysis, which identifies the biggest importer or exporter.
To discover high-growth global markets and optimize your business strategy:
Click Here
Pricing
- Single User License$ 1,995
- Department License$ 2,400
- Site License$ 3,120
- Global License$ 3,795

Leadership Perspectives from Industry Events
Search
Thought Leadership and Analyst Meet


Our Clients
6WResearch In News
- Doha a strategic location for EV manufacturing hub: IPA Qatar
- Demand for luxury TVs surging in the GCC, says Samsung
- Empowering Growth: The Thriving Journey of Bangladesh’s Cable Industry
- Demand for luxury TVs surging in the GCC, says Samsung
- Video call with a traditional healer? Once unthinkable, it’s now common in South Africa
- Intelligent Buildings To Smooth GCC’s Path To Net Zero
Latest Reports
- Cape Verde Portable Hand-Thrown Extinguisher Market (2026-2032)
- Canada Portable Hand-Thrown Extinguisher Market (2026-2032)
- Cameroon Portable Hand-Thrown Extinguisher Market (2026-2032)
- Burundi Portable Hand-Thrown Extinguisher Market (2026-2032)
- Burkina Faso Portable Hand-Thrown Extinguisher Market (2026-2032)
- Bulgaria Portable Hand-Thrown Extinguisher Market (2026-2032)
- Brunei Portable Hand-Thrown Extinguisher Market (2026-2032)
- Botswana Portable Hand-Thrown Extinguisher Market (2026-2032)
- Bosnia and Herzegovina Portable Hand-Thrown Extinguisher Market (2026-2032)
- Bolivia Portable Hand-Thrown Extinguisher Market (2026-2032)
Industry Events and Analyst Meet

HIMTEX 2026

India Refining Summit 2026

India EV Show 2026

EV tech India Expo 2026

Auto Tech Asia 2026
Whitepaper
- Middle East & Africa Commercial Security Market Click here to view more.
- Middle East & Africa Fire Safety Systems & Equipment Market Click here to view more.
- GCC Drone Market Click here to view more.
- Middle East Lighting Fixture Market Click here to view more.
- GCC Physical & Perimeter Security Market Click here to view more.