Indonesia POS Security Market Size & Growth Rate (2026-2032)
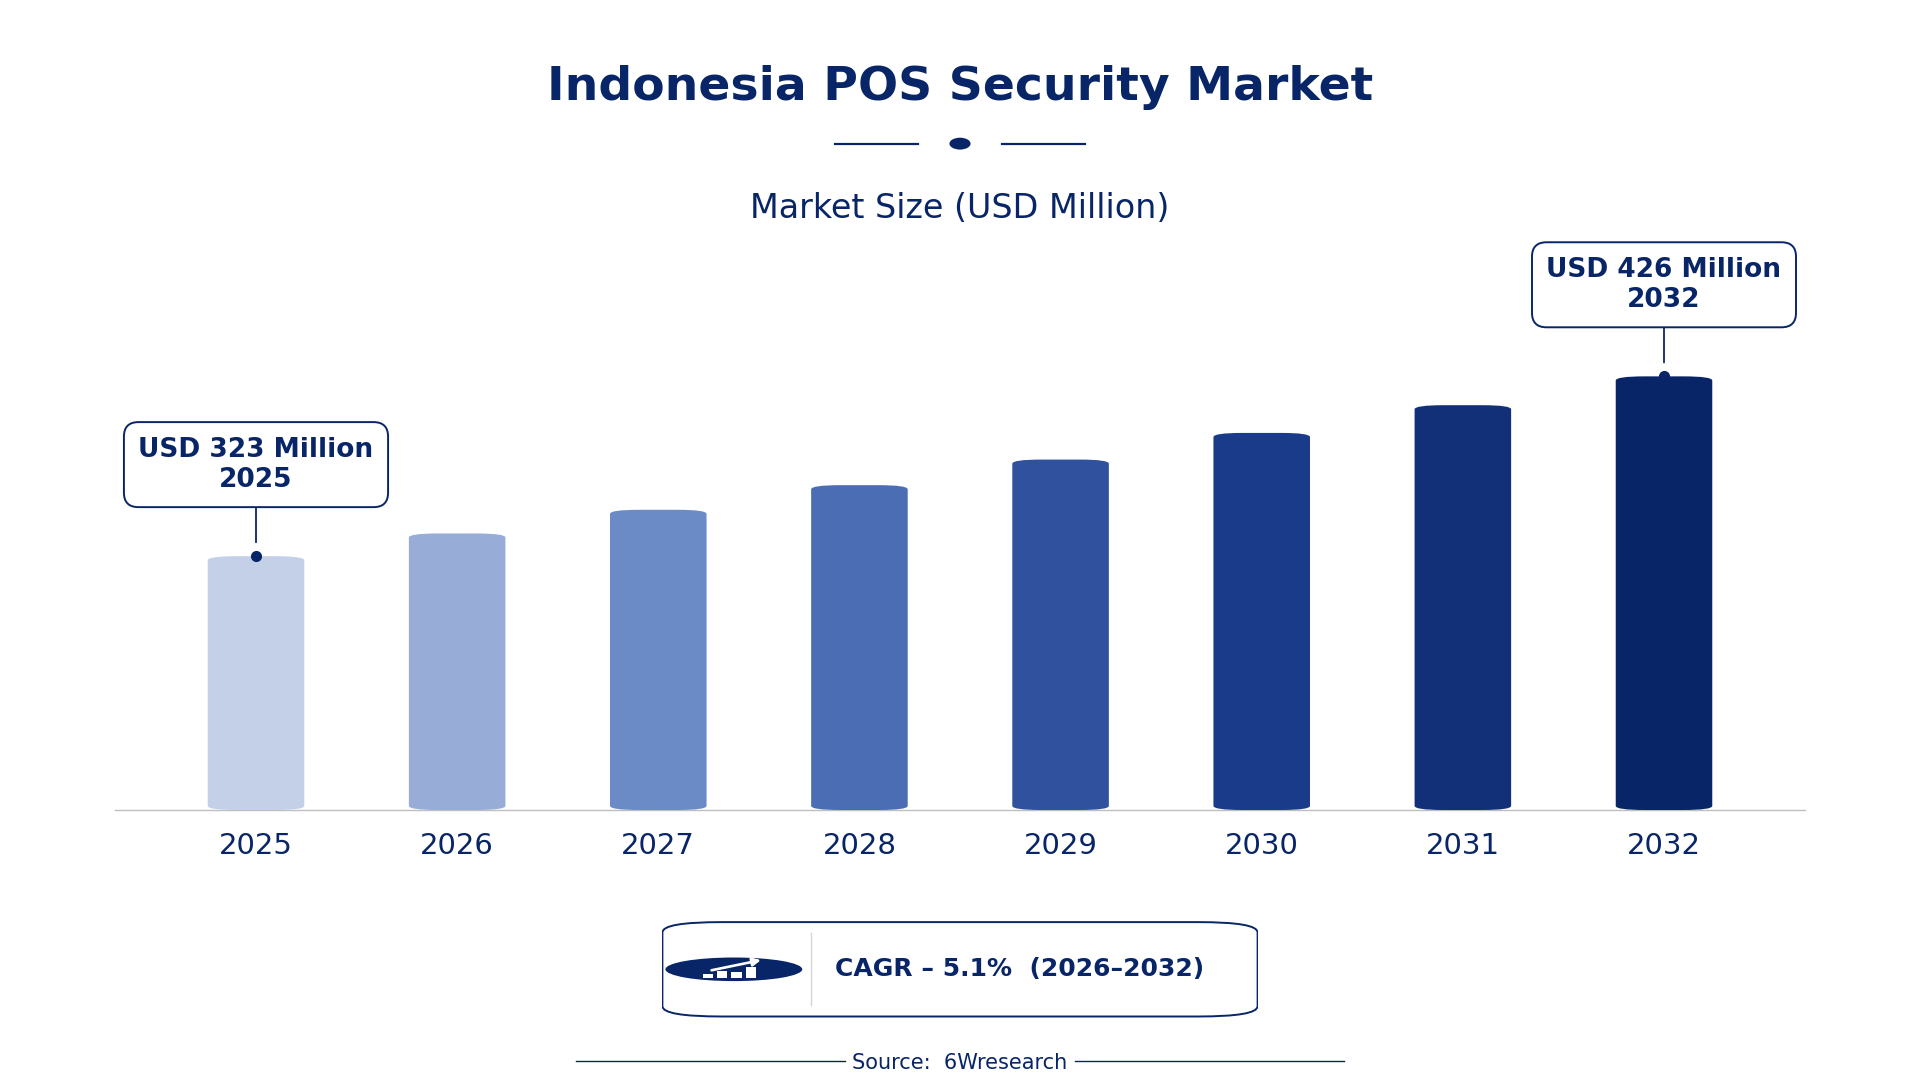
The Indonesia POS Security Market was estimated at USD 323 Million in 2025 and is projected to reach USD 426 Million by 2032, growing at a CAGR of 5.1% from 2026 to 2032.
Indonesia POS Security Market Synopsis
The POS security landscape in Indonesia is witnessing a marked transformation. As consumer preferences shift towards cashless transactions, the imperative for robust security solutions has never been more pronounced. Businesses across the retail and hospitality sectors are prioritizing the protection of payment card data, driving demand for innovative security technologies.
Adoption of advanced encryption methods, secure PIN entry devices, and point-to-point encryption is becoming standard practice. This shift not only enhances transaction security but also fortifies consumer trust, which is crucial for long-term business sustainability. The integration of these technologies is central to combating the rising tide of cyber threats targeting payment systems.
Indonesia POS Security Market Year-wise Growth Rate and Key Drivers
This graph illustrates the annual growth rates of the Indonesia POS Security Market from 2021 to 2032, highlighting a steady upward trajectory and projected expansion over the forecast period.
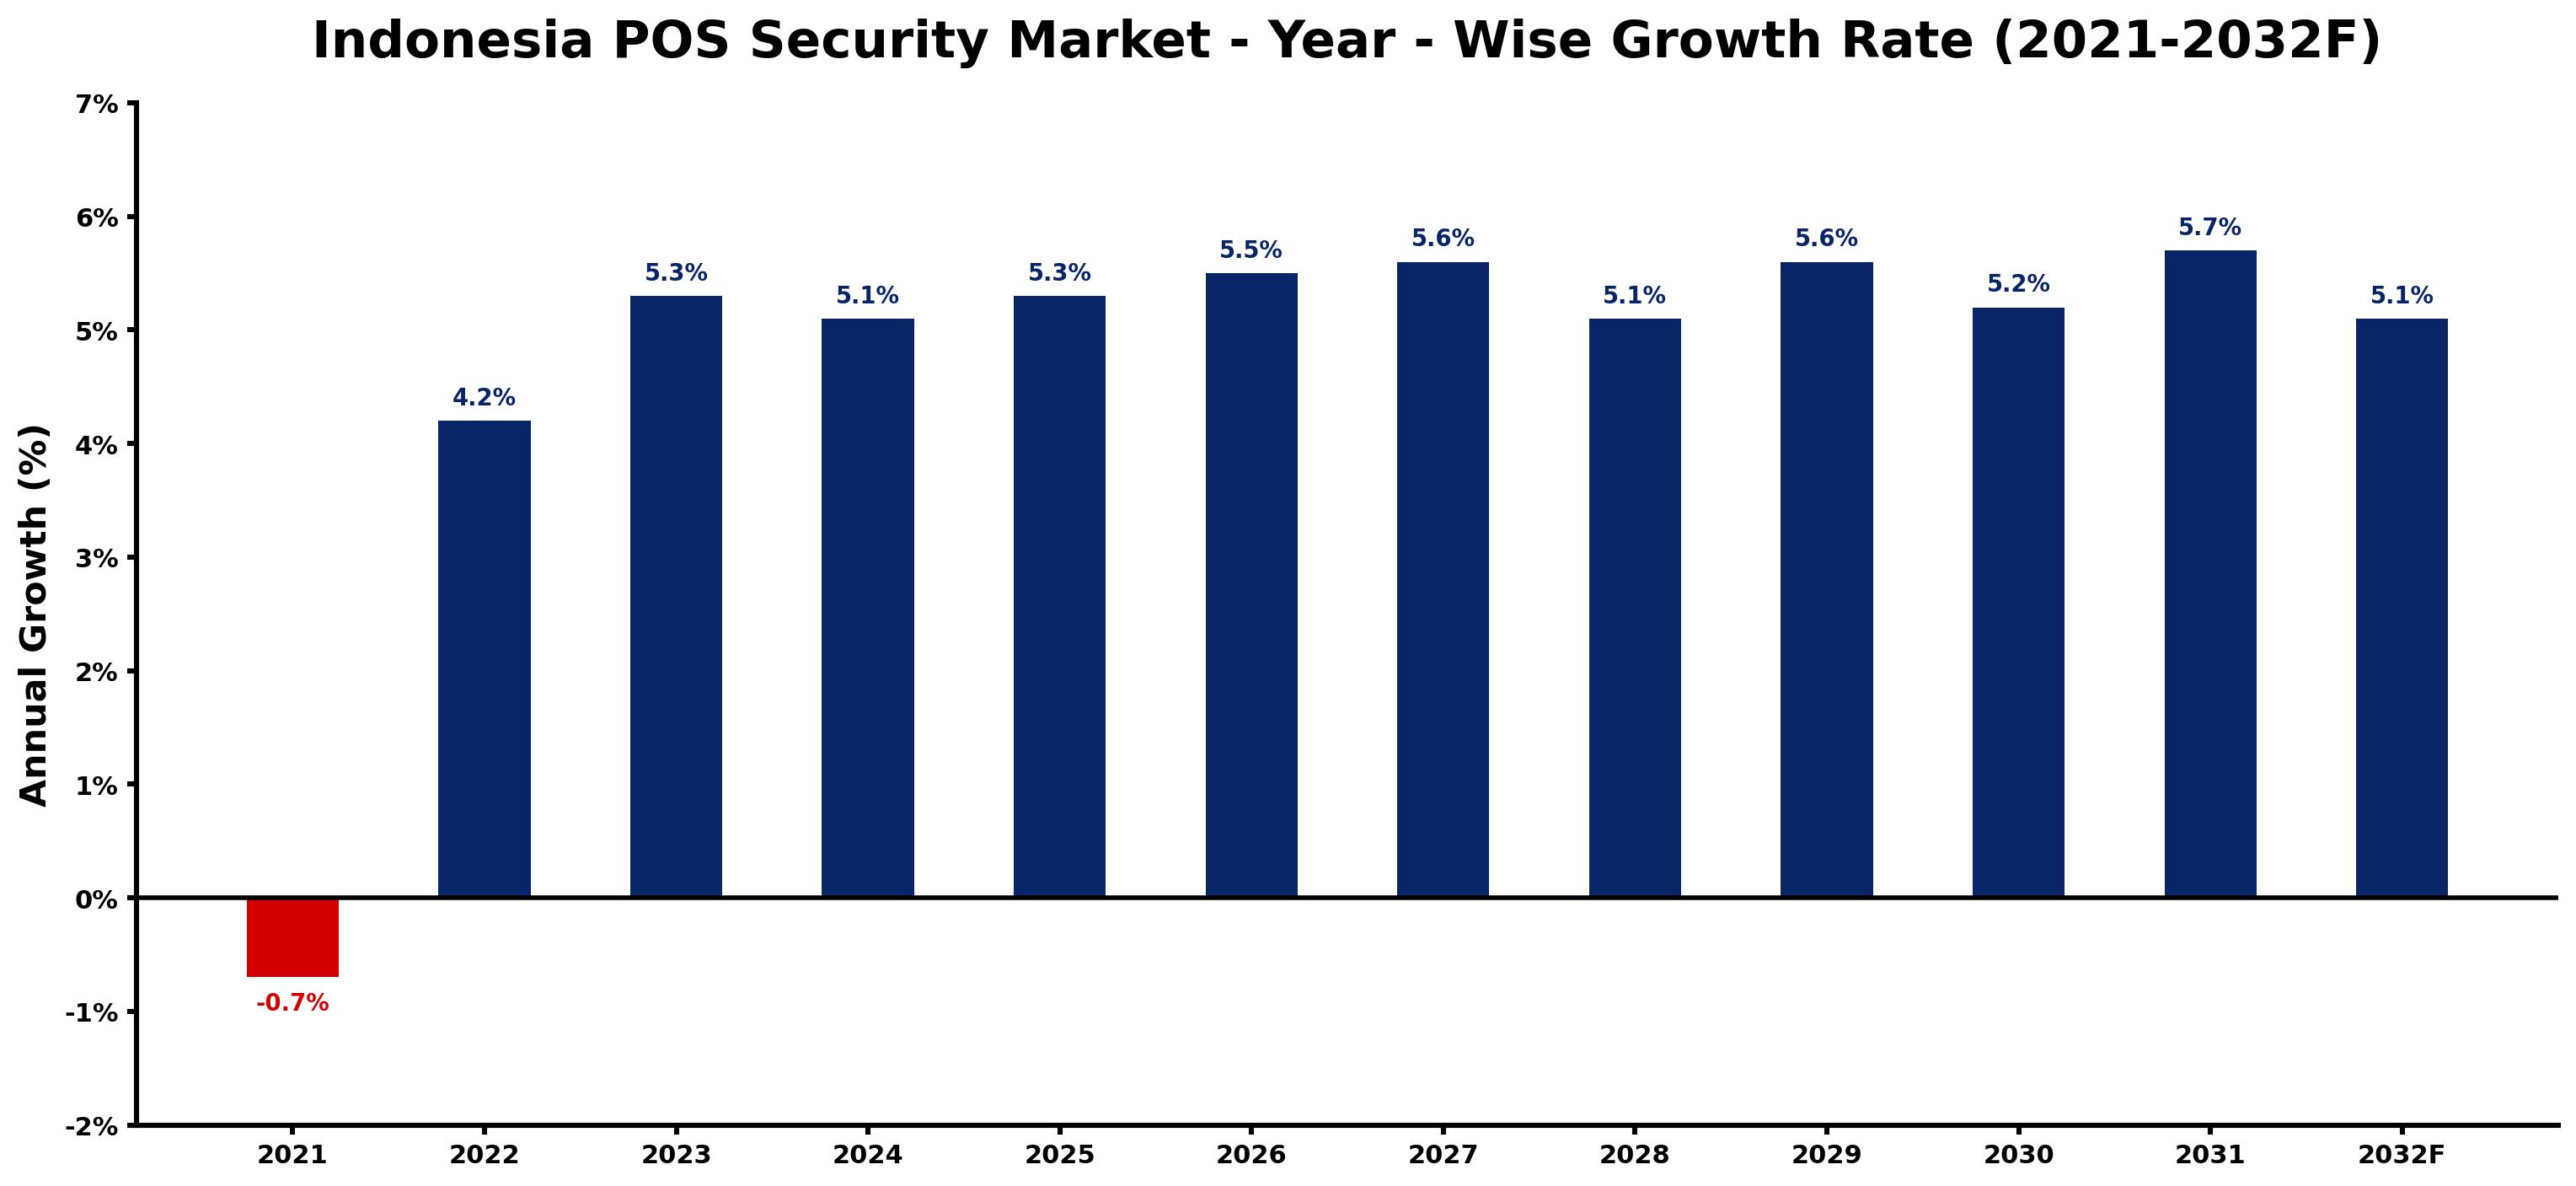
The table below presents the year‑wise growth rates along with the key drivers influencing the market
| Year | Growth Rate | Major Drivers |
| 2021 | -0.7% | Decline in consumer spending due to pandemic restrictions. |
| 2022 | 4.2% | Digitization of retail driven by government tech initiatives. |
| 2023 | 5.3% | Increased card transactions following OJK's financial inclusion policy. |
| 2024 | 5.1% | Rising e-commerce activities boosting security system investments. |
| 2025 | 5.3% | Cybersecurity awareness among retailers enhanced by regulations. |
| 2026 | 5.5% | Local fintech growth propelling demand for secure transactions. |
| 2027 | 5.6% | Consumer preference for contactless payments increasing market demand. |
| 2028 | 5.1% | Emergence of digital wallets influencing POS security upgrades. |
| 2029 | 5.6% | Government support for cybersecurity education driving industry growth. |
| 2030 | 5.2% | Increasing merchant adoption of secure integrated payment solutions. |
| 2031 | 5.7% | Investment in secure transaction technology from major retailers. |
| 2032 | 5.1% | New security standards implemented by Indonesian banking authorities. |
Note: Market size estimations and growth projections presented in this report are based on 6Wresearch's proprietary forecasting methodology, utilizing the latest available industry data, government publications, and primary research inputs.
Indonesia POS Security Market Key Takeaways
Below are some of the specific key takeaways from the market, including:
- The ongoing transition to cashless payments is a key driver for the POS security market.
- Encryption technologies and secure transaction methods are rapidly gaining traction among businesses.
- Small and medium enterprises are increasingly adopting POS systems, amplifying demand for security solutions.
- Challenges persist due to the diverse nature of businesses in Indonesia, complicating standard security practices.
- Investments in POS security are set to escalate in response to evolving cyber threats and consumer expectations.
Evaluation of Restraints in Indonesia POS Security Market
The Indonesia POS Security Market faces a set of real restraints that hinder its growth trajectory. One significant challenge is the variability in the scale and sophistication of businesses utilizing POS systems. Large retailers might implement cutting-edge security measures, but smaller vendors often lack the resources for comprehensive solutions. This disparity creates a fragmented security environment where best practices are not uniformly applied. Moreover, the pace at which cyber threats evolve can outstrip the adoption of necessary security measures, leaving gaps that are exploitable. Businesses must also ensure ongoing compliance with security regulations, which can be burdensome and complex, particularly for smaller entities.
Indonesia POS Security Market Trends
Several trends are shaping the Indonesia POS Security Market as organizations strive to enhance their security posture. The rise of mobile payments and contactless transactions is one such trend, necessitating adaptive security measures that protect evolving payment modalities. Additionally, the integration of artificial intelligence for fraud detection is gaining popularity. AI technologies can quickly analyze transaction data to identify anomalies, facilitating quicker response to potential threats. These trends indicate a market that is progressively adopting technology-driven solutions to stay ahead of security risks.
Indonesia POS Security Market Opportunities
Opportunities abound within the Indonesia POS Security Market, particularly for solution providers that can cater to the needs of diverse businesses. As cashless transactions continue to rise, there is a substantial demand for tailored security solutions that address specific vulnerabilities. Collaborations between local businesses and technology providers can foster innovation and lead to the development of customized security offerings. Moreover, as regulatory frameworks tighten, businesses will require support to meet compliance requirements, presenting avenues for service expansion in consultation and security audits.
Government Initiatives in the Indonesia POS Security Market
The Indonesian government is actively shaping the POS Security Market through various initiatives aimed at enhancing cybersecurity across sectors. Public policy is increasingly focused on establishing a safer digital environment, with regulations that mandate higher security standards for payment processing systems. This governmental push is crucial in light of the ongoing rise in cyber threats, as well as in promoting consumer confidence in digital transactions.
- A national cybersecurity framework was introduced in early 2024 to set minimum security standards for payment systems.
- Currently, the government is conducting a nationwide awareness campaign about secure online payment practices targeting businesses and consumers.
- In 2025, a public-private partnership is expected to be launched, aimed at bolstering cybersecurity measures in small and medium enterprises.
- A pilot program for advanced security training for employees in retail businesses is currently underway, focusing on the latest security protocols.
- Plans for a comprehensive regulatory review of payment processing standards are slated for 2026, anticipated to strengthen compliance mechanisms across the sector.
Future Insights of the Indonesia POS Security Market
Looking ahead to 2026-2032, the Indonesia POS Security Market is likely to continue its upward trajectory as more businesses transition to digital payment systems. The ongoing implementation of stricter regulations will further compel organizations to invest in security solutions that meet compliance criteria. Moreover, advancements in technology, such as blockchain and machine learning, may emerge as game changers for enhancing transaction security. The market is expected to evolve towards more integrated systems that not only protect data but also provide analytics for improving operational efficiency.
Indonesia POS Security Market Latest Developments
Recent activity in the Indonesia POS Security Market reveals a dynamic environment characterized by innovation and adaptation. Over the past year, businesses have been rapidly enhancing their security frameworks in response to heightened concerns over data breaches and transaction fraud. This momentum reflects the growing recognition of security as a crucial component of consumer trust and business viability.
- A major technology vendor launched an upgraded encryption solution in Q2 2025, aiming to enhance data protection for retail transactions.
- In late 2024, a leading regional operator announced a partnership to develop a suite of security tools specifically for small businesses.
- An initiative that began in early 2025 to integrate AI-driven fraud detection capabilities into existing POS systems is currently ongoing.
- A service upgrade to existing POS systems, which incorporates biometric authentication for user access, is expected to roll out by mid-2026.
- In September 2025, a regional workshop aimed at educating businesses about the latest POS security technologies was successfully held.
Indonesia POS Security Market - Key Attractiveness of the Report
- 10 Years of Market Numbers
- Historical Data Starting from 2022 to 2025
- Base Year: 2025
- Forecast Data until 2032
- Key Performance Indicators Impacting the Market
- Major Upcoming Developments and Projects
Key Highlights of the Report:
- Indonesia POS Security Market Outlook
- Market Size of Indonesia POS Security Market, 2025
- Forecast of Indonesia POS Security Market, 2032
- Historical Data and Forecast of Indonesia POS Security Revenues & Volume for the Period 2022-2032F
- Indonesia POS Security Market Trend Evolution
- Indonesia POS Security Market Drivers and Challenges
- Indonesia POS Security Price Trends
- Indonesia POS Security Porter's Five Forces
- Indonesia POS Security Industry Life Cycle
- Historical Data and Forecast of Indonesia POS Security Market Revenues & Volume By Offering for the Period 2022-2032F
- Historical Data and Forecast of Indonesia POS Security Market Revenues & Volume By Solutions for the Period 2022-2032F
- Historical Data and Forecast of Indonesia POS Security Market Revenues & Volume By Services for the Period 2022-2032F
- Historical Data and Forecast of Indonesia POS Security Market Revenues & Volume By Organization Size for the Period 2022-2032F
- Historical Data and Forecast of Indonesia POS Security Market Revenues & Volume By SMEs for the Period 2022-2032F
- Historical Data and Forecast of Indonesia POS Security Market Revenues & Volume By Large Enterprises for the Period 2022-2032F
- Historical Data and Forecast of Indonesia POS Security Market Revenues & Volume By Vertical for the Period 2022-2032F
- Historical Data and Forecast of Indonesia POS Security Market Revenues & Volume By Retail for the Period 2022-2032F
- Historical Data and Forecast of Indonesia POS Security Market Revenues & Volume By Restaurants for the Period 2022-2032F
- Historical Data and Forecast of Indonesia POS Security Market Revenues & Volume By Hospitality for the Period 2022-2032F
- Indonesia POS Security Import Export Trade Statistics
- Market Opportunity Assessment By Offering
- Market Opportunity Assessment By Organization Size
- Market Opportunity Assessment By Vertical
- Indonesia POS Security Top Companies Market Share
- Indonesia POS Security Competitive Benchmarking By Technical and Operational Parameters
- Indonesia POS Security Company Profiles
- Indonesia POS Security Key Strategic Recommendations






































