Indonesia Primers Market (2024-2030) | Revenue, Size, Companies, Share, Value, Forecast, Growth, Trends, Industry, Analysis & Outlook
Market Forecast By Material (Dispersants, Epoxy Resins, Biocides, Others), By Applications (Concrete, Wood, Metal, Plastic, Others), By End-Use Industry (Automotive, Marine, Building & Construction, Others) And Competitive Landscape
| Product Code: ETC042908 | Publication Date: Jul 2023 | Updated Date: Feb 2026 | Product Type: Report | |
| Publisher: 6Wresearch | Author: Ravi Bhandari | No. of Pages: 70 | No. of Figures: 35 | No. of Tables: 5 |
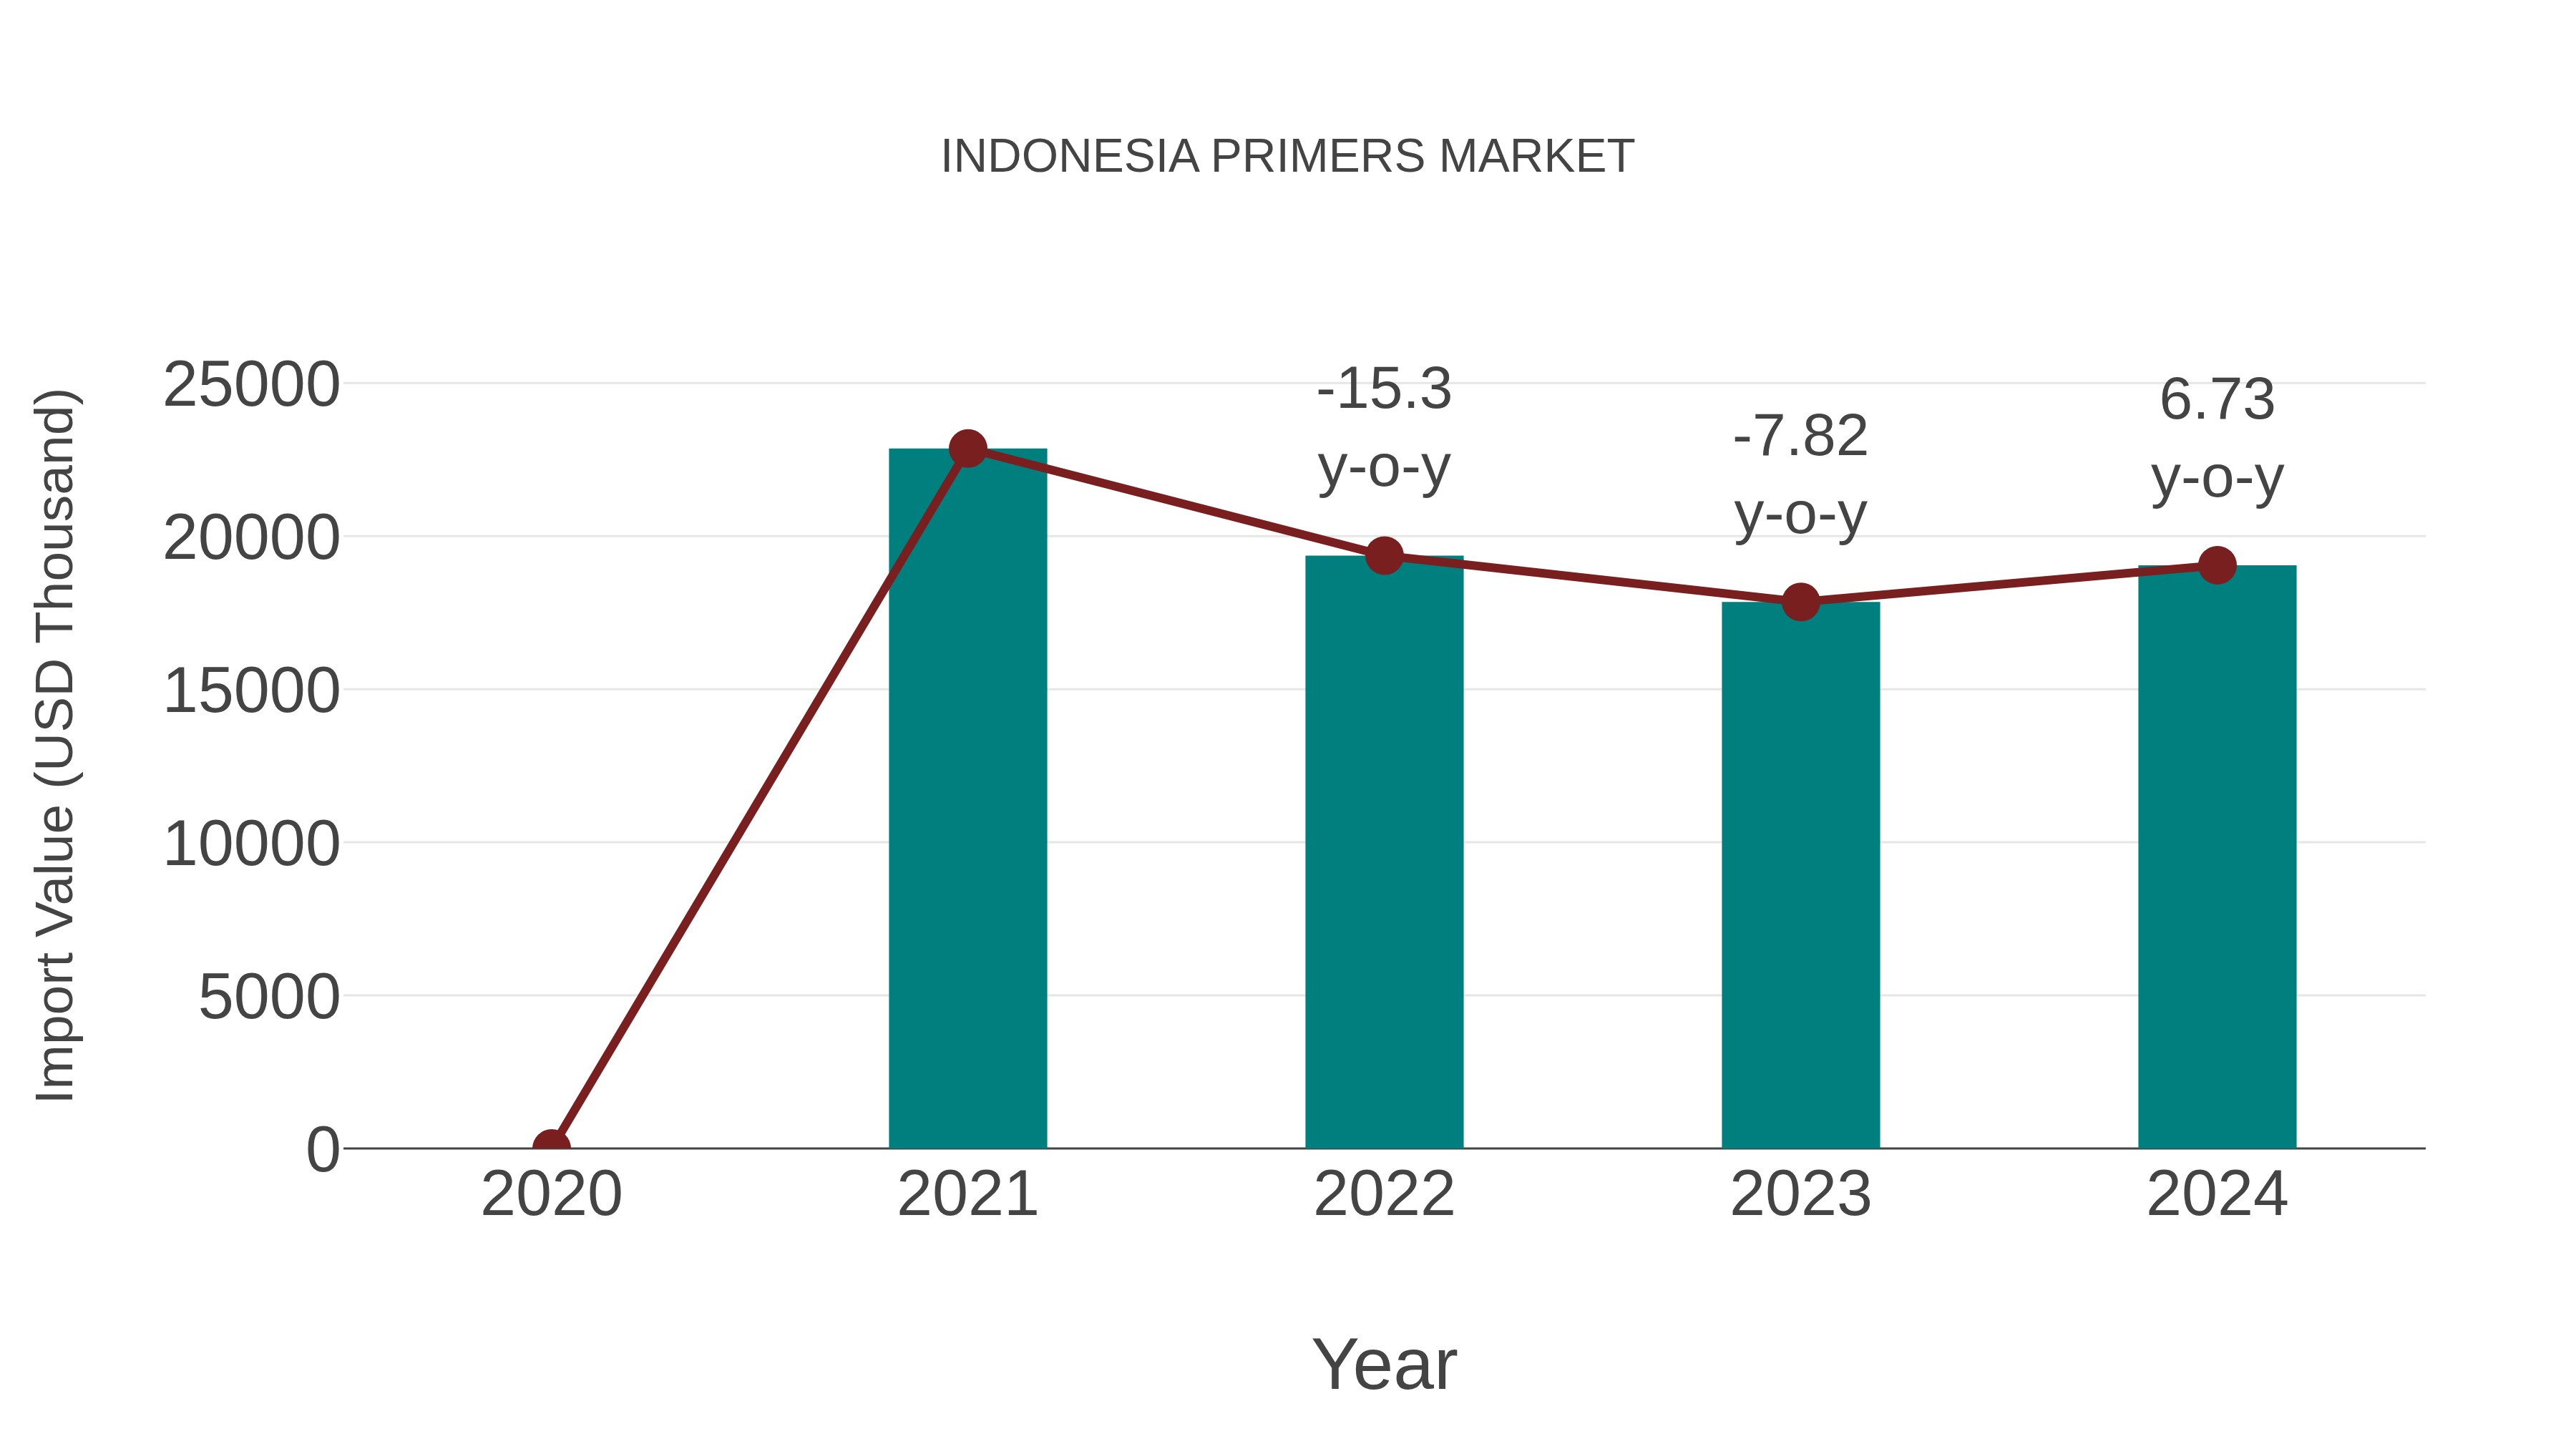
Indonesia Primers Market: Import Trend Analysis
In the Indonesia primers market, import trends saw a growth rate of 6.73% from 2023 to 2024, with a compound annual growth rate (CAGR) of -5.9% from 2020 to 2024. This decline in the CAGR could be attributed to shifts in demand dynamics or changes in trade policies affecting market stability.
Indonesia Primers Market Synopsis
The Indonesia primers market is expected to grow at a CAGR of 8.8% during theperiod 2020-2026. The increasing demand for protective and decorative coatings in different industries such as automotive manufacturing construction and other consumer goods sectors are driving theof this market. Additionally growing investments by government organizations in infrastructure projects are also propelling theof this market in Indonesia.
Key Factors Driving the Market
Growing need for protection from corrosion due to changing climatic conditions and rising industrial activities is one of the major factors responsible for drivingof primer paintglobally. Rapidly growing automobile sector along with increased spending power will propel demand from various end-use industries such as automotive transportation construction consumer electronics etc. which will further drive overallgenerated from sales of primers across Indonesia region during ed period 2020-2026. Government support towards infrastructure development has been strong over past few years owing to which there have been numerous public works projects undertaken by authorities resulting into higher adoption rate among consumers which eventually benefits primer manufacturers operating across country like Indonesia who are increasingly investing their resources towards research development (R&D) activities so as to develop technically advanced primers having superior quality and enhanced durability properties suitable across all types if weathering conditions prevalent within country?s boundaries.
Challenges Facing the Market
There exist fluctuations in prices of raw material used while manufacturing these chemicals due changes taking place within global commodities trading markets thereby leading into issues related unstable supply chain management operations making it difficult even tougher task when it comes down accurately ing ending product cost structures without any margin errors or discrepancies arising into mix thereby adversely affecting profit margins achieved through sale profits earned through sale off finished products manufactured outtakes even after effectuating price hikes upon customers side.
Key Market Players
The key players operating within Indonesia Primer Market includes Kansai Paint Co Ltd. Nippon Paint Holdings Co Ltd. BASF SEPPG Industries Inc. Akzo Nobel NVSherwin Williams CompanyAxalta Coating Systems LLCRPM International Inc. Asian Paints Limited and Sika AG.
Key Highlights of the Report:
- Indonesia Primers Market Outlook
- Market Size of Indonesia Primers Market, 2023
- Forecast of Indonesia Primers Market, 2030
- Historical Data and Forecast of Indonesia Primers Revenues & Volume for the Period 2020-2030
- Indonesia Primers Market Trend Evolution
- Indonesia Primers Market Drivers and Challenges
- Indonesia Primers Price Trends
- Indonesia Primers Porter's Five Forces
- Indonesia Primers Industry Life Cycle
- Historical Data and Forecast of Indonesia Primers Market Revenues & Volume By Material for the Period 2020-2030
- Historical Data and Forecast of Indonesia Primers Market Revenues & Volume By Dispersants for the Period 2020-2030
- Historical Data and Forecast of Indonesia Primers Market Revenues & Volume By Epoxy Resins for the Period 2020-2030
- Historical Data and Forecast of Indonesia Primers Market Revenues & Volume By Biocides for the Period 2020-2030
- Historical Data and Forecast of Indonesia Primers Market Revenues & Volume By Others for the Period 2020-2030
- Historical Data and Forecast of Indonesia Primers Market Revenues & Volume By Applications for the Period 2020-2030
- Historical Data and Forecast of Indonesia Primers Market Revenues & Volume By Concrete for the Period 2020-2030
- Historical Data and Forecast of Indonesia Primers Market Revenues & Volume By Wood for the Period 2020-2030
- Historical Data and Forecast of Indonesia Primers Market Revenues & Volume By Metal for the Period 2020-2030
- Historical Data and Forecast of Indonesia Primers Market Revenues & Volume By Plastic for the Period 2020-2030
- Historical Data and Forecast of Indonesia Primers Market Revenues & Volume By Others for the Period 2020-2030
- Historical Data and Forecast of Indonesia Primers Market Revenues & Volume By End-Use Industry for the Period 2020-2030
- Historical Data and Forecast of Indonesia Primers Market Revenues & Volume By Automotive for the Period 2020-2030
- Historical Data and Forecast of Indonesia Primers Market Revenues & Volume By Marine for the Period 2020-2030
- Historical Data and Forecast of Indonesia Primers Market Revenues & Volume By Building & Construction for the Period 2020-2030
- Historical Data and Forecast of Indonesia Primers Market Revenues & Volume By Others for the Period 2020-2030
- Indonesia Primers Import Export Trade Statistics
- Market Opportunity Assessment By Material
- Market Opportunity Assessment By Applications
- Market Opportunity Assessment By End-Use Industry
- Indonesia Primers Top Companies Market Share
- Indonesia Primers Competitive Benchmarking By Technical and Operational Parameters
- Indonesia Primers Company Profiles
- Indonesia Primers Key Strategic Recommendations
Frequently Asked Questions About the Market Study (FAQs):
6Wresearch actively monitors the Indonesia Primers Market and publishes its comprehensive annual report, highlighting emerging trends, growth drivers, revenue analysis, and forecast outlook. Our insights help businesses to make data-backed strategic decisions with ongoing market dynamics. Our analysts track relevent industries related to the Indonesia Primers Market, allowing our clients with actionable intelligence and reliable forecasts tailored to emerging regional needs.
Yes, we provide customisation as per your requirements. To learn more, feel free to contact us on sales@6wresearch.com
1 Executive Summary |
2 Introduction |
2.1 Key Highlights of the Report |
2.2 Report Description |
2.3 Market Scope & Segmentation |
2.4 Research Methodology |
2.5 Assumptions |
3 Indonesia Primers Market Overview |
3.1 Indonesia Country Macro Economic Indicators |
3.2 Indonesia Primers Market Revenues & Volume, 2020 & 2030F |
3.3 Indonesia Primers Market - Industry Life Cycle |
3.4 Indonesia Primers Market - Porter's Five Forces |
3.5 Indonesia Primers Market Revenues & Volume Share, By Material, 2020 & 2030F |
3.6 Indonesia Primers Market Revenues & Volume Share, By Applications, 2020 & 2030F |
3.7 Indonesia Primers Market Revenues & Volume Share, By End-Use Industry, 2020 & 2030F |
4 Indonesia Primers Market Dynamics |
4.1 Impact Analysis |
4.2 Market Drivers |
4.3 Market Restraints |
5 Indonesia Primers Market Trends |
6 Indonesia Primers Market, By Types |
6.1 Indonesia Primers Market, By Material |
6.1.1 Overview and Analysis |
6.1.2 Indonesia Primers Market Revenues & Volume, By Material, 2020-2030F |
6.1.3 Indonesia Primers Market Revenues & Volume, By Dispersants, 2020-2030F |
6.1.4 Indonesia Primers Market Revenues & Volume, By Epoxy Resins, 2020-2030F |
6.1.5 Indonesia Primers Market Revenues & Volume, By Biocides, 2020-2030F |
6.1.6 Indonesia Primers Market Revenues & Volume, By Others, 2020-2030F |
6.2 Indonesia Primers Market, By Applications |
6.2.1 Overview and Analysis |
6.2.2 Indonesia Primers Market Revenues & Volume, By Concrete, 2020-2030F |
6.2.3 Indonesia Primers Market Revenues & Volume, By Wood, 2020-2030F |
6.2.4 Indonesia Primers Market Revenues & Volume, By Metal, 2020-2030F |
6.2.5 Indonesia Primers Market Revenues & Volume, By Plastic, 2020-2030F |
6.2.6 Indonesia Primers Market Revenues & Volume, By Others, 2020-2030F |
6.3 Indonesia Primers Market, By End-Use Industry |
6.3.1 Overview and Analysis |
6.3.2 Indonesia Primers Market Revenues & Volume, By Automotive, 2020-2030F |
6.3.3 Indonesia Primers Market Revenues & Volume, By Marine, 2020-2030F |
6.3.4 Indonesia Primers Market Revenues & Volume, By Building & Construction, 2020-2030F |
6.3.5 Indonesia Primers Market Revenues & Volume, By Others, 2020-2030F |
7 Indonesia Primers Market Import-Export Trade Statistics |
7.1 Indonesia Primers Market Export to Major Countries |
7.2 Indonesia Primers Market Imports from Major Countries |
8 Indonesia Primers Market Key Performance Indicators |
9 Indonesia Primers Market - Opportunity Assessment |
9.1 Indonesia Primers Market Opportunity Assessment, By Material, 2020 & 2030F |
9.2 Indonesia Primers Market Opportunity Assessment, By Applications, 2020 & 2030F |
9.3 Indonesia Primers Market Opportunity Assessment, By End-Use Industry, 2020 & 2030F |
10 Indonesia Primers Market - Competitive Landscape |
10.1 Indonesia Primers Market Revenue Share, By Companies, 2023 |
10.2 Indonesia Primers Market Competitive Benchmarking, By Operating and Technical Parameters |
11 Company Profiles |
12 Recommendations |
13 Disclaimer |
Global Go To Market Strategy - 2030
Export potential enables firms to identify high-growth global markets with greater confidence by combining advanced trade intelligence with a structured quantitative methodology. The framework analyzes emerging demand trends and country-level import patterns while integrating macroeconomic and trade datasets such as GDP and population forecasts, bilateral import–export flows, tariff structures, elasticity differentials between developed and developing economies, geographic distance, and import demand projections. Using weighted trade values from 2020–2024 as the base period to project country-to-country export potential for 2030, these inputs are operationalized through calculated drivers such as gravity model parameters, tariff impact factors, and projected GDP per-capita growth. Through an analysis of hidden potentials, demand hotspots, and market conditions that are most favorable to success, this method enables firms to focus on target countries, maximize returns, and global expansion with data, backed by accuracy.
By factoring in the projected importer demand gap that is currently unmet and could be potential opportunity, it identifies the potential for the Exporter (Country) among 190 countries, against the general trade analysis, which identifies the biggest importer or exporter.
To discover high-growth global markets and optimize your business strategy:
Click Here
Pricing
- Single User License$ 1,995
- Department License$ 2,400
- Site License$ 3,120
- Global License$ 3,795

Leadership Perspectives from Industry Events
Search
Thought Leadership and Analyst Meet


Our Clients
6WResearch In News
- India Air Conditioner Market Set for Strong Rebound in 2026 After Weather-Led Correction and GST-Driven Recovery: 6Wresearch
- ADAS in India: How Automatic Emergency Braking, Blind Spot Detection & Driver Monitoring are Transforming Road Safety
- Doha a strategic location for EV manufacturing hub: IPA Qatar
- Demand for luxury TVs surging in the GCC, says Samsung
- Empowering Growth: The Thriving Journey of Bangladesh’s Cable Industry
- Demand for luxury TVs surging in the GCC, says Samsung
Latest Reports
- Poland Fire Protection Systems Market (2026-2032)
- Cape Verde Portable Hand-Thrown Extinguisher Market (2026-2032)
- Canada Portable Hand-Thrown Extinguisher Market (2026-2032)
- Cameroon Portable Hand-Thrown Extinguisher Market (2026-2032)
- Burundi Portable Hand-Thrown Extinguisher Market (2026-2032)
- Burkina Faso Portable Hand-Thrown Extinguisher Market (2026-2032)
- Bulgaria Portable Hand-Thrown Extinguisher Market (2026-2032)
- Brunei Portable Hand-Thrown Extinguisher Market (2026-2032)
- Botswana Portable Hand-Thrown Extinguisher Market (2026-2032)
- Bosnia and Herzegovina Portable Hand-Thrown Extinguisher Market (2026-2032)
Industry Events and Analyst Meet

HIMTEX 2026

India Refining Summit 2026

India EV Show 2026

EV tech India Expo 2026

Auto Tech Asia 2026
Whitepaper
- Middle East & Africa Commercial Security Market Click here to view more.
- Middle East & Africa Fire Safety Systems & Equipment Market Click here to view more.
- GCC Drone Market Click here to view more.
- Middle East Lighting Fixture Market Click here to view more.
- GCC Physical & Perimeter Security Market Click here to view more.