Indonesia Printed Circuit Boards Market (2026-2032) | Industry, Forecast, Value, Growth, Companies, Outlook, Share, Size, Revenue, Trends & Analysis
Market Forecast By Types (Single Sided, Double Sided, Multi-Layer, HDI), By Substrate (Rigid, Flexible, Rigid-Flex), By End-users (Industrial Electronics, Healthcare, Aerospace & Defense, Automotive, IT & Telecom, Consumer Electronics, Others) And Competitive Landscape
| Product Code: ETC018708 | Publication Date: Jul 2023 | Updated Date: Jun 2026 | Product Type: Report | |
| Publisher: 6Wresearch | Author: Ravi Bhandari | No. of Pages: 70 | No. of Figures: 35 | No. of Tables: 5 |
Indonesia Printed Circuit Boards Market Summary
The indonesia printed circuit boards market was estimated at USD 286 Million in 2025 and is projected to reach USD 378 Million by 2032, growing at a CAGR of 5.1% from 2026 to 2032.
Indonesia Printed Circuit Boards Market Growth Rate Analysis (2021-2032)
The Indonesian Printed Circuit Boards market has exhibited a robust recovery since a slight decline of 0.5% in 2021. Following this downturn, the market surged by 4.2% in 2022 and accelerated to 5.8% in 2023, driven by increasing consumer demand in electronics and significant investments in local manufacturing capabilities. The growth trend is expected to stabilize around 5% to 5.8% through 2032 as advancements in technology and digitalization enhance production efficiency. Additionally, supportive government policies aimed at boosting the electronics sector and infrastructure improvements further bolster market confidence. This upward trajectory reflects the dynamic interplay of industrial growth and evolving consumer preferences in Indonesia's diverse economy.
Indonesia Printed Circuit Boards Market Year-wise Growth Rate and Key Drivers
This graph highlights how the Indonesia Printed Circuit Boards Market has steadily grown over the past five years, supported by major growth factors.
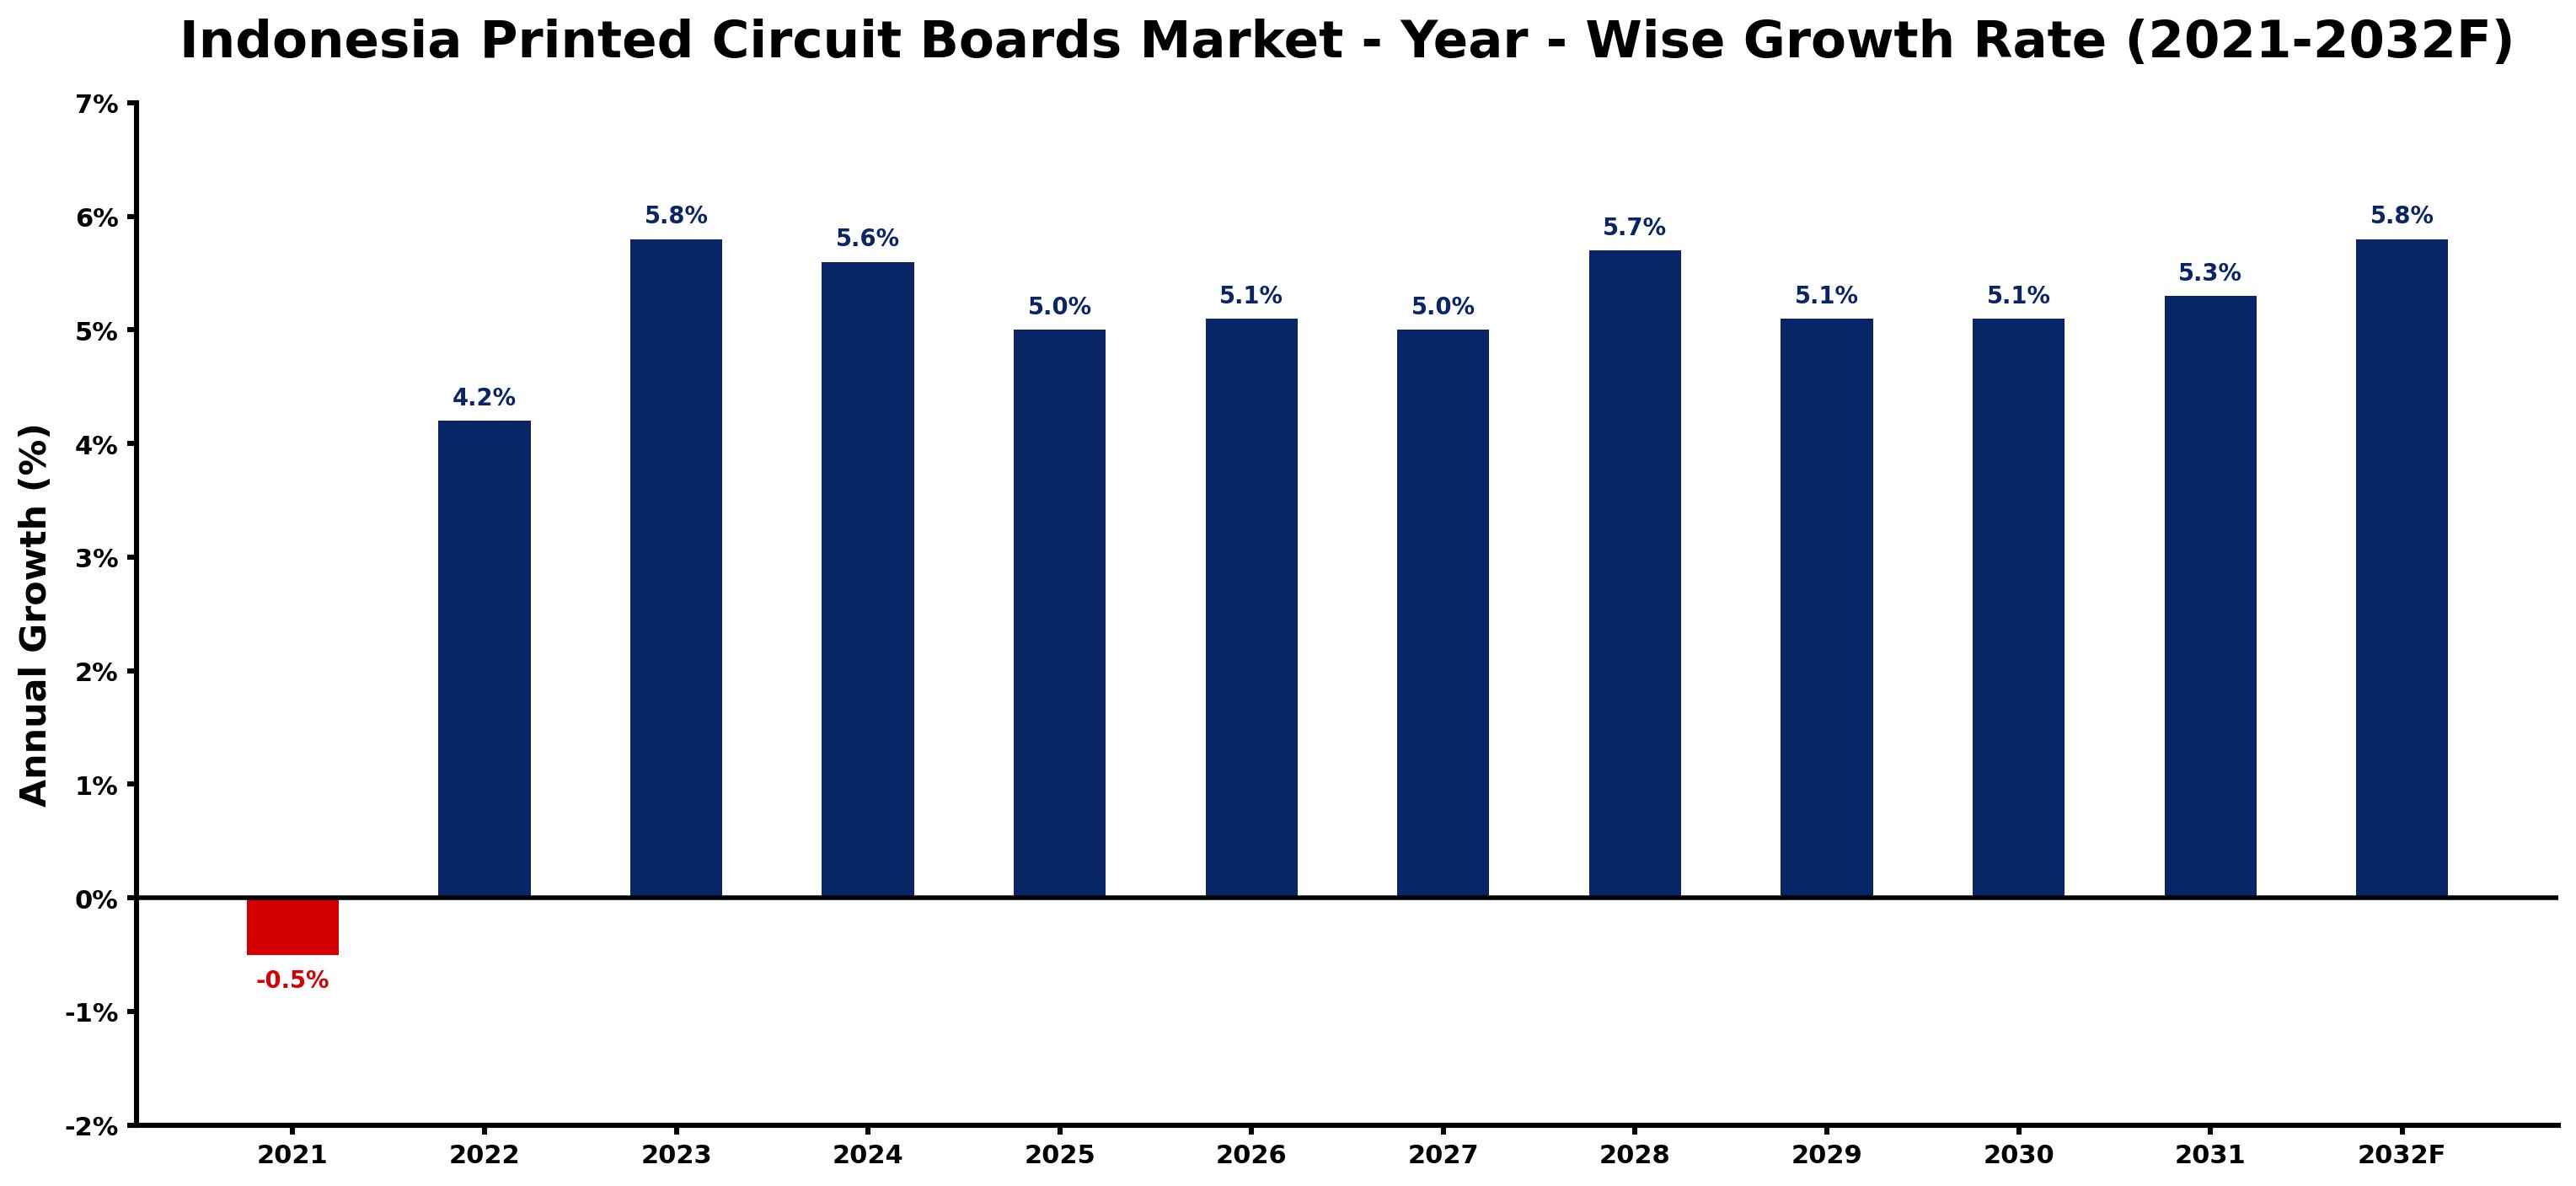
The table below presents the year wise growth rates along with the key drivers influencing the market
| Year | Growth Rate | Major Drivers |
| 2021 | -0.5% | Supply chain disruptions caused delays in manufacturing, leading to decreased availability of printed circuit boards. |
| 2022 | 4.2% | Local manufacturers focused on enhancing production capabilities to meet global standards. |
| 2023 | 5.8% | Emerging tech startups prioritized custom PCB designs for innovative product offerings. |
| 2024 | 5.6% | Investment in renewable energy infrastructure stimulated demand for specialized PCBs. |
| 2025 | 5.0% | Key industries, like automotive and telecommunications, ramped up electronics integration. |
| 2026 | 5.1% | Digital transformation initiatives in Indonesia drove innovations in electronic manufacturing processes. |
| 2027 | 5.0% | Corporate investments targeted automation technologies to streamline PCB production efficiency. |
| 2028 | 5.7% | The growing consumer electronics market encouraged local PCB firms to expand operations. |
| 2029 | 5.1% | E-commerce platforms experienced significant growth, fueling demand for electronic devices. |
| 2030 | 5.1% | Technological advancements in 5G networks created new PCB application opportunities. |
| 2031 | 5.3% | Increased collaboration with global tech firms enhanced local expertise in PCB design. |
| 2032 | 5.8% | Sustainability trends prompted manufacturers to explore eco-friendly PCB materials and practices. |
Note - Market size estimations and growth projections presented in this report are based on 6Wresearch's advanced forecasting approach, validated with industry datasets as of June 2026.
Indonesia Printed Circuit Boards Market Synopsis
The Indonesia Printed Circuit Boards Market is projected to reach USD 704.4 million and witness significant growth during the forecast period (2026-2032). This growth trajectory is underpinned by a remarkable increase in demand for consumer electronic devices, alongside a significant rise in expenditure on electronics across the archipelago.
Indonesia Printed Circuit Boards Market Growth Drivers
Key drivers fueling the expansion of the Indonesia Printed Circuit Boards Market include:
- The ongoing proliferation of consumer electronic devices, such as smartphones, laptops, and tablets, has led to an increased consumption of printed circuit boards in Indonesia. This trend is expected to continue, resulting in a larger market share for PCBs in the electronics sector.
- As disposable incomes rise, Indonesian consumers are increasingly investing in high-end electronic products that utilize advanced printed circuit board technology. This growing trend significantly contributes to the market's revenue streams.
- The increasing integration of smart technologies in everyday appliances is augmenting the demand for innovative PCB designs. More sophisticated electronic products require components that feature advanced PCBs, thereby enhancing their functionalities and operational efficiencies.
- Government initiatives aimed at promoting the electronics manufacturing sector are providing a conducive environment for PCB production. Encouraging domestic manufacturing through various policies supports the local PCB market growth.
- With the expansion of e-commerce platforms and rising digital engagement, businesses are enhancing their product portfolios, further driving the demand for printed circuit boards in the Indonesian marketplace.
Indonesia Printed Circuit Boards Market Challenges and Restraints
Despite its promising growth, the Indonesia Printed Circuit Boards Market faces several challenges:
- The high costs associated with manual labor in PCB manufacturing can lead to increased production expenses. This is particularly challenging for small-scale operators who may not have the resources to invest in automation technologies.
- Automation processes, while beneficial in reducing operational costs, pose a potential threat to smaller manufacturers who struggle to adopt these technologies, hindering their competitive edge.
- The volatility in raw material prices can impact PCB manufacturing costs. Fluctuations in the supply chain for essential components can disrupt production schedules and affect overall market stability.
- Environmental regulations concerning electronic waste management may impose additional costs on manufacturers, compelling them to adhere to sustainability practices that could affect profit margins.
- The rapid pace of technological advancements necessitates continuous innovation in PCB design and manufacturing processes. Companies failing to keep up with these innovations risk losing market share to more agile competitors.
Indonesia Printed Circuit Boards Market Government Investment and Initiatives
The Indonesian government has recognized the potential of the electronics sector, including printed circuit boards, as a critical component of the national economy. Various initiatives have been introduced to bolster the market, including:
- Investment incentives aimed at encouraging both domestic and foreign investment in electronics manufacturing, which includes PCB production. Such policies provide financial support and tax breaks to qualifying businesses.
- Public spending on technology and innovation programs targeted at improving manufacturing capabilities. These initiatives often focus on research and development to enhance the quality and efficiency of PCB production.
- Development plans that emphasize the importance of local manufacturing to reduce reliance on imports and increase the national competitiveness of the electronics sector.
- Support for workforce development programs that aim to equip the local workforce with the necessary skills to thrive in the advanced manufacturing landscape, including PCB technology.
- Collaborations with industry stakeholders to promote sustainable practices in PCB manufacturing, ensuring compliance with environmental standards while fostering growth within the sector.
Indonesia Printed Circuit Boards Market Latest Developments (May 2025 - June 2026)
Throughout the period of May 2025 to June 2026, the Indonesia Printed Circuit Boards Market has experienced notable developments that reflect its evolving landscape:
- The market has seen increased investments in automation technologies, enabling manufacturers to reduce labor costs and enhance productivity, thus addressing some of the challenges faced in the sector.
- Emerging trends indicate a stronger focus on sustainable manufacturing practices, with companies increasingly adopting eco-friendly materials and processes in PCB production.
- Partnerships between local firms and international technology providers have been established to foster innovation and improve the overall quality of PCB offerings within the market.
- The growth of the automotive electronics segment has been particularly noteworthy, with rising demand for high-performance PCBs in electric vehicles and smart automotive applications.
- Regulatory frameworks have been updated to further support the electronics sector, providing clearer guidelines that facilitate market activity and encourage compliance among PCB manufacturers.
Indonesia Printed Circuit Boards Market - Key Attractiveness of the Report
- 10 Years of Market Numbers
- Historical Data Starting from 2022 to 2025
- Base Year: 2025
- Forecast Data until 2032
- Key Performance Indicators Impacting the Market
- Major Upcoming Developments and Projects
Key Highlights of the Report:
- Indonesia Printed Circuit Boards Market Outlook
- Market Size of Indonesia Printed Circuit Boards Market, 2025
- Forecast of Indonesia Printed Circuit Boards Market, 2032F
- Historical Data and Forecast of Indonesia Printed Circuit Boards Revenues & Volume for the Period 2022-2032F
- Indonesia Printed Circuit Boards Market Trend Evolution
- Indonesia Printed Circuit Boards Market Drivers and Challenges
- Indonesia Printed Circuit Boards Price Trends
- Indonesia Printed Circuit Boards Porter's Five Forces
- Indonesia Printed Circuit Boards Industry Life Cycle
- Historical Data and Forecast of Indonesia Printed Circuit Boards Market Revenues & Volume By Types for the Period 2022-2032F
- Historical Data and Forecast of Indonesia Printed Circuit Boards Market Revenues & Volume By Single Sided for the Period 2022-2032F
- Historical Data and Forecast of Indonesia Printed Circuit Boards Market Revenues & Volume By Double Sided for the Period 2022-2032F
- Historical Data and Forecast of Indonesia Printed Circuit Boards Market Revenues & Volume By Multi-Layer for the Period 2022-2032F
- Historical Data and Forecast of Indonesia Printed Circuit Boards Market Revenues & Volume By HDI for the Period 2022-2032F
- Historical Data and Forecast of Indonesia Printed Circuit Boards Market Revenues & Volume By Substrate for the Period 2022-2032F
- Historical Data and Forecast of Indonesia Printed Circuit Boards Market Revenues & Volume By Rigid for the Period 2022-2032F
- Historical Data and Forecast of Indonesia Printed Circuit Boards Market Revenues & Volume By Flexible for the Period 2022-2032F
- Historical Data and Forecast of Indonesia Printed Circuit Boards Market Revenues & Volume By Rigid-Flex for the Period 2022-2032F
- Historical Data and Forecast of Indonesia Printed Circuit Boards Market Revenues & Volume By End-users for the Period 2022-2032F
- Historical Data and Forecast of Indonesia Printed Circuit Boards Market Revenues & Volume By Industrial Electronics for the Period 2022-2032F
- Historical Data and Forecast of Indonesia Printed Circuit Boards Market Revenues & Volume By Healthcare for the Period 2022-2032F
- Historical Data and Forecast of Indonesia Printed Circuit Boards Market Revenues & Volume By Aerospace & Defense for the Period 2022-2032F
- Historical Data and Forecast of Indonesia Printed Circuit Boards Market Revenues & Volume By Automotive for the Period 2022-2032F
- Historical Data and Forecast of Indonesia Printed Circuit Boards Market Revenues & Volume By IT & Telecom for the Period 2022-2032F
- Historical Data and Forecast of Indonesia Printed Circuit Boards Market Revenues & Volume By Consumer Electronics for the Period 2022-2032F
- Historical Data and Forecast of Indonesia Printed Circuit Boards Market Revenues & Volume By Others for the Period 2022-2032F
- Indonesia Printed Circuit Boards Import Export Trade Statistics
- Market Opportunity Assessment By Types
- Market Opportunity Assessment By Substrate
- Market Opportunity Assessment By End-users
- Indonesia Printed Circuit Boards Top Companies Market Share
- Indonesia Printed Circuit Boards Competitive Benchmarking By Technical and Operational Parameters
- Indonesia Printed Circuit Boards Company Profiles
- Indonesia Printed Circuit Boards Key Strategic Recommendations
Frequently Asked Questions About the Market Study (FAQs):
The growth is primarily driven by increasing demand for consumer electronic devices and rising expenditure on electronics, alongside government initiatives promoting local manufacturing.
Challenges include high manufacturing costs due to labor, volatile raw material prices, and the need for continuous technological innovation.
The government supports the market through investment incentives, public spending on technology, and initiatives aimed at enhancing workforce skills and manufacturing capabilities.
Recent developments include increased automation investments, a focus on sustainable practices, and partnerships aimed at fostering innovation in PCB production.
6Wresearch actively monitors the Indonesia Printed Circuit Boards Market and publishes its comprehensive annual report, highlighting emerging trends, growth drivers, revenue analysis, and forecast outlook. Our insights help businesses to make data-backed strategic decisions with ongoing market dynamics. Our analysts track relevent industries related to the Indonesia Printed Circuit Boards Market, allowing our clients with actionable intelligence and reliable forecasts tailored to emerging regional needs.
Yes, we provide customisation as per your requirements. To learn more, feel free to contact us on sales@6wresearch.com
1 Executive Summary |
2 Introduction |
2.1 Key Highlights of the Report |
2.2 Report Description |
2.3 Market Scope & Segmentation |
2.4 Research Methodology |
2.5 Assumptions |
3 Indonesia Printed Circuit Boards Market Overview |
3.1 Indonesia Country Macro Economic Indicators |
3.2 Indonesia Printed Circuit Boards Market Revenues & Volume, 2022 & 2032F |
3.3 Indonesia Printed Circuit Boards Market - Industry Life Cycle |
3.4 Indonesia Printed Circuit Boards Market - Porter's Five Forces |
3.5 Indonesia Printed Circuit Boards Market Revenues & Volume Share, By Types, 2022 & 2032F |
3.6 Indonesia Printed Circuit Boards Market Revenues & Volume Share, By Substrate, 2022 & 2032F |
3.7 Indonesia Printed Circuit Boards Market Revenues & Volume Share, By End-users, 2022 & 2032F |
4 Indonesia Printed Circuit Boards Market Dynamics |
4.1 Impact Analysis |
4.2 Market Drivers |
4.3 Market Restraints |
5 Indonesia Printed Circuit Boards Market Trends |
6 Indonesia Printed Circuit Boards Market, By Types |
6.1 Indonesia Printed Circuit Boards Market, By Types |
6.1.1 Overview and Analysis |
6.1.2 Indonesia Printed Circuit Boards Market Revenues & Volume, By Types, 2022-2032F |
6.1.3 Indonesia Printed Circuit Boards Market Revenues & Volume, By Single Sided, 2022-2032F |
6.1.4 Indonesia Printed Circuit Boards Market Revenues & Volume, By Double Sided, 2022-2032F |
6.1.5 Indonesia Printed Circuit Boards Market Revenues & Volume, By Multi-Layer, 2022-2032F |
6.1.6 Indonesia Printed Circuit Boards Market Revenues & Volume, By HDI, 2022-2032F |
6.2 Indonesia Printed Circuit Boards Market, By Substrate |
6.2.1 Overview and Analysis |
6.2.2 Indonesia Printed Circuit Boards Market Revenues & Volume, By Rigid, 2022-2032F |
6.2.3 Indonesia Printed Circuit Boards Market Revenues & Volume, By Flexible, 2022-2032F |
6.2.4 Indonesia Printed Circuit Boards Market Revenues & Volume, By Rigid-Flex, 2022-2032F |
6.3 Indonesia Printed Circuit Boards Market, By End-users |
6.3.1 Overview and Analysis |
6.3.2 Indonesia Printed Circuit Boards Market Revenues & Volume, By Industrial Electronics, 2022-2032F |
6.3.3 Indonesia Printed Circuit Boards Market Revenues & Volume, By Healthcare, 2022-2032F |
6.3.4 Indonesia Printed Circuit Boards Market Revenues & Volume, By Aerospace & Defense, 2022-2032F |
6.3.5 Indonesia Printed Circuit Boards Market Revenues & Volume, By Automotive, 2022-2032F |
6.3.6 Indonesia Printed Circuit Boards Market Revenues & Volume, By IT & Telecom, 2022-2032F |
6.3.7 Indonesia Printed Circuit Boards Market Revenues & Volume, By Consumer Electronics, 2022-2032F |
7 Indonesia Printed Circuit Boards Market Import-Export Trade Statistics |
7.1 Indonesia Printed Circuit Boards Market Export to Major Countries |
7.2 Indonesia Printed Circuit Boards Market Imports from Major Countries |
8 Indonesia Printed Circuit Boards Market Key Performance Indicators |
9 Indonesia Printed Circuit Boards Market - Opportunity Assessment |
9.1 Indonesia Printed Circuit Boards Market Opportunity Assessment, By Types, 2022 & 2032F |
9.2 Indonesia Printed Circuit Boards Market Opportunity Assessment, By Substrate, 2022 & 2032F |
9.3 Indonesia Printed Circuit Boards Market Opportunity Assessment, By End-users, 2022 & 2032F |
10 Indonesia Printed Circuit Boards Market - Competitive Landscape |
10.1 Indonesia Printed Circuit Boards Market Revenue Share, By Companies, 2025 |
10.2 Indonesia Printed Circuit Boards Market Competitive Benchmarking, By Operating and Technical Parameters |
11 Company Profiles |
12 Recommendations |
13 Disclaimer |
Global Go To Market Strategy - 2030
Export potential enables firms to identify high-growth global markets with greater confidence by combining advanced trade intelligence with a structured quantitative methodology. The framework analyzes emerging demand trends and country-level import patterns while integrating macroeconomic and trade datasets such as GDP and population forecasts, bilateral import–export flows, tariff structures, elasticity differentials between developed and developing economies, geographic distance, and import demand projections. Using weighted trade values from 2020–2024 as the base period to project country-to-country export potential for 2030, these inputs are operationalized through calculated drivers such as gravity model parameters, tariff impact factors, and projected GDP per-capita growth. Through an analysis of hidden potentials, demand hotspots, and market conditions that are most favorable to success, this method enables firms to focus on target countries, maximize returns, and global expansion with data, backed by accuracy.
By factoring in the projected importer demand gap that is currently unmet and could be potential opportunity, it identifies the potential for the Exporter (Country) among 190 countries, against the general trade analysis, which identifies the biggest importer or exporter.
To discover high-growth global markets and optimize your business strategy:
Click Here
Pricing
- Single User License$ 1,995
- Department License$ 2,400
- Site License$ 3,120
- Global License$ 3,795

Leadership Perspectives from Industry Events
Search
Thought Leadership and Analyst Meet


Our Clients
6WResearch In News
- India Air Conditioner Market Set for Strong Rebound in 2026 After Weather-Led Correction and GST-Driven Recovery: 6Wresearch
- ADAS in India: How Automatic Emergency Braking, Blind Spot Detection & Driver Monitoring are Transforming Road Safety
- Doha a strategic location for EV manufacturing hub: IPA Qatar
- Demand for luxury TVs surging in the GCC, says Samsung
- Empowering Growth: The Thriving Journey of Bangladesh’s Cable Industry
- Demand for luxury TVs surging in the GCC, says Samsung
Latest Reports
- Nicaragua RPG Gaming Market (2026-2032)
- New Zealand RPG Gaming Market (2026-2032)
- Netherlands RPG Gaming Market (2026-2032)
- Nauru RPG Gaming Market (2026-2032)
- Namibia RPG Gaming Market (2026-2032)
- Mozambique RPG Gaming Market (2026-2032)
- Montenegro RPG Gaming Market (2026-2032)
- Mongolia RPG Gaming Market (2026-2032)
- Monaco RPG Gaming Market (2026-2032)
- Micronesia RPG Gaming Market (2026-2032)
Industry Events and Analyst Meet

HIMTEX 2026

India Refining Summit 2026

India EV Show 2026

EV tech India Expo 2026

Auto Tech Asia 2026
Whitepaper
- Middle East & Africa Commercial Security Market Click here to view more.
- Middle East & Africa Fire Safety Systems & Equipment Market Click here to view more.
- GCC Drone Market Click here to view more.
- Middle East Lighting Fixture Market Click here to view more.
- GCC Physical & Perimeter Security Market Click here to view more.