Indonesia PVB Interlayers Market (2026-2032) Outlook | Size, Companies, Revenue, Share, Value, Analysis, Growth, Forecast, Industry, Trends
Market Forecast By End-use (Automotive, Construction, Photovoltaic), By Type (Standard, Structural) And Competitive Landscape
| Product Code: ETC4507349 | Publication Date: Jul 2023 | Updated Date: Mar 2026 | Product Type: Report | |
| Publisher: 6Wresearch | Author: Ravi Bhandari | No. of Pages: 85 | No. of Figures: 45 | No. of Tables: 25 |
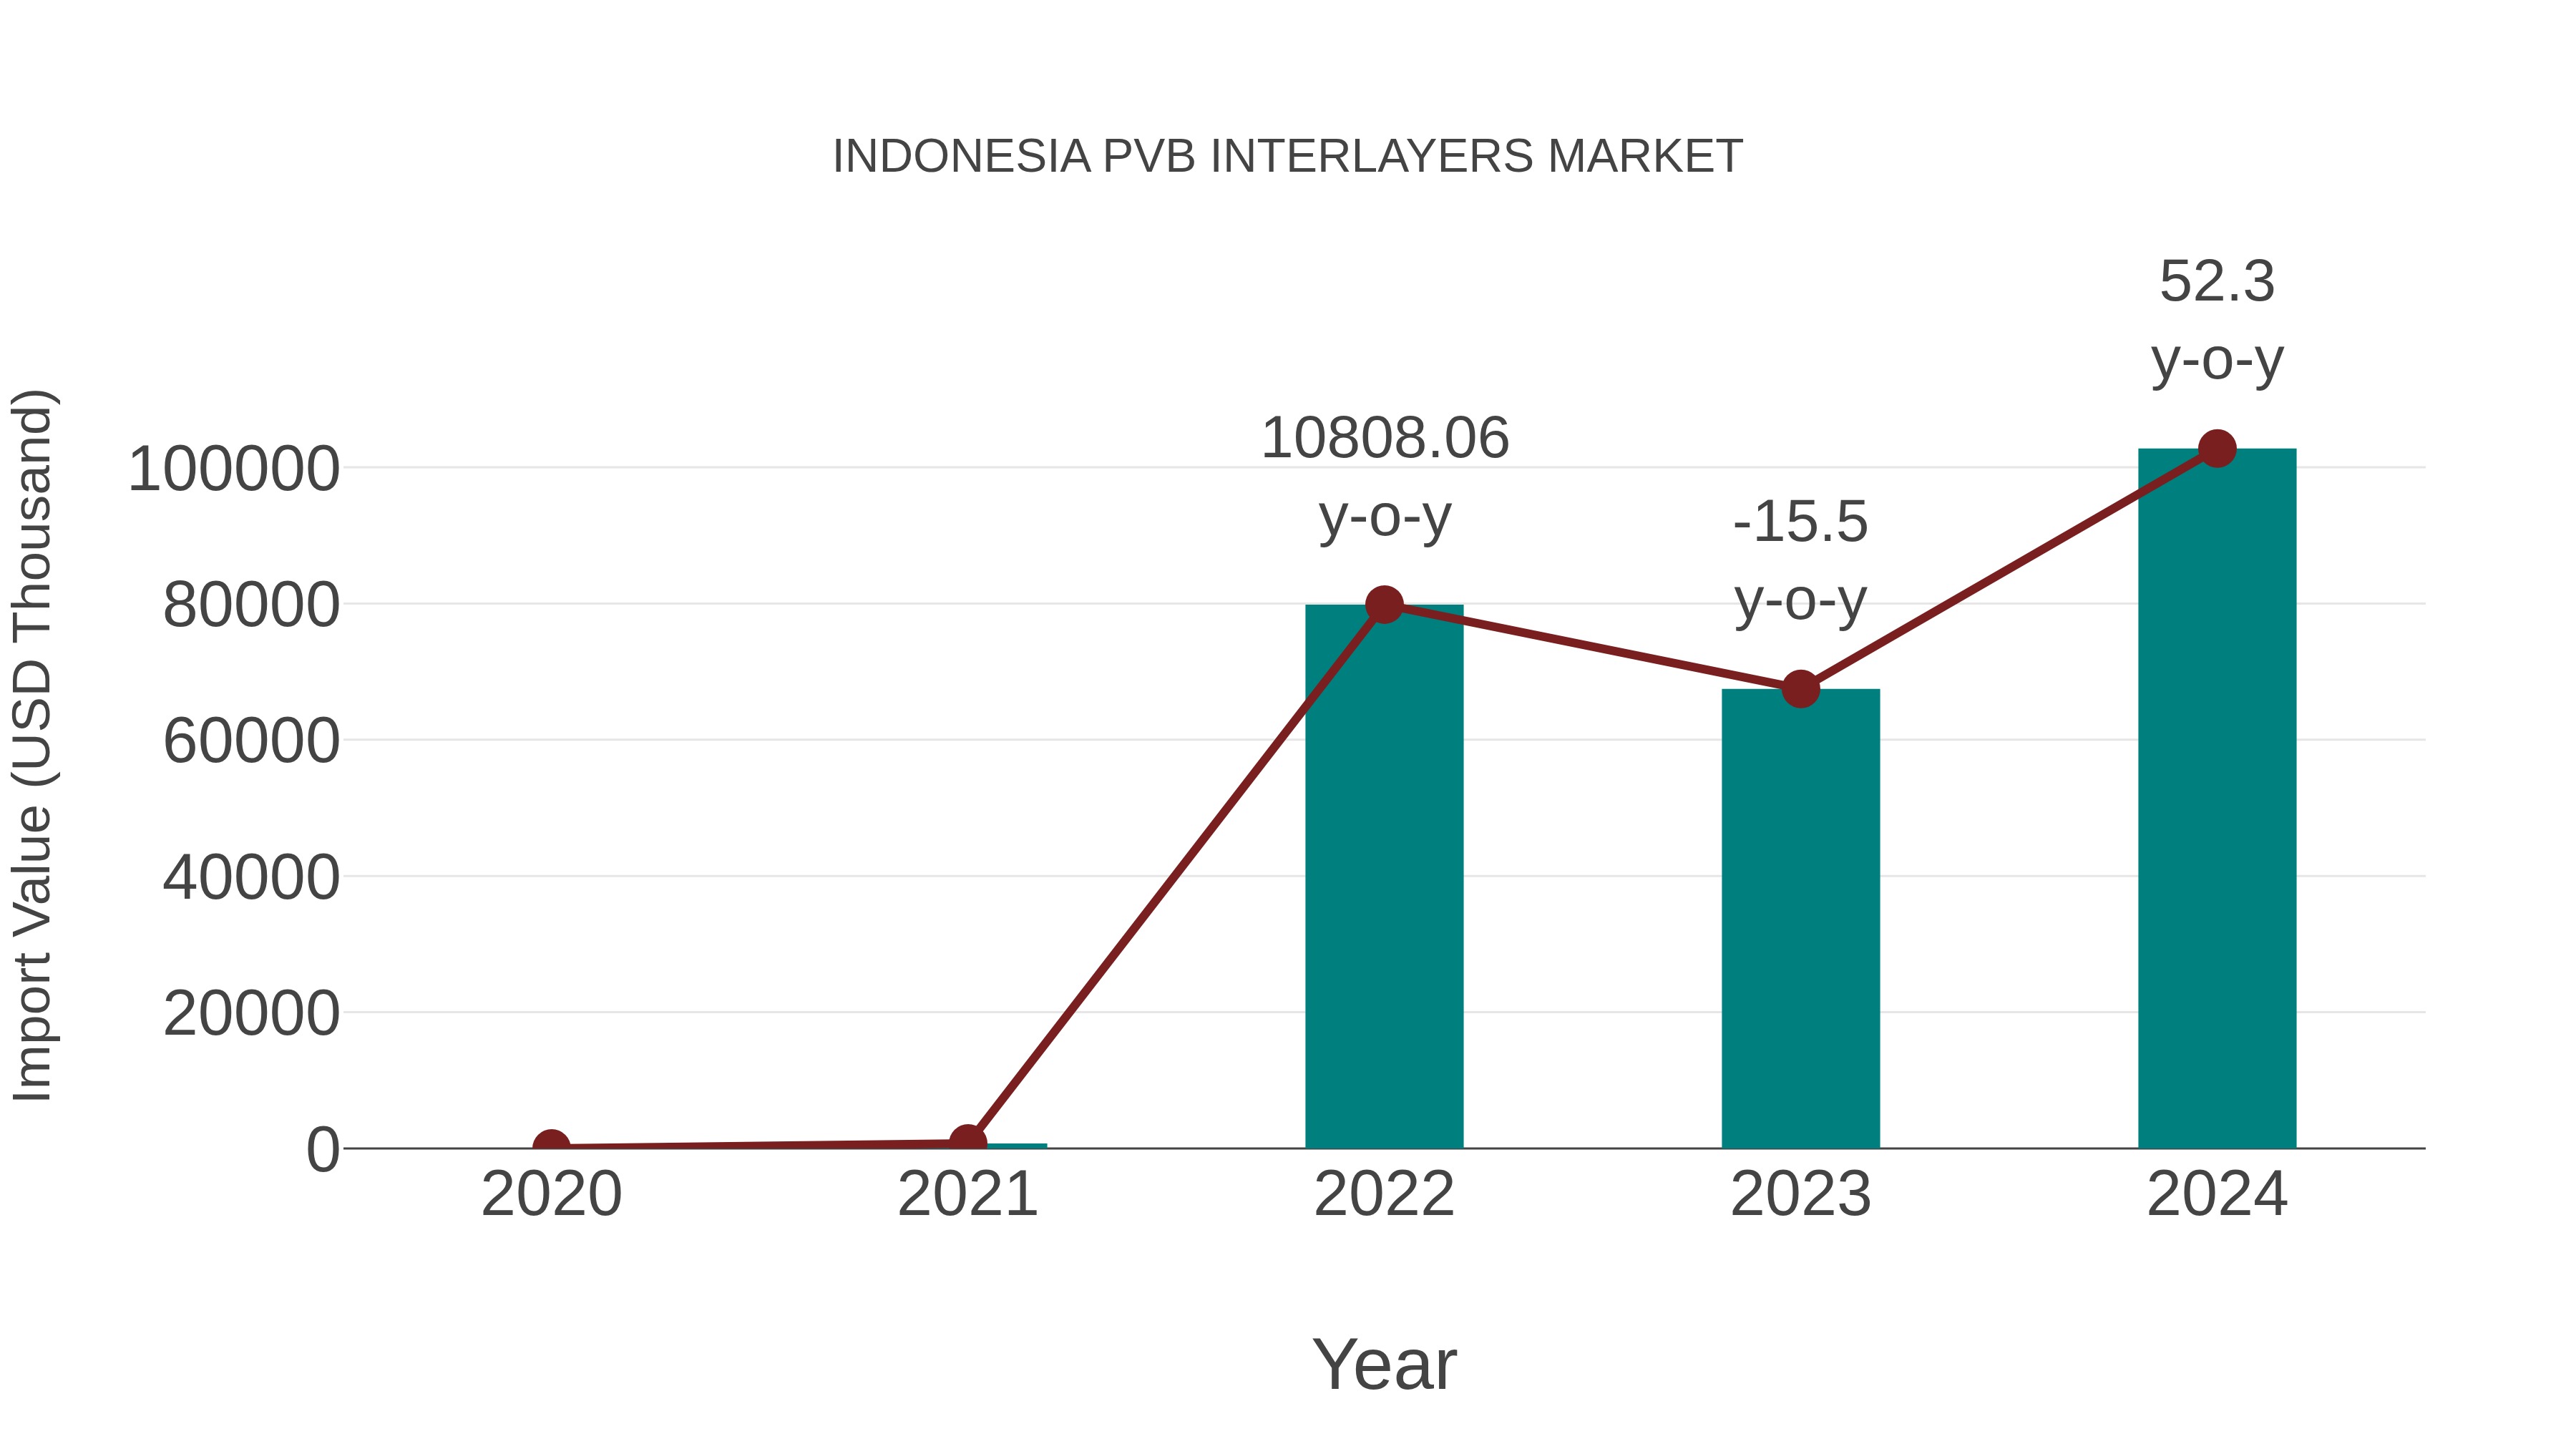
Indonesia Pvb Interlayers Market: Import Trend Analysis
Indonesia`s import trend for PVB interlayers in the market saw significant growth from 2023 to 2024, with a notable 52.3% increase. The compound annual growth rate (CAGR) for imports between 2020 and 2024 stood at an impressive 419.73%. This surge can be attributed to a surge in demand for high-quality interlayers in the Indonesian market, likely driven by advancements in the construction and automotive industries during this period.
Indonesia Pvb Interlayers Market Overview
The polyvinyl butyral (PVB) interlayers market in Indonesia is on an upward trajectory, primarily due to the material`s crucial role in laminated glass applications. PVB interlayers enhance the safety and structural integrity of glass, making them essential in industries like automotive, architecture, and aerospace. The market growth is driven by factors such as the rising awareness of safety standards and building codes, leading to increased adoption of laminated glass. Moreover, advancements in PVB interlayer technology, including UV resistance and sound insulation properties, are expected to further drive market expansion.
Drivers of the Market
PVB interlayers are primarily used in the production of laminated safety glass, which is integral in the construction and automotive industries. The increasing emphasis on safety and security in buildings and automobiles is driving the demand for PVB interlayers. In construction, it is used for shatterproof windows and facades, while in automobiles, it enhances windshield integrity. Moreover, the government`s efforts to improve road safety and building standards are propelling the market further. Additionally, the automotive industry`s growth and the construction of new buildings and infrastructure projects are key drivers for PVB interlayers.
Challenges of the Market
One of the key challenges in the PVB interlayers market is ensuring adhesion and optical clarity. Interlayers must bond effectively with glass while maintaining transparency. Achieving this balance requires advanced material engineering and precise manufacturing techniques.
COVID-19 Impacts on the Market
The PVB interlayers market in Indonesia faced disruptions as the construction and automotive sectors, which are key consumers of PVB interlayers for safety glass, were affected by the pandemic. Reduced construction activity and automobile manufacturing led to decreased demand. Nevertheless, as these sectors regain momentum, the market is poised for recovery.
Key Players of the Makret
The PVB interlayers market in Indonesia has gained traction, especially in the construction and automotive sectors. Major players in this market include PT Asahimas Flat Glass Tbk, PT. Solar Shield Indonesia, and PT. Charoennakorn Indonesia.
Key Highlights of the Report:
- Indonesia PVB Interlayers Market Outlook
- Market Size of Indonesia PVB Interlayers Market, 2025
- Forecast of Indonesia PVB Interlayers Market, 2032
- Historical Data and Forecast of Indonesia PVB Interlayers Revenues & Volume for the Period 2022-2032F
- Indonesia PVB Interlayers Market Trend Evolution
- Indonesia PVB Interlayers Market Drivers and Challenges
- Indonesia PVB Interlayers Price Trends
- Indonesia PVB Interlayers Porter's Five Forces
- Indonesia PVB Interlayers Industry Life Cycle
- Historical Data and Forecast of Indonesia PVB Interlayers Market Revenues & Volume By End-use for the Period 2022-2032F
- Historical Data and Forecast of Indonesia PVB Interlayers Market Revenues & Volume By Automotive for the Period 2022-2032F
- Historical Data and Forecast of Indonesia PVB Interlayers Market Revenues & Volume By Construction for the Period 2022-2032F
- Historical Data and Forecast of Indonesia PVB Interlayers Market Revenues & Volume By Photovoltaic for the Period 2022-2032F
- Historical Data and Forecast of Indonesia PVB Interlayers Market Revenues & Volume By Type for the Period 2022-2032F
- Historical Data and Forecast of Indonesia PVB Interlayers Market Revenues & Volume By Standard for the Period 2022-2032F
- Historical Data and Forecast of Indonesia PVB Interlayers Market Revenues & Volume By Structural for the Period 2022-2032F
- Indonesia PVB Interlayers Import Export Trade Statistics
- Market Opportunity Assessment By End-use
- Market Opportunity Assessment By Type
- Indonesia PVB Interlayers Top Companies Market Share
- Indonesia PVB Interlayers Competitive Benchmarking By Technical and Operational Parameters
- Indonesia PVB Interlayers Company Profiles
- Indonesia PVB Interlayers Key Strategic Recommendations
Indonesia PVB Interlayers Market (2026-2032): FAQs
6Wresearch actively monitors the Indonesia PVB Interlayers Market and publishes its comprehensive annual report, highlighting emerging trends, growth drivers, revenue analysis, and forecast outlook. Our insights help businesses to make data-backed strategic decisions with ongoing market dynamics. Our analysts track relevent industries related to the Indonesia PVB Interlayers Market, allowing our clients with actionable intelligence and reliable forecasts tailored to emerging regional needs.
Yes, we provide customisation as per your requirements. To learn more, feel free to contact us on sales@6wresearch.com
1 Executive Summary |
2 Introduction |
2.1 Key Highlights of the Report |
2.2 Report Description |
2.3 Market Scope & Segmentation |
2.4 Research Methodology |
2.5 Assumptions |
3 Indonesia PVB Interlayers Market Overview |
3.1 Indonesia Country Macro Economic Indicators |
3.2 Indonesia PVB Interlayers Market Revenues & Volume, 2022 & 2032F |
3.3 Indonesia PVB Interlayers Market - Industry Life Cycle |
3.4 Indonesia PVB Interlayers Market - Porter's Five Forces |
3.5 Indonesia PVB Interlayers Market Revenues & Volume Share, By End-use, 2022 & 2032F |
3.6 Indonesia PVB Interlayers Market Revenues & Volume Share, By Type, 2022 & 2032F |
4 Indonesia PVB Interlayers Market Dynamics |
4.1 Impact Analysis |
4.2 Market Drivers |
4.2.1 Increasing demand for safety and security in the construction industry |
4.2.2 Growing awareness about the benefits of using PVB interlayers in architectural applications |
4.2.3 Government regulations promoting the use of safety glass in buildings |
4.3 Market Restraints |
4.3.1 Fluctuating prices of raw materials used in PVB interlayers production |
4.3.2 Competition from alternative materials such as SGP (SentryGlas Plus) |
4.3.3 Limited availability of skilled labor for the production and installation of PVB interlayers |
5 Indonesia PVB Interlayers Market Trends |
6 Indonesia PVB Interlayers Market, By Types |
6.1 Indonesia PVB Interlayers Market, By End-use |
6.1.1 Overview and Analysis |
6.1.2 Indonesia PVB Interlayers Market Revenues & Volume, By End-use, 2022-2032F |
6.1.3 Indonesia PVB Interlayers Market Revenues & Volume, By Automotive, 2022-2032F |
6.1.4 Indonesia PVB Interlayers Market Revenues & Volume, By Construction, 2022-2032F |
6.1.5 Indonesia PVB Interlayers Market Revenues & Volume, By Photovoltaic, 2022-2032F |
6.2 Indonesia PVB Interlayers Market, By Type |
6.2.1 Overview and Analysis |
6.2.2 Indonesia PVB Interlayers Market Revenues & Volume, By Standard, 2022-2032F |
6.2.3 Indonesia PVB Interlayers Market Revenues & Volume, By Structural, 2022-2032F |
7 Indonesia PVB Interlayers Market Import-Export Trade Statistics |
7.1 Indonesia PVB Interlayers Market Export to Major Countries |
7.2 Indonesia PVB Interlayers Market Imports from Major Countries |
8 Indonesia PVB Interlayers Market Key Performance Indicators |
8.1 Number of building permits issued for projects requiring safety glass |
8.2 Adoption rate of PVB interlayers in high-rise buildings |
8.3 Number of training programs conducted for glass industry professionals on PVB interlayers applications |
9 Indonesia PVB Interlayers Market - Opportunity Assessment |
9.1 Indonesia PVB Interlayers Market Opportunity Assessment, By End-use, 2022 & 2032F |
9.2 Indonesia PVB Interlayers Market Opportunity Assessment, By Type, 2022 & 2032F |
10 Indonesia PVB Interlayers Market - Competitive Landscape |
10.1 Indonesia PVB Interlayers Market Revenue Share, By Companies, 2025 |
10.2 Indonesia PVB Interlayers Market Competitive Benchmarking, By Operating and Technical Parameters |
11 Company Profiles |
12 Recommendations |
13 Disclaimer |
Global Go To Market Strategy - 2030
Export potential enables firms to identify high-growth global markets with greater confidence by combining advanced trade intelligence with a structured quantitative methodology. The framework analyzes emerging demand trends and country-level import patterns while integrating macroeconomic and trade datasets such as GDP and population forecasts, bilateral import–export flows, tariff structures, elasticity differentials between developed and developing economies, geographic distance, and import demand projections. Using weighted trade values from 2020–2024 as the base period to project country-to-country export potential for 2030, these inputs are operationalized through calculated drivers such as gravity model parameters, tariff impact factors, and projected GDP per-capita growth. Through an analysis of hidden potentials, demand hotspots, and market conditions that are most favorable to success, this method enables firms to focus on target countries, maximize returns, and global expansion with data, backed by accuracy.
By factoring in the projected importer demand gap that is currently unmet and could be potential opportunity, it identifies the potential for the Exporter (Country) among 190 countries, against the general trade analysis, which identifies the biggest importer or exporter.
To discover high-growth global markets and optimize your business strategy:
Click Here
Pricing
- Single User License$ 1,995
- Department License$ 2,400
- Site License$ 3,120
- Global License$ 3,795

Leadership Perspectives from Industry Events
Search
Thought Leadership and Analyst Meet


Our Clients
6WResearch In News
- India Export Attractiveness Tracker 2026
- India Air Conditioner Market Set for Strong Rebound in 2026 After Weather-Led Correction and GST-Driven Recovery: 6Wresearch
- ADAS in India: How Automatic Emergency Braking, Blind Spot Detection & Driver Monitoring are Transforming Road Safety
- Doha a strategic location for EV manufacturing hub: IPA Qatar
- Demand for luxury TVs surging in the GCC, says Samsung
- Empowering Growth: The Thriving Journey of Bangladesh’s Cable Industry
Latest Reports
- Nicaragua RPG Gaming Market (2026-2032)
- New Zealand RPG Gaming Market (2026-2032)
- Netherlands RPG Gaming Market (2026-2032)
- Nauru RPG Gaming Market (2026-2032)
- Namibia RPG Gaming Market (2026-2032)
- Mozambique RPG Gaming Market (2026-2032)
- Montenegro RPG Gaming Market (2026-2032)
- Mongolia RPG Gaming Market (2026-2032)
- Monaco RPG Gaming Market (2026-2032)
- Micronesia RPG Gaming Market (2026-2032)
Industry Events and Analyst Meet

EV India Expo 2026

HIMTEX 2026

India Refining Summit 2026

India EV Show 2026

EV tech India Expo 2026
Whitepaper
- Middle East & Africa Commercial Security Market Click here to view more.
- Middle East & Africa Fire Safety Systems & Equipment Market Click here to view more.
- GCC Drone Market Click here to view more.
- Middle East Lighting Fixture Market Click here to view more.
- GCC Physical & Perimeter Security Market Click here to view more.