Indonesia Ride on Bikes Market (2026-2032) | Segmentation, Size, Restraints, Competitive, Forecast, Revenue, Strategic Insights, Opportunities, Segments, Trends, Competition, Growth, Share, Industry, Pricing Analysis, Outlook, Investment Trends, Drivers, Demand, Value, Challenges, Companies, Analysis, Consumer Insights, Supply, Strategy
Market Forecast By Type (Electric Ride-On Bikes, Pedal Ride-On Bikes, Gas-Powered Ride-On Bikes, Foldable Ride-On Bikes), By Age Group (Kids (3-7 years), Teens (8-14 years), Adults (15+), All Ages), By Power Source (Battery-Powered, Manual, Gasoline-Powered, Hybrid), By Application (Recreational, Sports & Fitness, Adventure & Off-Roading, Commuting) And Competitive Landscape
| Product Code: ETC10448719 | Publication Date: Apr 2025 | Updated Date: Feb 2026 | Product Type: Market Research Report | |
| Publisher: 6Wresearch | Author: Bhawna Singh | No. of Pages: 65 | No. of Figures: 34 | No. of Tables: 19 |
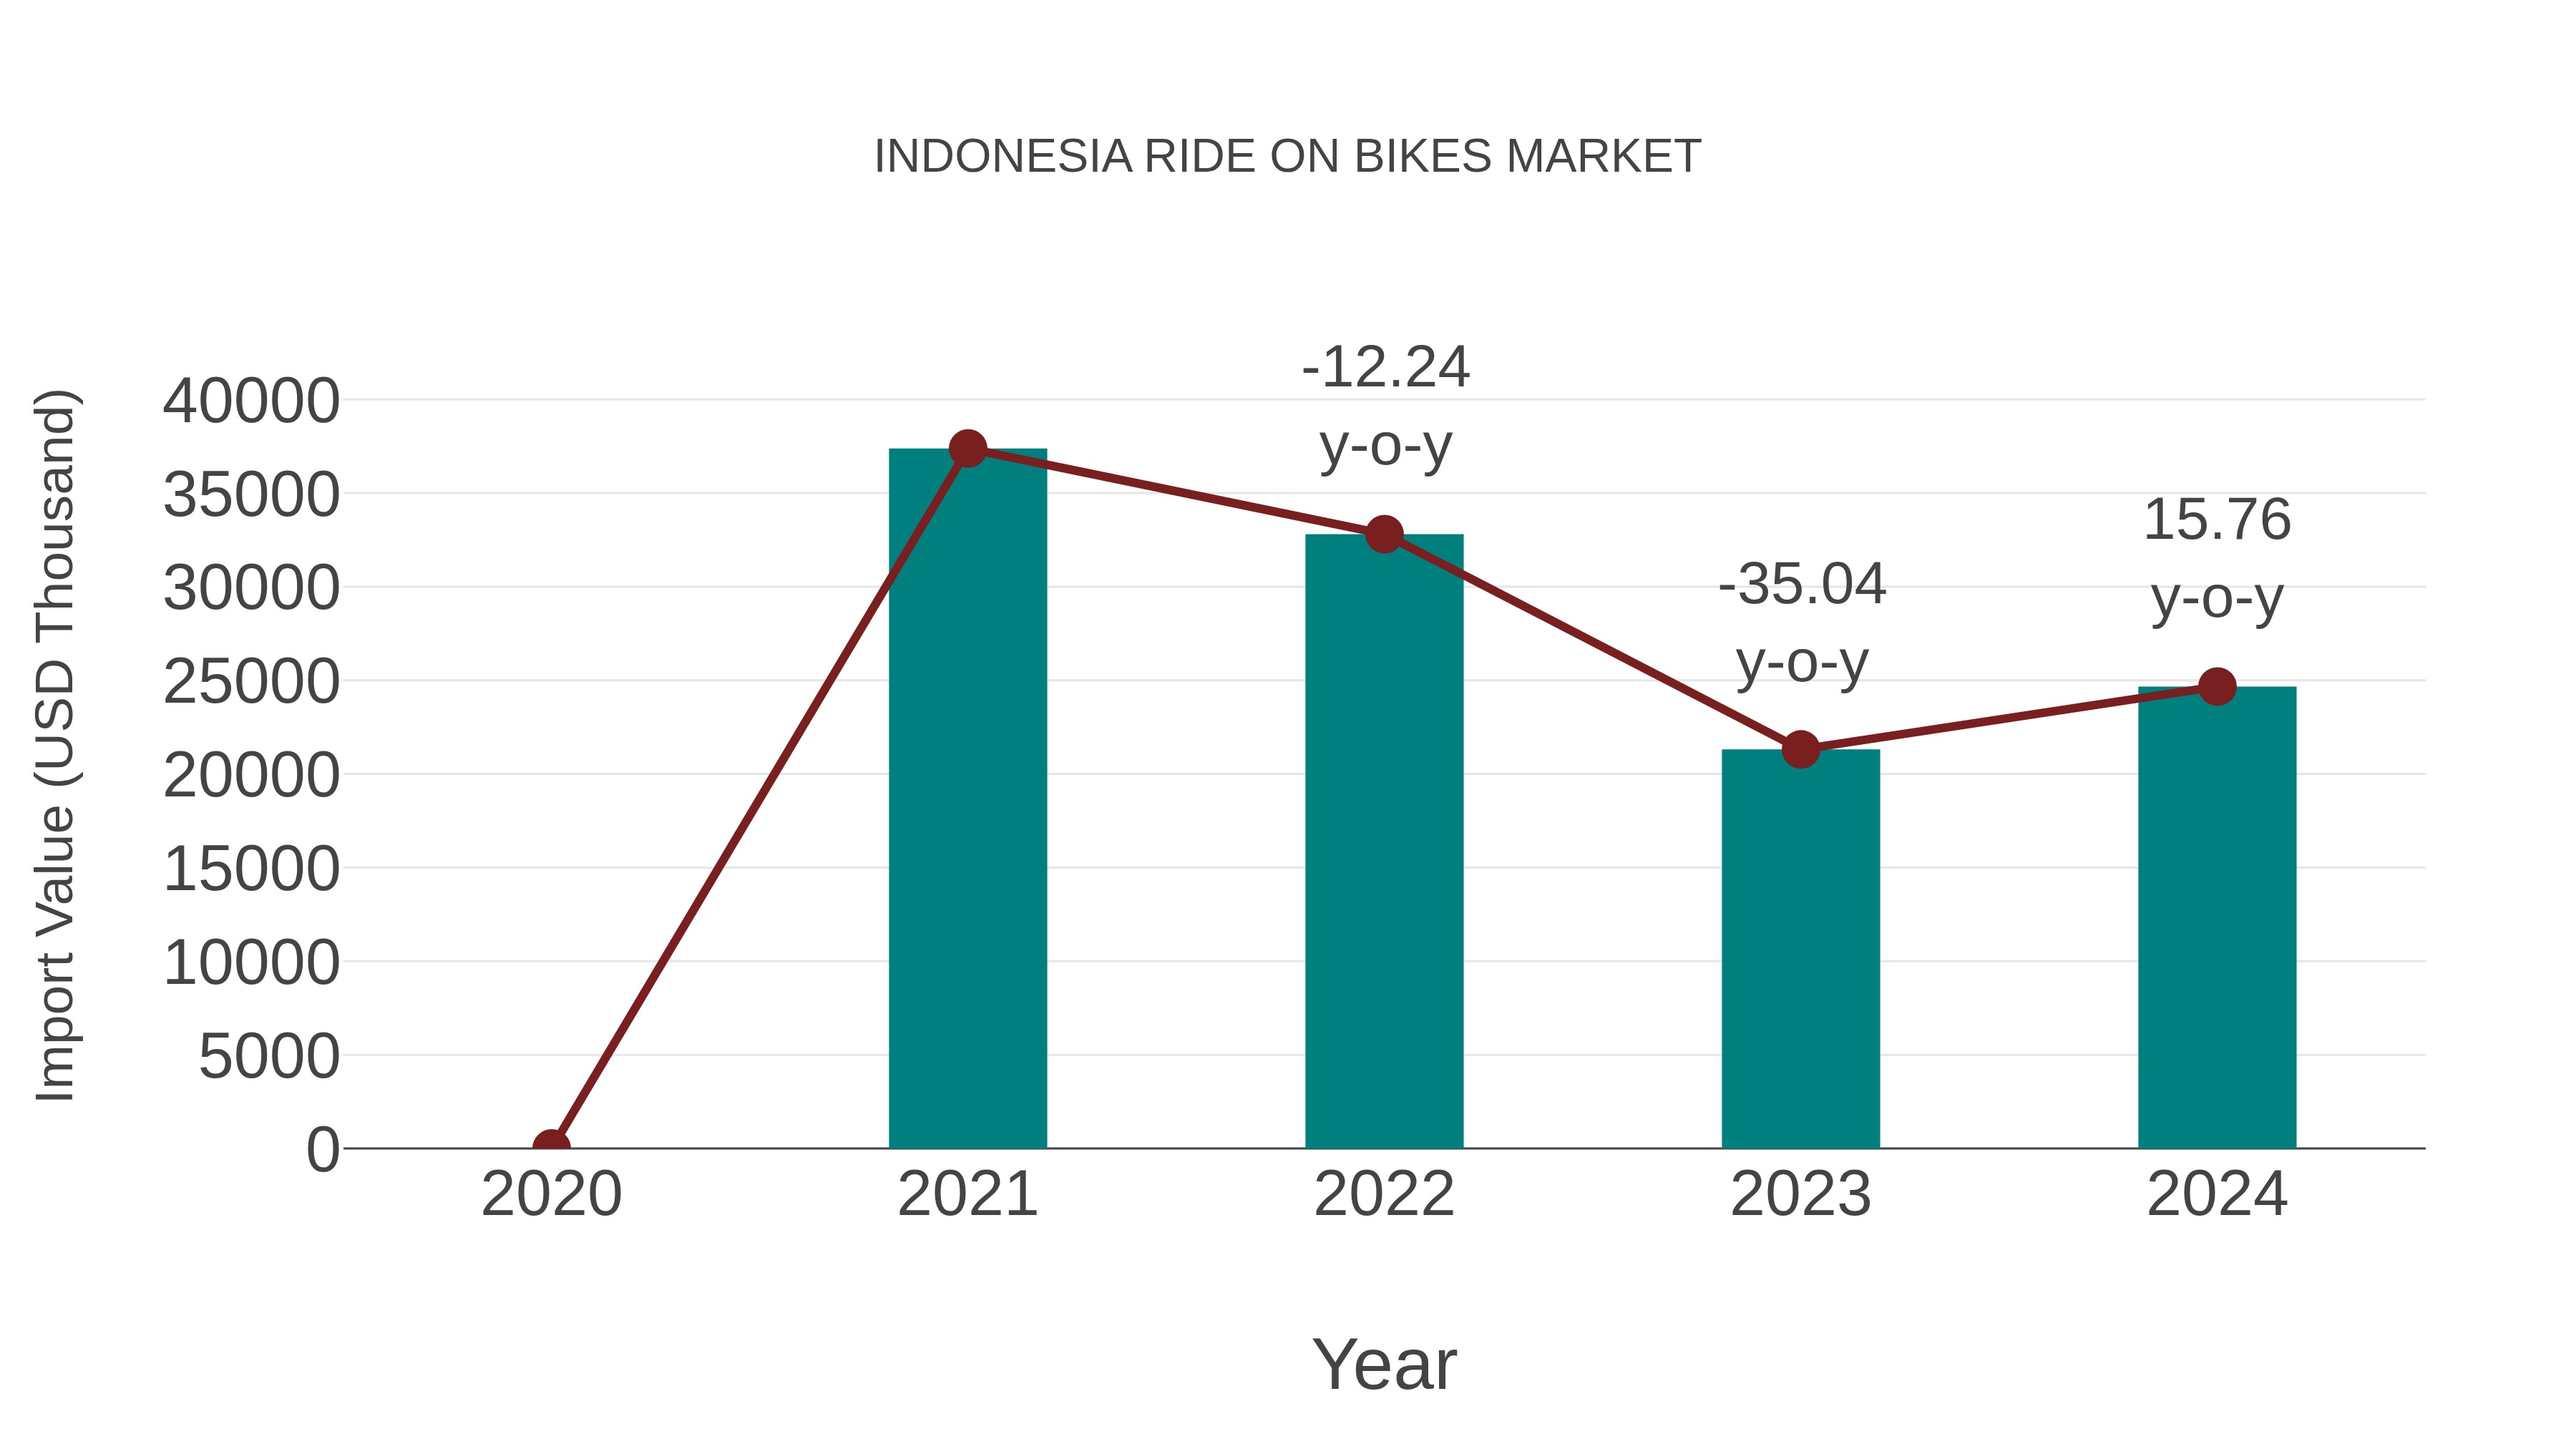
Indonesia Ride on Bikes Market: Import Trend Analysis
In the Indonesia ride-on bikes market, the import trend exhibited a growth rate of 15.76% from 2023 to 2024, while the compound annual growth rate (CAGR) for 2020-2024 stood at -12.94%. The notable upturn in import momentum from 2023 to 2024 may be attributed to the recovering market demand post-pandemic restrictions, indicating a positive shift in consumer interest and potential market stability.
Key Highlights of the Report:
- Indonesia Ride on Bikes Market Outlook
- Market Size of Indonesia Ride on Bikes Market, 2025
- Forecast of Indonesia Ride on Bikes Market, 2032
- Historical Data and Forecast of Indonesia Ride on Bikes Revenues & Volume for the Period 2022-2032F
- Indonesia Ride on Bikes Market Trend Evolution
- Indonesia Ride on Bikes Market Drivers and Challenges
- Indonesia Ride on Bikes Price Trends
- Indonesia Ride on Bikes Porter's Five Forces
- Indonesia Ride on Bikes Industry Life Cycle
- Historical Data and Forecast of Indonesia Ride on Bikes Market Revenues & Volume By Type for the Period 2022-2032F
- Historical Data and Forecast of Indonesia Ride on Bikes Market Revenues & Volume By Electric Ride-On Bikes for the Period 2022-2032F
- Historical Data and Forecast of Indonesia Ride on Bikes Market Revenues & Volume By Pedal Ride-On Bikes for the Period 2022-2032F
- Historical Data and Forecast of Indonesia Ride on Bikes Market Revenues & Volume By Gas-Powered Ride-On Bikes for the Period 2022-2032F
- Historical Data and Forecast of Indonesia Ride on Bikes Market Revenues & Volume By Foldable Ride-On Bikes for the Period 2022-2032F
- Historical Data and Forecast of Indonesia Ride on Bikes Market Revenues & Volume By Age Group for the Period 2022-2032F
- Historical Data and Forecast of Indonesia Ride on Bikes Market Revenues & Volume By Kids (3-7 years) for the Period 2022-2032F
- Historical Data and Forecast of Indonesia Ride on Bikes Market Revenues & Volume By Teens (8-14 years) for the Period 2022-2032F
- Historical Data and Forecast of Indonesia Ride on Bikes Market Revenues & Volume By Adults (15+) for the Period 2022-2032F
- Historical Data and Forecast of Indonesia Ride on Bikes Market Revenues & Volume By All Ages for the Period 2022-2032F
- Historical Data and Forecast of Indonesia Ride on Bikes Market Revenues & Volume By Power Source for the Period 2022-2032F
- Historical Data and Forecast of Indonesia Ride on Bikes Market Revenues & Volume By Battery-Powered for the Period 2022-2032F
- Historical Data and Forecast of Indonesia Ride on Bikes Market Revenues & Volume By Manual for the Period 2022-2032F
- Historical Data and Forecast of Indonesia Ride on Bikes Market Revenues & Volume By Gasoline-Powered for the Period 2022-2032F
- Historical Data and Forecast of Indonesia Ride on Bikes Market Revenues & Volume By Hybrid for the Period 2022-2032F
- Historical Data and Forecast of Indonesia Ride on Bikes Market Revenues & Volume By Application for the Period 2022-2032F
- Historical Data and Forecast of Indonesia Ride on Bikes Market Revenues & Volume By Recreational for the Period 2022-2032F
- Historical Data and Forecast of Indonesia Ride on Bikes Market Revenues & Volume By Sports & Fitness for the Period 2022-2032F
- Historical Data and Forecast of Indonesia Ride on Bikes Market Revenues & Volume By Adventure & Off-Roading for the Period 2022-2032F
- Historical Data and Forecast of Indonesia Ride on Bikes Market Revenues & Volume By Commuting for the Period 2022-2032F
- Indonesia Ride on Bikes Import Export Trade Statistics
- Market Opportunity Assessment By Type
- Market Opportunity Assessment By Age Group
- Market Opportunity Assessment By Power Source
- Market Opportunity Assessment By Application
- Indonesia Ride on Bikes Top Companies Market Share
- Indonesia Ride on Bikes Competitive Benchmarking By Technical and Operational Parameters
- Indonesia Ride on Bikes Company Profiles
- Indonesia Ride on Bikes Key Strategic Recommendations
Frequently Asked Questions About the Market Study (FAQs):
6Wresearch actively monitors the Indonesia Ride on Bikes Market and publishes its comprehensive annual report, highlighting emerging trends, growth drivers, revenue analysis, and forecast outlook. Our insights help businesses to make data-backed strategic decisions with ongoing market dynamics. Our analysts track relevent industries related to the Indonesia Ride on Bikes Market, allowing our clients with actionable intelligence and reliable forecasts tailored to emerging regional needs.
Yes, we provide customisation as per your requirements. To learn more, feel free to contact us on sales@6wresearch.com
1 Executive Summary |
2 Introduction |
2.1 Key Highlights of the Report |
2.2 Report Description |
2.3 Market Scope & Segmentation |
2.4 Research Methodology |
2.5 Assumptions |
3 Indonesia Ride on Bikes Market Overview |
3.1 Indonesia Country Macro Economic Indicators |
3.2 Indonesia Ride on Bikes Market Revenues & Volume, 2022 & 2032F |
3.3 Indonesia Ride on Bikes Market - Industry Life Cycle |
3.4 Indonesia Ride on Bikes Market - Porter's Five Forces |
3.5 Indonesia Ride on Bikes Market Revenues & Volume Share, By Type, 2022 & 2032F |
3.6 Indonesia Ride on Bikes Market Revenues & Volume Share, By Age Group, 2022 & 2032F |
3.7 Indonesia Ride on Bikes Market Revenues & Volume Share, By Power Source, 2022 & 2032F |
3.8 Indonesia Ride on Bikes Market Revenues & Volume Share, By Application, 2022 & 2032F |
4 Indonesia Ride on Bikes Market Dynamics |
4.1 Impact Analysis |
4.2 Market Drivers |
4.2.1 Increasing urbanization and congestion in major cities driving the demand for ride-on bikes as a convenient mode of transportation. |
4.2.2 Growing awareness and adoption of eco-friendly transportation options leading to a shift towards ride-on bikes. |
4.2.3 Government initiatives promoting sustainable transport solutions, including incentives for ride-on bike usage. |
4.3 Market Restraints |
4.3.1 Lack of proper infrastructure such as dedicated bike lanes and parking facilities hindering the growth of the ride-on bike market. |
4.3.2 Safety concerns among consumers regarding traffic accidents and road conditions impacting the adoption of ride-on bikes. |
4.3.3 Limited availability of affordable and quality ride-on bikes restricting market penetration. |
5 Indonesia Ride on Bikes Market Trends |
6 Indonesia Ride on Bikes Market, By Types |
6.1 Indonesia Ride on Bikes Market, By Type |
6.1.1 Overview and Analysis |
6.1.2 Indonesia Ride on Bikes Market Revenues & Volume, By Type, 2022 - 2032F |
6.1.3 Indonesia Ride on Bikes Market Revenues & Volume, By Electric Ride-On Bikes, 2022 - 2032F |
6.1.4 Indonesia Ride on Bikes Market Revenues & Volume, By Pedal Ride-On Bikes, 2022 - 2032F |
6.1.5 Indonesia Ride on Bikes Market Revenues & Volume, By Gas-Powered Ride-On Bikes, 2022 - 2032F |
6.1.6 Indonesia Ride on Bikes Market Revenues & Volume, By Foldable Ride-On Bikes, 2022 - 2032F |
6.2 Indonesia Ride on Bikes Market, By Age Group |
6.2.1 Overview and Analysis |
6.2.2 Indonesia Ride on Bikes Market Revenues & Volume, By Kids (3-7 years), 2022 - 2032F |
6.2.3 Indonesia Ride on Bikes Market Revenues & Volume, By Teens (8-14 years), 2022 - 2032F |
6.2.4 Indonesia Ride on Bikes Market Revenues & Volume, By Adults (15+), 2022 - 2032F |
6.2.5 Indonesia Ride on Bikes Market Revenues & Volume, By All Ages, 2022 - 2032F |
6.3 Indonesia Ride on Bikes Market, By Power Source |
6.3.1 Overview and Analysis |
6.3.2 Indonesia Ride on Bikes Market Revenues & Volume, By Battery-Powered, 2022 - 2032F |
6.3.3 Indonesia Ride on Bikes Market Revenues & Volume, By Manual, 2022 - 2032F |
6.3.4 Indonesia Ride on Bikes Market Revenues & Volume, By Gasoline-Powered, 2022 - 2032F |
6.3.5 Indonesia Ride on Bikes Market Revenues & Volume, By Hybrid, 2022 - 2032F |
6.4 Indonesia Ride on Bikes Market, By Application |
6.4.1 Overview and Analysis |
6.4.2 Indonesia Ride on Bikes Market Revenues & Volume, By Recreational, 2022 - 2032F |
6.4.3 Indonesia Ride on Bikes Market Revenues & Volume, By Sports & Fitness, 2022 - 2032F |
6.4.4 Indonesia Ride on Bikes Market Revenues & Volume, By Adventure & Off-Roading, 2022 - 2032F |
6.4.5 Indonesia Ride on Bikes Market Revenues & Volume, By Commuting, 2022 - 2032F |
7 Indonesia Ride on Bikes Market Import-Export Trade Statistics |
7.1 Indonesia Ride on Bikes Market Export to Major Countries |
7.2 Indonesia Ride on Bikes Market Imports from Major Countries |
8 Indonesia Ride on Bikes Market Key Performance Indicators |
8.1 Average daily usage per ride-on bike to measure the level of adoption and utilization. |
8.2 Percentage of increase in bike lane infrastructure to assess the growth potential of the market. |
8.3 Customer satisfaction scores related to ride-on bike services to gauge the overall experience and potential for market expansion. |
9 Indonesia Ride on Bikes Market - Opportunity Assessment |
9.1 Indonesia Ride on Bikes Market Opportunity Assessment, By Type, 2022 & 2032F |
9.2 Indonesia Ride on Bikes Market Opportunity Assessment, By Age Group, 2022 & 2032F |
9.3 Indonesia Ride on Bikes Market Opportunity Assessment, By Power Source, 2022 & 2032F |
9.4 Indonesia Ride on Bikes Market Opportunity Assessment, By Application, 2022 & 2032F |
10 Indonesia Ride on Bikes Market - Competitive Landscape |
10.1 Indonesia Ride on Bikes Market Revenue Share, By Companies, 2025 |
10.2 Indonesia Ride on Bikes Market Competitive Benchmarking, By Operating and Technical Parameters |
11 Company Profiles |
12 Recommendations |
13 Disclaimer |
Export potential assessment - trade Analytics for 2030
Export potential enables firms to identify high-growth global markets with greater confidence by combining advanced trade intelligence with a structured quantitative methodology. The framework analyzes emerging demand trends and country-level import patterns while integrating macroeconomic and trade datasets such as GDP and population forecasts, bilateral import–export flows, tariff structures, elasticity differentials between developed and developing economies, geographic distance, and import demand projections. Using weighted trade values from 2020–2024 as the base period to project country-to-country export potential for 2030, these inputs are operationalized through calculated drivers such as gravity model parameters, tariff impact factors, and projected GDP per-capita growth. Through an analysis of hidden potentials, demand hotspots, and market conditions that are most favorable to success, this method enables firms to focus on target countries, maximize returns, and global expansion with data, backed by accuracy.
By factoring in the projected importer demand gap that is currently unmet and could be potential opportunity, it identifies the potential for the Exporter (Country) among 190 countries, against the general trade analysis, which identifies the biggest importer or exporter.
To discover high-growth global markets and optimize your business strategy:
Click Here
Pricing
- Single User License$ 1,995
- Department License$ 2,400
- Site License$ 3,120
- Global License$ 3,795

Search
Thought Leadership and Analyst Meet


Our Clients
Latest Reports
- France Thermally Conductive Filler Dispersants Market (2026-2032) | Challenges, Restraints, Value, Share, Size, segmentation, Analysis, Trends, Investment Opportunities, Outlook, Pricing, Demand, Forecast, Revenue, Companies, Growth, Drivers, Strategy, Insights, Competition
- Egypt Thermally Conductive Filler Dispersants Market (2026-2032) | Competition, Forecast, Strategy, Value, Insights, Outlook, Investment Opportunities, Pricing, Demand, Share, segmentation, Drivers, Size, Companies, Restraints, Growth, Trends, Revenue, Challenges, Analysis
- Czech Republic Thermally Conductive Filler Dispersants Market (2026-2032) | Forecast, Pricing, Analysis, Drivers, Insights, Size, Demand, Growth, Challenges, segmentation, Competition, Outlook, Trends, Investment Opportunities, Companies, Strategy, Revenue, Share, Value, Restraints
- Colombia Thermally Conductive Filler Dispersants Market (2026-2032) | segmentation, Trends, Share, Drivers, Strategy, Companies, Demand, Insights, Size, Challenges, Value, Competition, Analysis, Growth, Revenue, Restraints, Forecast, Pricing, Outlook, Investment Opportunities
- China Thermally Conductive Filler Dispersants Market (2026-2032) | Restraints, Investment Opportunities, Pricing, Companies, Share, Size, Challenges, Trends, Outlook, Value, Analysis, Competition, Revenue, Drivers, Forecast, Demand, Insights, Growth, Strategy, segmentation
- Chile Thermally Conductive Filler Dispersants Market (2026-2032) | Investment Opportunities, Trends, Value, Restraints, Share, Companies, Forecast, segmentation, Pricing, Challenges, Demand, Size, Analysis, Drivers, Outlook, Growth, Competition, Strategy, Revenue, Insights
- Cambodia Thermally Conductive Filler Dispersants Market (2026-2032) | Analysis, Share, Outlook, Strategy, Pricing, Demand, Size, Growth, segmentation, Insights, Revenue, Forecast, Challenges, Competition, Companies, Investment Opportunities, Trends, Restraints, Value, Drivers
- Brazil Thermally Conductive Filler Dispersants Market (2026-2032) | Restraints, Forecast, Competition, Size, Revenue, Value, Investment Opportunities, Trends, Insights, Outlook, Growth, Analysis, Drivers, segmentation, Pricing, Challenges, Strategy, Share, Companies, Demand
- Bangladesh Thermally Conductive Filler Dispersants Market (2026-2032) | Restraints, Trends, Analysis, Competition, Insights, Forecast, Value, Investment Opportunities, Pricing, Share, Demand, Outlook, Revenue, segmentation, Companies, Drivers, Growth, Size, Challenges, Strategy
- Bahrain Thermally Conductive Filler Dispersants Market (2026-2032) | Trends, Outlook, Pricing, Demand, Value, Competition, Forecast, Growth, segmentation, Revenue, Companies, Analysis, Insights, Size, Drivers, Challenges, Strategy, Investment Opportunities, Share, Restraints
Industry Events and Analyst Meet

HIMTEX 2026

India Refining Summit 2026

India EV Show 2026

EV tech India Expo 2026

Auto Tech Asia 2026
Whitepaper
- Middle East & Africa Commercial Security Market Click here to view more.
- Middle East & Africa Fire Safety Systems & Equipment Market Click here to view more.
- GCC Drone Market Click here to view more.
- Middle East Lighting Fixture Market Click here to view more.
- GCC Physical & Perimeter Security Market Click here to view more.
6WResearch In News
- Doha a strategic location for EV manufacturing hub: IPA Qatar
- Demand for luxury TVs surging in the GCC, says Samsung
- Empowering Growth: The Thriving Journey of Bangladesh’s Cable Industry
- Demand for luxury TVs surging in the GCC, says Samsung
- Video call with a traditional healer? Once unthinkable, it’s now common in South Africa
- Intelligent Buildings To Smooth GCC’s Path To Net Zero