Indonesia Rubber Stamps Market (2026-2032) Outlook | Analysis, Trends, Revenue, Industry, Share, Companies, Forecast, Size, Value & Growth
Market Forecast By Product (Custom Rubber Stamps, Common Rubber Stamps), By Application (Household, Commercial, Others) And Competitive Landscape
| Product Code: ETC255628 | Publication Date: Aug 2023 | Updated Date: Mar 2026 | Product Type: Market Research Report | |
| Publisher: 6Wresearch | Author: Ravi Bhandari | No. of Pages: 75 | No. of Figures: 35 | No. of Tables: 20 |
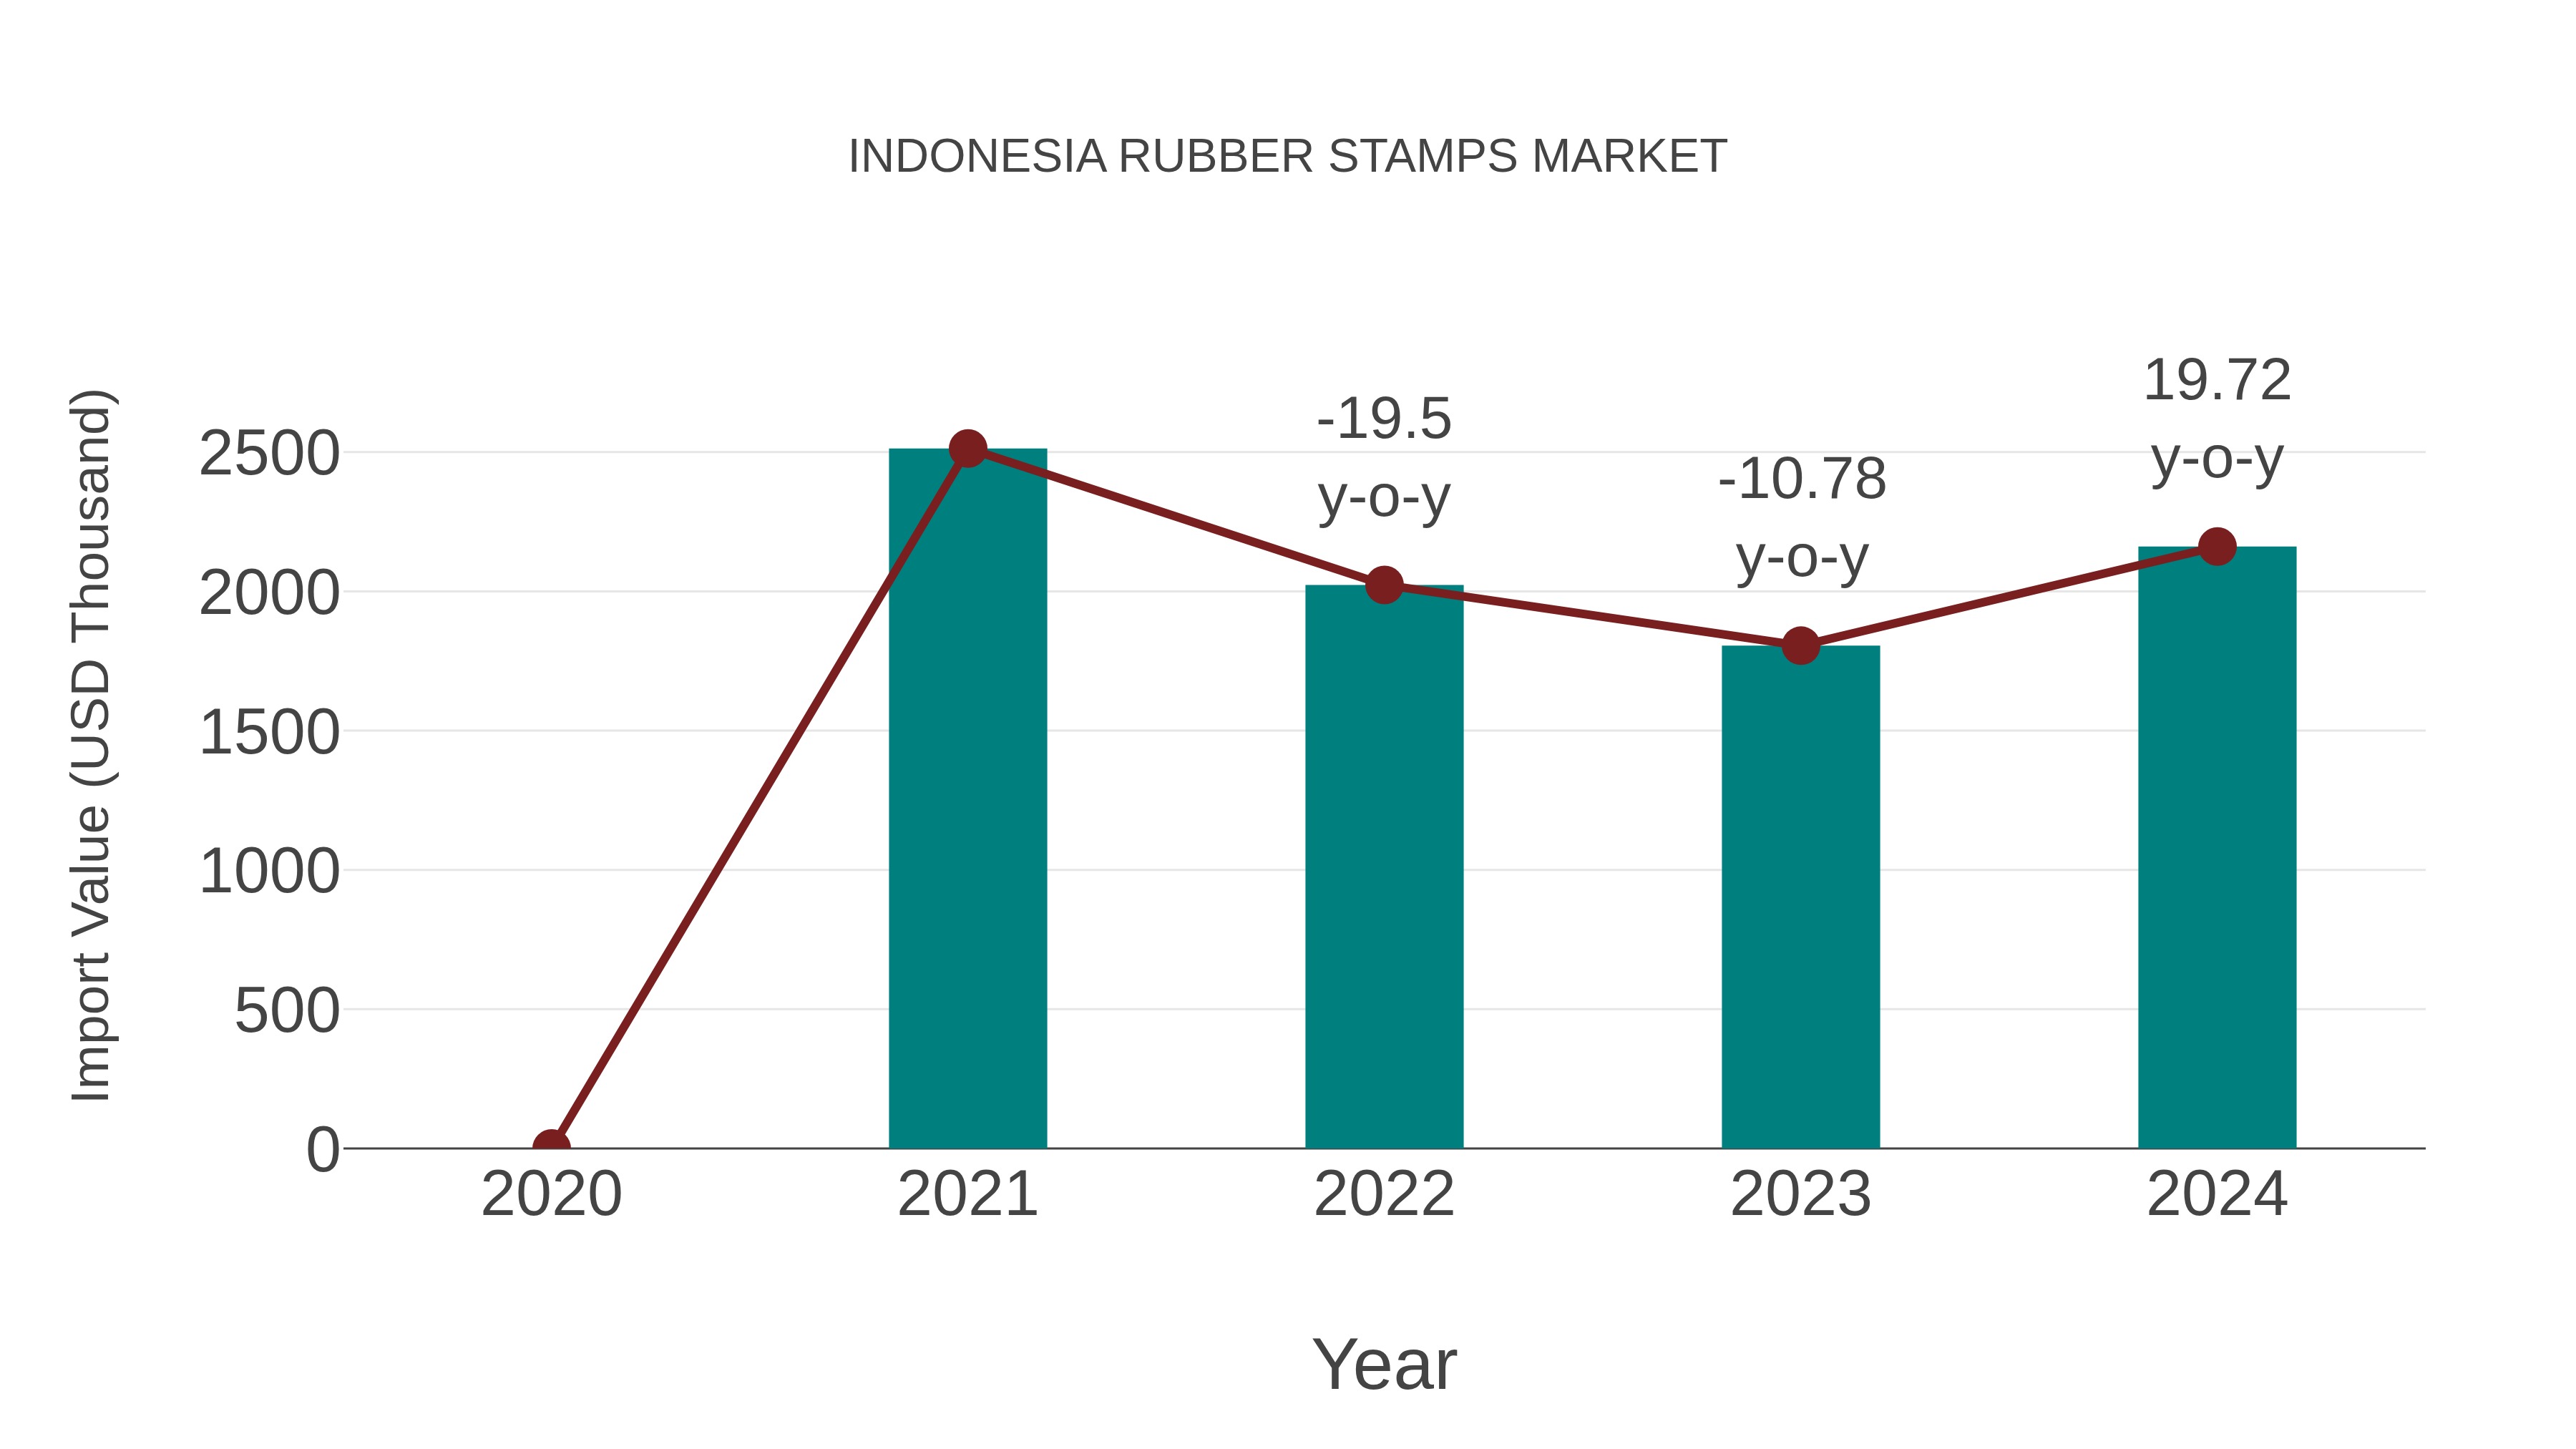
Indonesia Rubber Stamps Market: Import Trend Analysis
In the Indonesia rubber stamps market, import trends saw a growth rate of 19.72% from 2023 to 2024, contrasting with a compound annual growth rate (CAGR) of -4.91% from 2020 to 2024. This shift may be attributed to changes in demand dynamics or market recovery efforts within the industry.
Indonesia Rubber Stamps Market Synopsis
The rubber stamps market in Indonesia is estimated to reach a value of US$ 11 million in 2025, growing at a CAGR of 8. 7% during the forecats period. The largest segment by application is the educational sector which accounts for around 40% of the total demand and has been growing at an average rate of 10. 1%. Other key applications include business & travel documents as well as packaging materials. The top-selling products are manual type stamps and self-inking type stamps with respective market shares of 44% and 34%. Major players operating in this market include Trodat, Imprima, Inoxcrom, Brother International, Trotec Gmbh Co Kg among others.
Drivers of the Market
The rubber stamp market in Indonesia caters to a wide range of industries and sectors, including offices, government institutions, educational institutions, and more. Rubber stamps are commonly used for official documentation, certification, and branding purposes. With a growing economy and an expanding business landscape, the demand for rubber stamps is expected to remain steady.
Challenges of the Market
One of the significant challenges faced by the Indonesia rubber stamps market is the rising competition from digital alternatives. With the increasing digitization of administrative processes and paperwork, there is a shift towards electronic signatures and online document management systems, which poses a threat to the traditional rubber stamps market.
COVID-19 Impact on the Market
Indonesia rubber stamps market may have seen fluctuations as businesses and offices faced closures or operated with limited capacity, impacting the demand for office supplies.
Key Highlights of the Report:
- Indonesia Rubber Stamps Market Outlook
- Market Size of Indonesia Rubber Stamps Market, 2025
- Forecast of Indonesia Rubber Stamps Market, 2032
- Historical Data and Forecast of Indonesia Rubber Stamps Revenues & Volume for the Period 2022-2032F
- Indonesia Rubber Stamps Market Trend Evolution
- Indonesia Rubber Stamps Market Drivers and Challenges
- Indonesia Rubber Stamps Price Trends
- Indonesia Rubber Stamps Porter's Five Forces
- Indonesia Rubber Stamps Industry Life Cycle
- Historical Data and Forecast of Indonesia Rubber Stamps Market Revenues & Volume By Product for the Period 2022-2032F
- Historical Data and Forecast of Indonesia Rubber Stamps Market Revenues & Volume By Custom Rubber Stamps for the Period 2022-2032F
- Historical Data and Forecast of Indonesia Rubber Stamps Market Revenues & Volume By Common Rubber Stamps for the Period 2022-2032F
- Historical Data and Forecast of Indonesia Rubber Stamps Market Revenues & Volume By Application for the Period 2022-2032F
- Historical Data and Forecast of Indonesia Rubber Stamps Market Revenues & Volume By Household for the Period 2022-2032F
- Historical Data and Forecast of Indonesia Rubber Stamps Market Revenues & Volume By Commercial for the Period 2022-2032F
- Historical Data and Forecast of Indonesia Rubber Stamps Market Revenues & Volume By Others for the Period 2022-2032F
- Indonesia Rubber Stamps Import Export Trade Statistics
- Market Opportunity Assessment By Product
- Market Opportunity Assessment By Application
- Indonesia Rubber Stamps Top Companies Market Share
- Indonesia Rubber Stamps Competitive Benchmarking By Technical and Operational Parameters
- Indonesia Rubber Stamps Company Profiles
- Indonesia Rubber Stamps Key Strategic Recommendations
Indonesia Rubber Stamps Market (2026-2032): FAQs
6Wresearch actively monitors the Indonesia Rubber Stamps Market and publishes its comprehensive annual report, highlighting emerging trends, growth drivers, revenue analysis, and forecast outlook. Our insights help businesses to make data-backed strategic decisions with ongoing market dynamics. Our analysts track relevent industries related to the Indonesia Rubber Stamps Market, allowing our clients with actionable intelligence and reliable forecasts tailored to emerging regional needs.
Yes, we provide customisation as per your requirements. To learn more, feel free to contact us on sales@6wresearch.com
1 Executive Summary |
2 Introduction |
2.1 Key Highlights of the Report |
2.2 Report Description |
2.3 Market Scope & Segmentation |
2.4 Research Methodology |
2.5 Assumptions |
3 Indonesia Rubber Stamps Market Overview |
3.1 Indonesia Country Macro Economic Indicators |
3.2 Indonesia Rubber Stamps Market Revenues & Volume, 2022 & 2032F |
3.3 Indonesia Rubber Stamps Market - Industry Life Cycle |
3.4 Indonesia Rubber Stamps Market - Porter's Five Forces |
3.5 Indonesia Rubber Stamps Market Revenues & Volume Share, By Product, 2022 & 2032F |
3.6 Indonesia Rubber Stamps Market Revenues & Volume Share, By Application, 2022 & 2032F |
4 Indonesia Rubber Stamps Market Dynamics |
4.1 Impact Analysis |
4.2 Market Drivers |
4.2.1 Growing demand for personalized and customized stationery products |
4.2.2 Increasing adoption of rubber stamps in arts and crafts activities |
4.2.3 Rise in online sales channels for rubber stamps |
4.3 Market Restraints |
4.3.1 Competition from digital alternatives like electronic signatures |
4.3.2 Fluctuating raw material prices impacting production costs |
4.3.3 Regulatory restrictions on certain types of rubber stamp designs |
5 Indonesia Rubber Stamps Market Trends |
6 Indonesia Rubber Stamps Market, By Types |
6.1 Indonesia Rubber Stamps Market, By Product |
6.1.1 Overview and Analysis |
6.1.2 Indonesia Rubber Stamps Market Revenues & Volume, By Product, 2022-2032F |
6.1.3 Indonesia Rubber Stamps Market Revenues & Volume, By Custom Rubber Stamps, 2022-2032F |
6.1.4 Indonesia Rubber Stamps Market Revenues & Volume, By Common Rubber Stamps, 2022-2032F |
6.2 Indonesia Rubber Stamps Market, By Application |
6.2.1 Overview and Analysis |
6.2.2 Indonesia Rubber Stamps Market Revenues & Volume, By Household, 2022-2032F |
6.2.3 Indonesia Rubber Stamps Market Revenues & Volume, By Commercial, 2022-2032F |
6.2.4 Indonesia Rubber Stamps Market Revenues & Volume, By Others, 2022-2032F |
7 Indonesia Rubber Stamps Market Import-Export Trade Statistics |
7.1 Indonesia Rubber Stamps Market Export to Major Countries |
7.2 Indonesia Rubber Stamps Market Imports from Major Countries |
8 Indonesia Rubber Stamps Market Key Performance Indicators |
8.1 Number of new product designs launched per quarter |
8.2 Customer satisfaction score related to product quality and customization options |
8.3 Percentage of sales generated through online platforms |
8.4 Average order value per customer |
8.5 Rate of repeat purchases from existing customers |
9 Indonesia Rubber Stamps Market - Opportunity Assessment |
9.1 Indonesia Rubber Stamps Market Opportunity Assessment, By Product, 2022 & 2032F |
9.2 Indonesia Rubber Stamps Market Opportunity Assessment, By Application, 2022 & 2032F |
10 Indonesia Rubber Stamps Market - Competitive Landscape |
10.1 Indonesia Rubber Stamps Market Revenue Share, By Companies, 2025 |
10.2 Indonesia Rubber Stamps Market Competitive Benchmarking, By Operating and Technical Parameters |
11 Company Profiles |
12 Recommendations |
13 Disclaimer |
Global Go To Market Strategy - 2030
Export potential enables firms to identify high-growth global markets with greater confidence by combining advanced trade intelligence with a structured quantitative methodology. The framework analyzes emerging demand trends and country-level import patterns while integrating macroeconomic and trade datasets such as GDP and population forecasts, bilateral import–export flows, tariff structures, elasticity differentials between developed and developing economies, geographic distance, and import demand projections. Using weighted trade values from 2020–2024 as the base period to project country-to-country export potential for 2030, these inputs are operationalized through calculated drivers such as gravity model parameters, tariff impact factors, and projected GDP per-capita growth. Through an analysis of hidden potentials, demand hotspots, and market conditions that are most favorable to success, this method enables firms to focus on target countries, maximize returns, and global expansion with data, backed by accuracy.
By factoring in the projected importer demand gap that is currently unmet and could be potential opportunity, it identifies the potential for the Exporter (Country) among 190 countries, against the general trade analysis, which identifies the biggest importer or exporter.
To discover high-growth global markets and optimize your business strategy:
Click Here
Pricing
- Single User License$ 1,995
- Department License$ 2,400
- Site License$ 3,120
- Global License$ 3,795

Leadership Perspectives from Industry Events
Search
Thought Leadership and Analyst Meet


Our Clients
6WResearch In News
- India Air Conditioner Market Set for Strong Rebound in 2026 After Weather-Led Correction and GST-Driven Recovery: 6Wresearch
- ADAS in India: How Automatic Emergency Braking, Blind Spot Detection & Driver Monitoring are Transforming Road Safety
- Doha a strategic location for EV manufacturing hub: IPA Qatar
- Demand for luxury TVs surging in the GCC, says Samsung
- Empowering Growth: The Thriving Journey of Bangladesh’s Cable Industry
- Demand for luxury TVs surging in the GCC, says Samsung
Latest Reports
- Poland Fire Protection Systems Market (2026-2032)
- Cape Verde Portable Hand-Thrown Extinguisher Market (2026-2032)
- Canada Portable Hand-Thrown Extinguisher Market (2026-2032)
- Cameroon Portable Hand-Thrown Extinguisher Market (2026-2032)
- Burundi Portable Hand-Thrown Extinguisher Market (2026-2032)
- Burkina Faso Portable Hand-Thrown Extinguisher Market (2026-2032)
- Bulgaria Portable Hand-Thrown Extinguisher Market (2026-2032)
- Brunei Portable Hand-Thrown Extinguisher Market (2026-2032)
- Botswana Portable Hand-Thrown Extinguisher Market (2026-2032)
- Bosnia and Herzegovina Portable Hand-Thrown Extinguisher Market (2026-2032)
Industry Events and Analyst Meet

HIMTEX 2026

India Refining Summit 2026

India EV Show 2026

EV tech India Expo 2026

Auto Tech Asia 2026
Whitepaper
- Middle East & Africa Commercial Security Market Click here to view more.
- Middle East & Africa Fire Safety Systems & Equipment Market Click here to view more.
- GCC Drone Market Click here to view more.
- Middle East Lighting Fixture Market Click here to view more.
- GCC Physical & Perimeter Security Market Click here to view more.