Indonesia Smart Robots Market (2026-2032) Outlook | Analysis, Growth, Size, Revenue, Value, Forecast, Trends, Share, Companies & Industry
Market Forecast By Component (Hardware, Software), By Mobility (Stationary, Mobile), By Operating Environment (Ground, Underwater), By Application (Personal and Domestic, Professional) And Competitive Landscape
| Product Code: ETC270988 | Publication Date: Aug 2023 | Updated Date: Jul 2026 | Product Type: Market Research Report | |
| Publisher: 6Wresearch | Author: Ravi Bhandari | No. of Pages: 75 | No. of Figures: 35 | No. of Tables: 20 |
Indonesia Smart Robots Market Size, Share & Growth Rate
The Indonesia Smart Robots Market was estimated at USD 796 Million in 2025 and is projected to reach USD 1165 Million by 2032, growing at a CAGR of 5.6% from 2026 to 2032. This growth trajectory is propelled by the increasing adoption of artificial intelligence and automation across various sectors, particularly manufacturing, healthcare, and logistics. As industries strive to enhance productivity and efficiency, the demand for intelligent robotic solutions continues to escalate.
Indonesia Smart Robots Market Growth Rate Analysis (2021-2032)
The Indonesian smart robots market is experiencing notable growth, evidenced by a steady annual increase that began at -0.0% in 2021, transitioning to 5.1% in 2022, and reaching 6.3% in 2023. This upward trend is fueled by rising consumer demand, rapid digitalization across various sectors, and significant investments in technology and infrastructure. From 2024 onwards, growth accelerates, peaking at 8.3% in 2032. Key drivers include advancements in automation technologies and government policies promoting innovation. The growing focus on energy transition and sustainable solutions has also enhanced the appeal of smart robots across industries, reflecting Indonesia's evolving economic landscape and increasing adoption rates among businesses.
Indonesia Smart Robots Market Year-wise Growth Rate and Key Drivers
This graph highlights how the Indonesia Smart Robots Market has steadily grown over the past five years, supported by major growth factors.
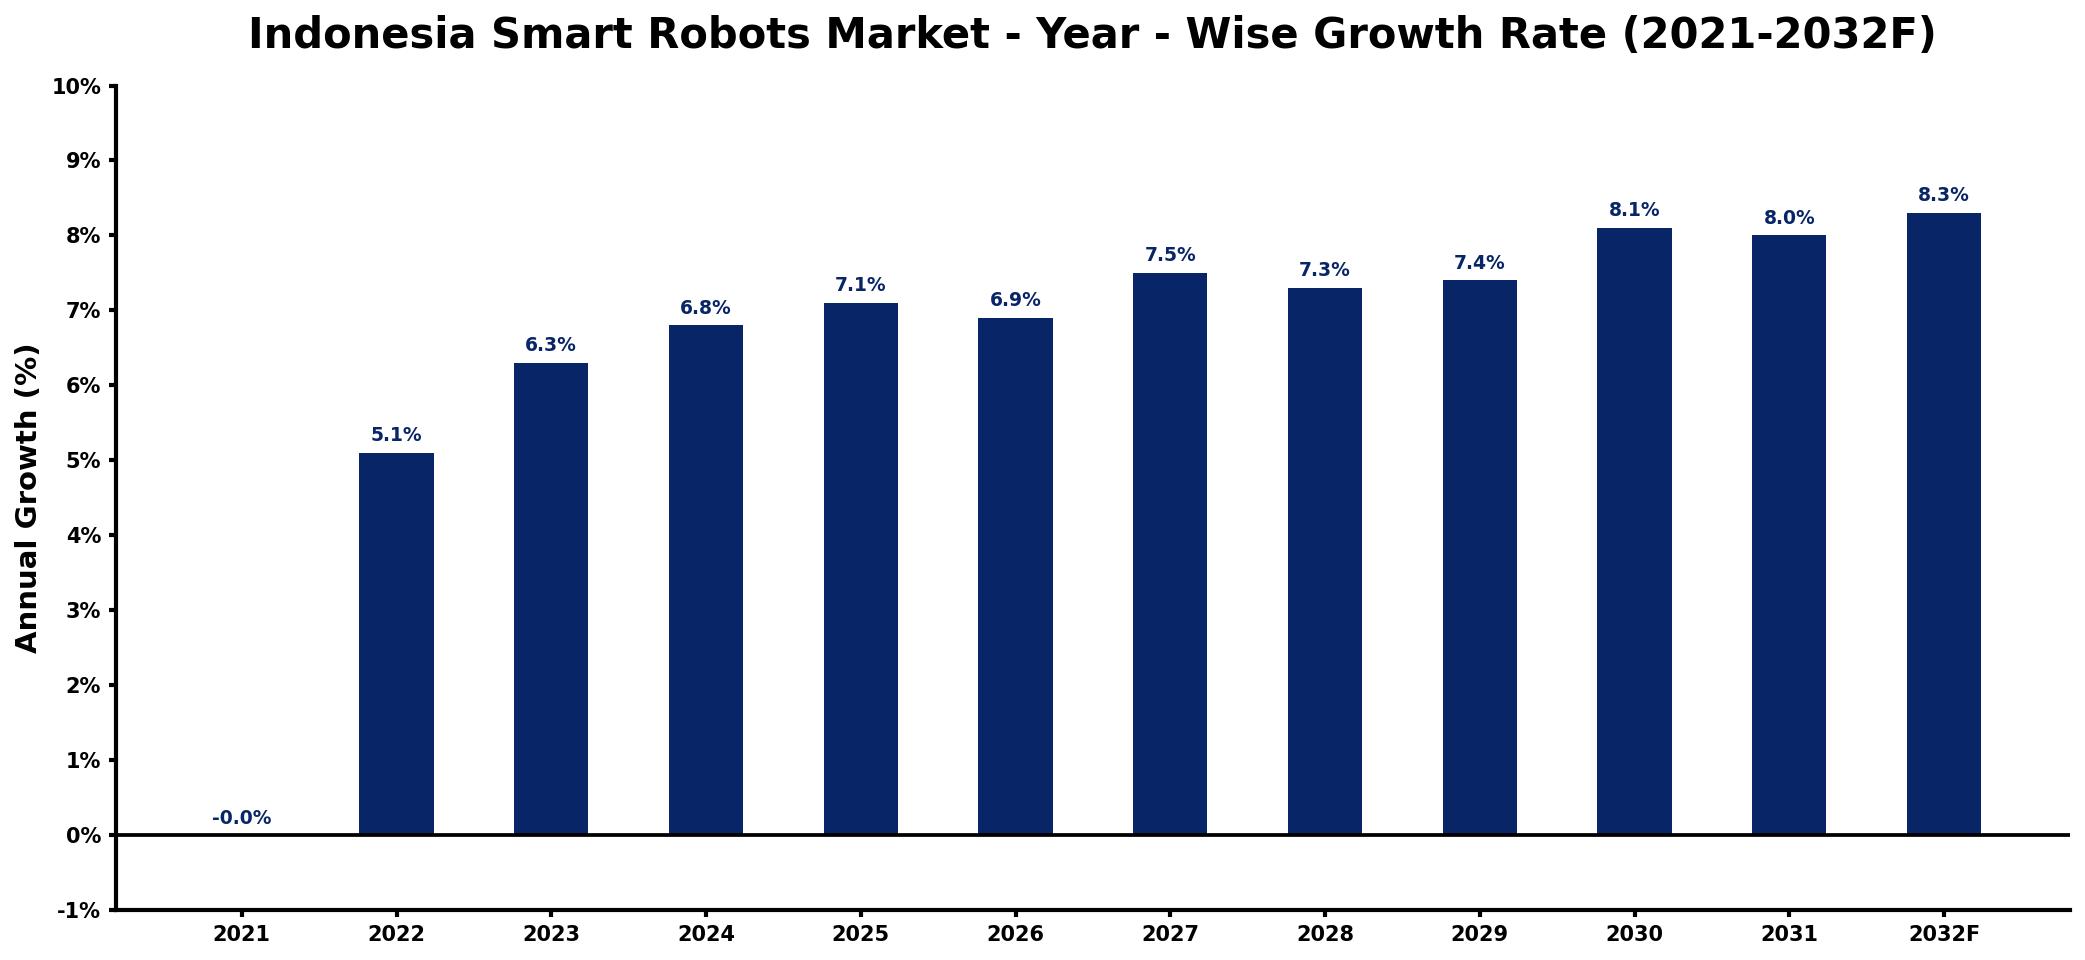
The table below presents the year‑wise growth rates along with the key drivers influencing the market
| Year | Growth Rate | Major Drivers |
| 2021 | -0.0% | Initial investments in automation technology |
| 2022 | 5.1% | Rising demand for efficiency solutions |
| 2023 | 6.3% | Expansion of industrial automation sector |
| 2024 | 6.8% | increased domestic production output |
| 2025 | 7.1% | Growing adoption in manufacturing processes |
| 2026 | 6.9% | Surge in logistics automation needs |
| 2027 | 7.5% | Advancements in artificial intelligence applications |
| 2028 | 7.3% | Broader integration in healthcare facilities |
| 2029 | 7.4% | Enhanced consumer service expectations |
| 2030 | 8.1% | Government incentives for technological adoption |
| 2031 | 8.0% | Emergence of new market entrants |
| 2032 | 8.3% | Increased investment in research development |
Note: Market size estimations and growth projections presented in this report are based on 6Wresearch's proprietary forecasting methodology, utilizing the latest available industry data, government publications, and primary research inputs.
Indonesia Smart Robots Market Synopsis
The Indonesia smart robots market is experiencing robust momentum as various sectors recognize the critical need for automation. While the current landscape is characterized by a growing number of deployments in healthcare, retail, and manufacturing, the future promises even greater integration of smart robotics driven by technological advancements.
With rising urbanization and a push toward modernizing industrial practices, the smart robots market is poised for significant evolution. However, the path forward will necessitate overcoming challenges related to workforce integration and technological complexity, ensuring a seamless transition into an automated ecosystem.
Indonesia Smart Robots Market Key Takeaways
- The market is anticipated to grow significantly due to advancements in AI and automation technologies.
- Healthcare, retail, and logistics are among the leading sectors driving demand for smart robots.
- Concerns regarding workforce displacement and the need for reskilling present critical considerations for industry stakeholders.
- The manufacturing sector remains a vital contributor to the growth of the robotics market in Indonesia.
- Government initiatives may play a key role in shaping the regulatory landscape and encouraging innovation.
Evaluation of Restraints in Indonesia Smart Robots Market
While the potential for growth in the Indonesia smart robots market is significant, several key restraints must be addressed. The complexity of integrating advanced technologies presents a challenge for many organizations, particularly those with limited experience in automation. Furthermore, the concern regarding job displacement raises critical questions about how industries can effectively manage the transition of their workforce. Companies must invest in training programs to reskill employees while ensuring that robots are user-friendly, safe, and capable of working harmoniously alongside human operators.
Indonesia Smart Robots Market Trends
A notable trend in the Indonesia smart robots market is the increasing reliance on collaborative robots or cobots, which are designed to work alongside humans. This trend emphasizes safety and usability, addressing concerns about integration within the workforce. Additionally, the healthcare sector is witnessing a surge in telemedicine solutions, which further incentivizes the adoption of robotics for remote patient care and monitoring. These evolving preferences are reshaping how industries view and implement robotic solutions.
Indonesia Smart Robots Market Opportunities
The opportunities within the Indonesia smart robots market are vast, particularly for organizations focused on innovation in AI and automation technologies. Sectors such as agriculture and logistics present genuine avenues for growth, as smart robots can optimize processes and improve supply chain efficiencies. Furthermore, emerging market players have the chance to develop niche applications tailored to specific industry needs, creating competitive advantages in an evolving landscape.
Government Initiatives in the Indonesia Smart Robots Market
The Indonesian government is actively promoting the integration of technology across industries, viewing automation and robotics as a means to enhance productivity and competitiveness. Various initiatives and programs aim to encourage research and development in robotics, including incentives for companies that invest in advanced manufacturing technologies. These policies are likely to pave the way for smoother regulations and greater collaboration between public and private sectors.
Future Insights of the Indonesia Smart Robots Market
Looking ahead to 2026-2032, the Indonesia smart robots market is set to evolve with the integration of advanced AI capabilities and machine learning. As industries adopt more sophisticated robotic systems, the emphasis will be on enhancing operational efficiency and adaptability. Stakeholders must stay informed about technological advancements to leverage these opportunities fully and ensure robust market growth.
Indonesia Smart Robots Market Latest Developments (2025 - 2026)
In recent months, the smart robots market in Indonesia has seen notable developments, particularly regarding partnerships aimed at enhancing the capabilities of robotic systems. As companies invest in research and development, there is an increased focus on improving the safety and user-friendliness of robots, catering to both industrial and consumer markets. Additionally, events promoting robotics and automation have attracted significant attention, highlighting the growing interest and potential within the sector.
Indonesia Smart Robots Market - Key Attractiveness of the Report
- 10 Years of Market Numbers
- Historical Data Starting from 2022 to 2025
- Base Year: 2025
- Forecast Data until 2032
- Key Performance Indicators Impacting the Market
- Major Upcoming Developments and Projects
Key Highlights of the Report:
- Indonesia Smart Robots Market Outlook
- Market Size of Indonesia Smart Robots Market, 2025
- Forecast of Indonesia Smart Robots Market, 2032
- Historical Data and Forecast of Indonesia Smart Robots Revenues & Volume for the Period 2022-2032F
- Indonesia Smart Robots Market Trend Evolution
- Indonesia Smart Robots Market Drivers and Challenges
- Indonesia Smart Robots Price Trends
- Indonesia Smart Robots Porter's Five Forces
- Indonesia Smart Robots Industry Life Cycle
- Historical Data and Forecast of Indonesia Smart Robots Market Revenues & Volume By Component for the Period 2022-2032F
- Historical Data and Forecast of Indonesia Smart Robots Market Revenues & Volume By Hardware for the Period 2022-2032F
- Historical Data and Forecast of Indonesia Smart Robots Market Revenues & Volume By Software for the Period 2022-2032F
- Historical Data and Forecast of Indonesia Smart Robots Market Revenues & Volume By Mobility for the Period 2022-2032F
- Historical Data and Forecast of Indonesia Smart Robots Market Revenues & Volume By Stationary for the Period 2022-2032F
- Historical Data and Forecast of Indonesia Smart Robots Market Revenues & Volume By Mobile for the Period 2022-2032F
- Historical Data and Forecast of Indonesia Smart Robots Market Revenues & Volume By Operating Environment for the Period 2022-2032F
- Historical Data and Forecast of Indonesia Smart Robots Market Revenues & Volume By Ground for the Period 2022-2032F
- Historical Data and Forecast of Indonesia Smart Robots Market Revenues & Volume By Underwater for the Period 2022-2032F
- Historical Data and Forecast of Indonesia Smart Robots Market Revenues & Volume By Application for the Period 2022-2032F
- Historical Data and Forecast of Indonesia Smart Robots Market Revenues & Volume By Personal and Domestic for the Period 2022-2032F
- Historical Data and Forecast of Indonesia Smart Robots Market Revenues & Volume By Professional for the Period 2022-2032F
- Indonesia Smart Robots Import Export Trade Statistics
- Market Opportunity Assessment By Component
- Market Opportunity Assessment By Mobility
- Market Opportunity Assessment By Operating Environment
- Market Opportunity Assessment By Application
- Indonesia Smart Robots Top Companies Market Share
- Indonesia Smart Robots Competitive Benchmarking By Technical and Operational Parameters
- Indonesia Smart Robots Company Profiles
- Indonesia Smart Robots Key Strategic Recommendations
Frequently Asked Questions About the Market Study (FAQs):
The growth is primarily driven by advancements in AI and automation technology, alongside increasing demand from manufacturing, healthcare, and logistics sectors.
The market is estimated at USD 796 Million in 2025 and is projected to reach USD 1165 Million by 2032, growing at a CAGR of 5.6% from 2026 to 2032.
The government promotes technology integration through initiatives and incentives aimed at boosting research and development in robotics, ensuring a conducive environment for growth.
The healthcare, manufacturing, and logistics sectors are leading the charge in adopting smart robots, reflecting a strong demand for automation solutions.
The complexity of integrating smart robots with existing operations poses a challenge, as companies must address workforce reskilling and ensure that robots are safe and user-friendly.
6Wresearch actively monitors the Indonesia Smart Robots Market and publishes its comprehensive annual report, highlighting emerging trends, growth drivers, revenue analysis, and forecast outlook. Our insights help businesses to make data-backed strategic decisions with ongoing market dynamics. Our analysts track relevent industries related to the Indonesia Smart Robots Market, allowing our clients with actionable intelligence and reliable forecasts tailored to emerging regional needs.
Yes, we provide customisation as per your requirements. To learn more, feel free to contact us on sales@6wresearch.com
1 Executive Summary |
2 Introduction |
2.1 Key Highlights of the Report |
2.2 Report Description |
2.3 Market Scope & Segmentation |
2.4 Research Methodology |
2.5 Assumptions |
3 Indonesia Smart Robots Market Overview |
3.1 Indonesia Country Macro Economic Indicators |
3.2 Indonesia Smart Robots Market Revenues & Volume, 2022 & 2032F |
3.3 Indonesia Smart Robots Market - Industry Life Cycle |
3.4 Indonesia Smart Robots Market - Porter's Five Forces |
3.5 Indonesia Smart Robots Market Revenues & Volume Share, By Component, 2022 & 2032F |
3.6 Indonesia Smart Robots Market Revenues & Volume Share, By Mobility, 2022 & 2032F |
3.7 Indonesia Smart Robots Market Revenues & Volume Share, By Operating Environment, 2022 & 2032F |
3.8 Indonesia Smart Robots Market Revenues & Volume Share, By Application, 2022 & 2032F |
4 Indonesia Smart Robots Market Dynamics |
4.1 Impact Analysis |
4.2 Market Drivers |
4.2.1 Increasing adoption of automation and robotics in industries to improve efficiency and productivity. |
4.2.2 Government initiatives and investments in smart technologies to drive digital transformation. |
4.2.3 Rising demand for smart robots in sectors such as manufacturing, healthcare, and logistics. |
4.3 Market Restraints |
4.3.1 High initial investment costs associated with smart robot implementation. |
4.3.2 Lack of skilled workforce to operate and maintain smart robots effectively. |
4.3.3 Concerns about data security and privacy in smart robot applications. |
5 Indonesia Smart Robots Market Trends |
6 Indonesia Smart Robots Market, By Types |
6.1 Indonesia Smart Robots Market, By Component |
6.1.1 Overview and Analysis |
6.1.2 Indonesia Smart Robots Market Revenues & Volume, By Component, 2022-2032F |
6.1.3 Indonesia Smart Robots Market Revenues & Volume, By Hardware, 2022-2032F |
6.1.4 Indonesia Smart Robots Market Revenues & Volume, By Software, 2022-2032F |
6.2 Indonesia Smart Robots Market, By Mobility |
6.2.1 Overview and Analysis |
6.2.2 Indonesia Smart Robots Market Revenues & Volume, By Stationary, 2022-2032F |
6.2.3 Indonesia Smart Robots Market Revenues & Volume, By Mobile, 2022-2032F |
6.3 Indonesia Smart Robots Market, By Operating Environment |
6.3.1 Overview and Analysis |
6.3.2 Indonesia Smart Robots Market Revenues & Volume, By Ground, 2022-2032F |
6.3.3 Indonesia Smart Robots Market Revenues & Volume, By Underwater, 2022-2032F |
6.4 Indonesia Smart Robots Market, By Application |
6.4.1 Overview and Analysis |
6.4.2 Indonesia Smart Robots Market Revenues & Volume, By Personal and Domestic, 2022-2032F |
6.4.3 Indonesia Smart Robots Market Revenues & Volume, By Professional, 2022-2032F |
7 Indonesia Smart Robots Market Import-Export Trade Statistics |
7.1 Indonesia Smart Robots Market Export to Major Countries |
7.2 Indonesia Smart Robots Market Imports from Major Countries |
8 Indonesia Smart Robots Market Key Performance Indicators |
8.1 Percentage increase in the number of companies adopting smart robots in Indonesia. |
8.2 Average time saved per task through the use of smart robots. |
8.3 Number of research and development collaborations between local companies and technology providers in the smart robot industry. |
9 Indonesia Smart Robots Market - Opportunity Assessment |
9.1 Indonesia Smart Robots Market Opportunity Assessment, By Component, 2022 & 2032F |
9.2 Indonesia Smart Robots Market Opportunity Assessment, By Mobility, 2022 & 2032F |
9.3 Indonesia Smart Robots Market Opportunity Assessment, By Operating Environment, 2022 & 2032F |
9.4 Indonesia Smart Robots Market Opportunity Assessment, By Application, 2022 & 2032F |
10 Indonesia Smart Robots Market - Competitive Landscape |
10.1 Indonesia Smart Robots Market Revenue Share, By Companies, 2025 |
10.2 Indonesia Smart Robots Market Competitive Benchmarking, By Operating and Technical Parameters |
11 Company Profiles |
12 Recommendations |
13 Disclaimer |
Global Go To Market Strategy - 2030
Export potential enables firms to identify high-growth global markets with greater confidence by combining advanced trade intelligence with a structured quantitative methodology. The framework analyzes emerging demand trends and country-level import patterns while integrating macroeconomic and trade datasets such as GDP and population forecasts, bilateral import–export flows, tariff structures, elasticity differentials between developed and developing economies, geographic distance, and import demand projections. Using weighted trade values from 2020–2024 as the base period to project country-to-country export potential for 2030, these inputs are operationalized through calculated drivers such as gravity model parameters, tariff impact factors, and projected GDP per-capita growth. Through an analysis of hidden potentials, demand hotspots, and market conditions that are most favorable to success, this method enables firms to focus on target countries, maximize returns, and global expansion with data, backed by accuracy.
By factoring in the projected importer demand gap that is currently unmet and could be potential opportunity, it identifies the potential for the Exporter (Country) among 190 countries, against the general trade analysis, which identifies the biggest importer or exporter.
To discover high-growth global markets and optimize your business strategy:
Click Here
Pricing
- Single User License$ 1,995
- Department License$ 2,400
- Site License$ 3,120
- Global License$ 3,795

Leadership Perspectives from Industry Events
Search
Thought Leadership and Analyst Meet


Our Clients
6WResearch In News
- India Air Conditioner Market Set for Strong Rebound in 2026 After Weather-Led Correction and GST-Driven Recovery: 6Wresearch
- ADAS in India: How Automatic Emergency Braking, Blind Spot Detection & Driver Monitoring are Transforming Road Safety
- Doha a strategic location for EV manufacturing hub: IPA Qatar
- Demand for luxury TVs surging in the GCC, says Samsung
- Empowering Growth: The Thriving Journey of Bangladesh’s Cable Industry
- Demand for luxury TVs surging in the GCC, says Samsung
Latest Reports
- Nicaragua RPG Gaming Market (2026-2032)
- New Zealand RPG Gaming Market (2026-2032)
- Netherlands RPG Gaming Market (2026-2032)
- Nauru RPG Gaming Market (2026-2032)
- Namibia RPG Gaming Market (2026-2032)
- Mozambique RPG Gaming Market (2026-2032)
- Montenegro RPG Gaming Market (2026-2032)
- Mongolia RPG Gaming Market (2026-2032)
- Monaco RPG Gaming Market (2026-2032)
- Micronesia RPG Gaming Market (2026-2032)
Industry Events and Analyst Meet

HIMTEX 2026

India Refining Summit 2026

India EV Show 2026

EV tech India Expo 2026

Auto Tech Asia 2026
Whitepaper
- Middle East & Africa Commercial Security Market Click here to view more.
- Middle East & Africa Fire Safety Systems & Equipment Market Click here to view more.
- GCC Drone Market Click here to view more.
- Middle East Lighting Fixture Market Click here to view more.
- GCC Physical & Perimeter Security Market Click here to view more.