Indonesia Sodium Percarbonate Market (2026-2032) Outlook | Trends, Industry, Value, Share, Forecast, Analysis, Companies, Size, Revenue & Growth
Market Forecast By Type (Coated, Uncoated, Tablet), By Application (Detergent Agent, Cleaning Agent, Bleaching Agent, Water Treatment, Others), By End-users (Household Cleaning, Laundry, Industrial Cleaning, Textile Industry, Chemical Industry, Papermaking Industry, Food Industry, Others) And Competitive Landscape
| Product Code: ETC091247 | Publication Date: Jul 2023 | Updated Date: Jun 2026 | Product Type: Report | |
| Publisher: 6Wresearch | Author: Ravi Bhandari | No. of Pages: 70 | No. of Figures: 35 | No. of Tables: 5 |
Indonesia Sodium Percarbonate Market Size, Share & Growth Rate
The Indonesia Sodium Percarbonate Market was estimated at USD 263 Million in 2025 and is projected to reach USD 349 Million by 2032, growing at a CAGR of 4.1% from 2026 to 2032. This growth trajectory reflects a rising consumer preference for environmentally friendly cleaning products and an increasing acceptance of advanced cleaning technologies. As awareness of health and safety concerns grows, sodium percarbonate is increasingly positioned as a go-to solution for effective cleaning and disinfection across diverse applications in Indonesia.
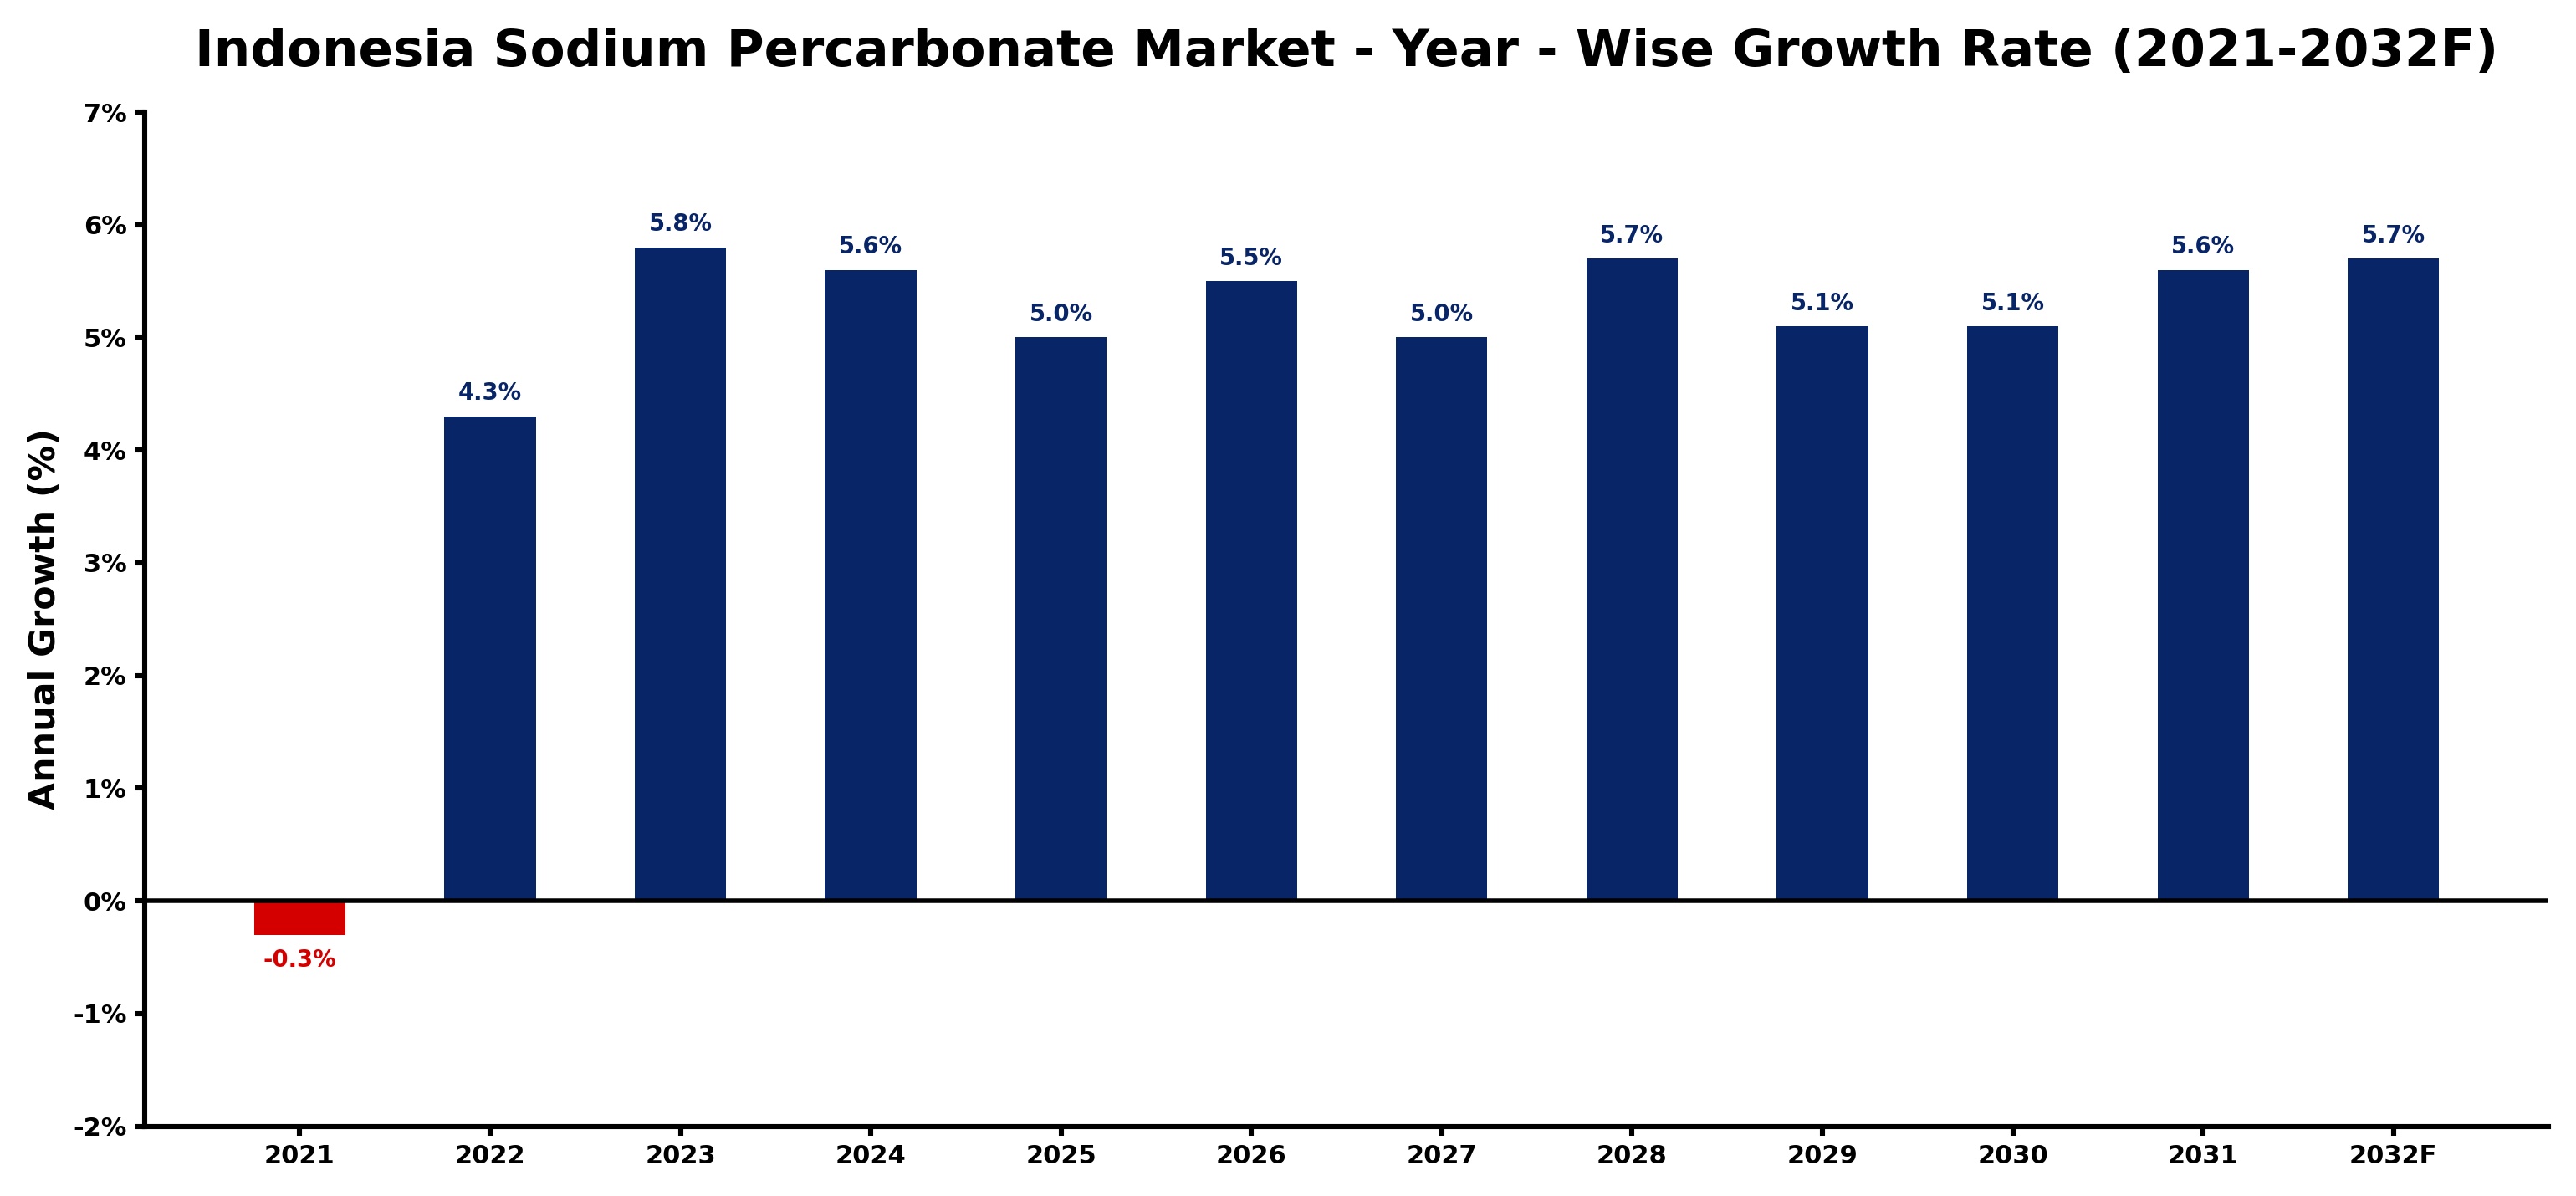
Indonesia Sodium Percarbonate Market Growth Rate Analysis (2021-2032)
The sodium percarbonate market in Indonesia has experienced a notable recovery and growth since 2021, rebounding from a slight decline of 0.3% in that year. The sector saw a robust uptick of 4.3% in 2022, driven by rising demand in cleaning and personal care products, alongside increased investments in eco-friendly manufacturing processes. This positive trend accelerated further, with growth rates of 5.8% in 2023 and projected increases of 5.6% in 2024 and 5.0% in 2025. Factors such as advancements in production technology, heightened consumer awareness about sustainability, and supportive government policies are fueling this upward momentum, establishing a strong foundation for continued expansion through 2032, where growth rates are expected to remain competitive, around 5.7%.
Indonesia Sodium Percarbonate Market Year-wise Growth Rate and Key Drivers
This graph highlights how the Indonesia Sodium Percarbonate Market has steadily grown over the past five years, supported by major growth factors.
The table below presents the year‑wise growth rates along with the key drivers influencing the market
| Year | Growth Rate | Major Drivers |
| 2021 | -0.3% | Manufacturing slowdowns hinder sodium percarbonate demand and procurement |
| 2022 | 4.3% | Manufacturing modernization drives sodium percarbonate demand for cleaner production |
| 2023 | 5.8% | Increased manufacturing investments boost sodium percarbonate production capabilities |
| 2024 | 5.6% | Manufacturing modernization drives sodium percarbonate usage in textiles |
| 2025 | 5.0% | Manufacturing investments bolstered domestic sodium percarbonate production capacity |
| 2026 | 5.5% | Domestic chemical production efficiency drives sodium percarbonate output levels |
| 2027 | 5.0% | Industrial modernization spurred demand for high quality sodium percarbonate |
| 2028 | 5.7% | Manufacturing investments boosted local sodium percarbonate production capacity |
| 2029 | 5.1% | Export driven demand for cleaner production enhances sodium percarbonate utilization |
| 2030 | 5.1% | New manufacturing plants boost sodium percarbonate output for exports |
| 2031 | 5.6% | Manufacturing investments in automation boost sodium percarbonate output efficiency |
| 2032 | 5.7% | Modernized supply chain logistics drive sodium percarbonate distribution efficiency |
Note - Market size estimations and growth projections presented in this report are based on 6Wresearch’s advanced forecasting approach, validated with industry datasets as of June 2026.
Indonesia Sodium Percarbonate Market Synopsis
The Indonesian sodium percarbonate market has demonstrated significant momentum recently, fueled by a sharp increase in demand for effective cleaning agents. As consumers actively seek safer chemical options, the market is evolving to meet this new standard, providing opportunities for growth in both traditional and innovative applications.
Looking ahead, the market is on track to expand further as manufacturers continue to invest in research and development, driving innovation and enhancing product offerings. This evolution is compounded by growing environmental regulations that encourage sustainable practices, ensuring a robust future for sodium percarbonate in Indonesia.
Indonesia Sodium Percarbonate Market Key Takeaways
- The market is witnessing significant growth driven by eco-friendly cleaning solutions and increased consumer demand.
- Innovative product development is crucial for maintaining competitive advantage and attracting new customer segments.
- Regulatory support for sustainable products is further stimulating market expansion.
- Rising disposable incomes are enabling consumers to opt for premium cleaning solutions.
- The COVID-19 pandemic has permanently shifted consumer focus towards hygiene and sanitation, benefiting sodium percarbonate sales.
Evaluation of Restraints in Indonesia Sodium Percarbonate Market
Despite the market's growth potential, several constraints hinder its progress. The high cost associated with manufacturing sodium percarbonate poses a barrier to market entry for new players, which could stifle competition. Additionally, the limited availability of raw materials can lead to supply chain challenges and fluctuating prices that deter investment. These factors create uncertainties that may impact long-term growth prospects.
Indonesia Sodium Percarbonate Market Trends
Current trends in the Indonesian sodium percarbonate market point towards an increased emphasis on sustainable and biodegradable products. With rising consumer awareness regarding health and environmental impacts, manufacturers are innovating to develop formulations that not only meet efficacy requirements but also align with eco-friendly standards. Furthermore, the integration of advanced technologies such as ultra-concentrated formulations is gaining traction, enhancing product appeal to consumers.
Indonesia Sodium Percarbonate Market Opportunities
The Indonesian market presents numerous growth opportunities, particularly for companies willing to innovate. Expanding the range of sodium percarbonate applications—from household cleaning to industrial uses—can unlock significant revenue streams. Furthermore, partnerships with eco-conscious brands can enhance market visibility while meeting the rising demand for green products. Targeting emerging urban centers with tailored marketing strategies can also drive sales growth, given the shift towards urbanization in Indonesia.
Government Initiatives in the Indonesia Sodium Percarbonate Market
The Indonesian government is actively promoting environmental sustainability through various policies and initiatives aimed at reducing the environmental impact of chemical products. Supportive measures for research and development, as well as incentives for the production of eco-friendly alternatives, are crucial in shaping the sodium percarbonate market landscape. Regulatory frameworks that encourage the transition to sustainable solutions are expected to play a pivotal role in shaping future market dynamics.
Future Insights of the Indonesia Sodium Percarbonate Market
Between 2026 and 2032, the Indonesian sodium percarbonate market is anticipated to undergo transformative changes driven by evolving consumer preferences and regulatory pressures for sustainable products. As the market matures, innovative formulations and expanded applications are expected to take center stage. The long-term outlook appears promising, as companies that prioritize sustainability and invest in technological advancements are likely to thrive in this growing sector.
Indonesia Sodium Percarbonate Market Latest Developments (May 2025 - June 2026)
In recent months, the Indonesian sodium percarbonate market has seen significant developments, including heightened investment in sustainable production technologies. Several manufacturers have launched new product lines targeting eco-conscious consumers while aligning with stringent environmental regulations. Additionally, collaborative efforts between the public and private sectors are fostering innovation, aimed at increasing market penetration and expanding access to high-quality cleaning solutions.
Indonesia Sodium Percarbonate Market - Key Attractiveness of the Report
- 10 Years of Market Numbers
- Historical Data Starting from 2022 to 2025
- Base Year: 2025
- Forecast Data until 2032
- Key Performance Indicators Impacting the Market
- Major Upcoming Developments and Projects
Key Highlights of the Report:
- Indonesia Sodium Percarbonate Market Outlook
- Market Size of Indonesia Sodium Percarbonate Market, 2025
- Forecast of Indonesia Sodium Percarbonate Market, 2032
- Historical Data and Forecast of Indonesia Sodium Percarbonate Revenues & Volume for the Period 2022-2032F
- Indonesia Sodium Percarbonate Market Trend Evolution
- Indonesia Sodium Percarbonate Market Drivers and Challenges
- Indonesia Sodium Percarbonate Price Trends
- Indonesia Sodium Percarbonate Porter's Five Forces
- Indonesia Sodium Percarbonate Industry Life Cycle
- Historical Data and Forecast of Indonesia Sodium Percarbonate Market Revenues & Volume By Type for the Period 2022-2032F
- Historical Data and Forecast of Indonesia Sodium Percarbonate Market Revenues & Volume By Coated for the Period 2022-2032F
- Historical Data and Forecast of Indonesia Sodium Percarbonate Market Revenues & Volume By Uncoated for the Period 2022-2032F
- Historical Data and Forecast of Indonesia Sodium Percarbonate Market Revenues & Volume By Tablet for the Period 2022-2032F
- Historical Data and Forecast of Indonesia Sodium Percarbonate Market Revenues & Volume By Application for the Period 2022-2032F
- Historical Data and Forecast of Indonesia Sodium Percarbonate Market Revenues & Volume By Detergent Agent for the Period 2022-2032F
- Historical Data and Forecast of Indonesia Sodium Percarbonate Market Revenues & Volume By Cleaning Agent for the Period 2022-2032F
- Historical Data and Forecast of Indonesia Sodium Percarbonate Market Revenues & Volume By Bleaching Agent for the Period 2022-2032F
- Historical Data and Forecast of Indonesia Sodium Percarbonate Market Revenues & Volume By Water Treatment for the Period 2022-2032F
- Historical Data and Forecast of Indonesia Sodium Percarbonate Market Revenues & Volume By Others for the Period 2022-2032F
- Historical Data and Forecast of Indonesia Sodium Percarbonate Market Revenues & Volume By End-users for the Period 2022-2032F
- Historical Data and Forecast of Indonesia Sodium Percarbonate Market Revenues & Volume By Household Cleaning for the Period 2022-2032F
- Historical Data and Forecast of Indonesia Sodium Percarbonate Market Revenues & Volume By Laundry for the Period 2022-2032F
- Historical Data and Forecast of Indonesia Sodium Percarbonate Market Revenues & Volume By Industrial Cleaning for the Period 2022-2032F
- Historical Data and Forecast of Indonesia Sodium Percarbonate Market Revenues & Volume By Textile Industry for the Period 2022-2032F
- Historical Data and Forecast of Indonesia Sodium Percarbonate Market Revenues & Volume By Chemical Industry for the Period 2022-2032F
- Historical Data and Forecast of Indonesia Sodium Percarbonate Market Revenues & Volume By Papermaking Industry for the Period 2022-2032F
- Historical Data and Forecast of Indonesia Sodium Percarbonate Market Revenues & Volume By Food Industry for the Period 2022-2032F
- Historical Data and Forecast of Indonesia Sodium Percarbonate Market Revenues & Volume By Others for the Period 2022-2032F
- Indonesia Sodium Percarbonate Import Export Trade Statistics
- Market Opportunity Assessment By Type
- Market Opportunity Assessment By Application
- Market Opportunity Assessment By End-users
- Indonesia Sodium Percarbonate Top Companies Market Share
- Indonesia Sodium Percarbonate Competitive Benchmarking By Technical and Operational Parameters
- Indonesia Sodium Percarbonate Company Profiles
- Indonesia Sodium Percarbonate Key Strategic Recommendations
Indonesia Sodium Percarbonate Market - Frequently Asked Questions
The primary drivers include a heightened consumer demand for safe and eco-friendly cleaning solutions, increased disposable incomes, and a robust shift towards modern cleaning technologies.
The pandemic has significantly increased the focus on hygiene, leading to a surge in demand for disinfectants that utilize sodium percarbonate, solidifying its importance in everyday cleaning practices.
The market is projected to reach USD 349 Million by 2032, following a steady growth trajectory that began with an estimated size of USD 263 Million in 2025.
Yes, there’s a clear trend towards developing biodegradable and ultra-concentrated formulations aimed at enhancing efficacy while reducing environmental impact, catering to eco-conscious consumers.
Government regulations are pivotal in promoting sustainable practices, as they enforce stricter guidelines that encourage manufacturers to adapt their products towards environmentally friendly alternatives.
6Wresearch actively monitors the Indonesia Sodium Percarbonate Market and publishes its comprehensive annual report, highlighting emerging trends, growth drivers, revenue analysis, and forecast outlook. Our insights help businesses to make data-backed strategic decisions with ongoing market dynamics. Our analysts track relevent industries related to the Indonesia Sodium Percarbonate Market, allowing our clients with actionable intelligence and reliable forecasts tailored to emerging regional needs.
Yes, we provide customisation as per your requirements. To learn more, feel free to contact us on sales@6wresearch.com
1 Executive Summary |
2 Introduction |
2.1 Key Highlights of the Report |
2.2 Report Description |
2.3 Market Scope & Segmentation |
2.4 Research Methodology |
2.5 Assumptions |
3 Indonesia Sodium Percarbonate Market Overview |
3.1 Indonesia Country Macro Economic Indicators |
3.2 Indonesia Sodium Percarbonate Market Revenues & Volume, 2022 & 2032F |
3.3 Indonesia Sodium Percarbonate Market - Industry Life Cycle |
3.4 Indonesia Sodium Percarbonate Market - Porter's Five Forces |
3.5 Indonesia Sodium Percarbonate Market Revenues & Volume Share, By Type, 2022 & 2032F |
3.6 Indonesia Sodium Percarbonate Market Revenues & Volume Share, By Application, 2022 & 2032F |
3.7 Indonesia Sodium Percarbonate Market Revenues & Volume Share, By End-users, 2022 & 2032F |
4 Indonesia Sodium Percarbonate Market Dynamics |
4.1 Impact Analysis |
4.2 Market Drivers |
4.2.1 Increasing demand for environmentally friendly and sustainable cleaning products |
4.2.2 Growth in the laundry detergent industry in Indonesia |
4.2.3 Rising awareness about the benefits of sodium percarbonate as a bleach alternative |
4.3 Market Restraints |
4.3.1 Price volatility of raw materials used in the production of sodium percarbonate |
4.3.2 Competition from alternative bleach products |
4.3.3 Lack of awareness or understanding of the benefits of sodium percarbonate among consumers |
5 Indonesia Sodium Percarbonate Market Trends |
6 Indonesia Sodium Percarbonate Market, By Types |
6.1 Indonesia Sodium Percarbonate Market, By Type |
6.1.1 Overview and Analysis |
6.1.2 Indonesia Sodium Percarbonate Market Revenues & Volume, By Type, 2022-2032F |
6.1.3 Indonesia Sodium Percarbonate Market Revenues & Volume, By Coated, 2022-2032F |
6.1.4 Indonesia Sodium Percarbonate Market Revenues & Volume, By Uncoated, 2022-2032F |
6.1.5 Indonesia Sodium Percarbonate Market Revenues & Volume, By Tablet, 2022-2032F |
6.2 Indonesia Sodium Percarbonate Market, By Application |
6.2.1 Overview and Analysis |
6.2.2 Indonesia Sodium Percarbonate Market Revenues & Volume, By Detergent Agent, 2022-2032F |
6.2.3 Indonesia Sodium Percarbonate Market Revenues & Volume, By Cleaning Agent, 2022-2032F |
6.2.4 Indonesia Sodium Percarbonate Market Revenues & Volume, By Bleaching Agent, 2022-2032F |
6.2.5 Indonesia Sodium Percarbonate Market Revenues & Volume, By Water Treatment, 2022-2032F |
6.2.6 Indonesia Sodium Percarbonate Market Revenues & Volume, By Others, 2022-2032F |
6.3 Indonesia Sodium Percarbonate Market, By End-users |
6.3.1 Overview and Analysis |
6.3.2 Indonesia Sodium Percarbonate Market Revenues & Volume, By Household Cleaning, 2022-2032F |
6.3.3 Indonesia Sodium Percarbonate Market Revenues & Volume, By Laundry, 2022-2032F |
6.3.4 Indonesia Sodium Percarbonate Market Revenues & Volume, By Industrial Cleaning, 2022-2032F |
6.3.5 Indonesia Sodium Percarbonate Market Revenues & Volume, By Textile Industry, 2022-2032F |
6.3.6 Indonesia Sodium Percarbonate Market Revenues & Volume, By Chemical Industry, 2022-2032F |
6.3.7 Indonesia Sodium Percarbonate Market Revenues & Volume, By Papermaking Industry, 2022-2032F |
6.3.8 Indonesia Sodium Percarbonate Market Revenues & Volume, By Others, 2022-2032F |
6.3.9 Indonesia Sodium Percarbonate Market Revenues & Volume, By Others, 2022-2032F |
7 Indonesia Sodium Percarbonate Market Import-Export Trade Statistics |
7.1 Indonesia Sodium Percarbonate Market Export to Major Countries |
7.2 Indonesia Sodium Percarbonate Market Imports from Major Countries |
8 Indonesia Sodium Percarbonate Market Key Performance Indicators |
8.1 Adoption rate of eco-friendly cleaning products in Indonesia |
8.2 Percentage growth in the laundry detergent market |
8.3 Number of marketing campaigns promoting sodium percarbonate as a bleach alternative |
9 Indonesia Sodium Percarbonate Market - Opportunity Assessment |
9.1 Indonesia Sodium Percarbonate Market Opportunity Assessment, By Type, 2022 & 2032F |
9.2 Indonesia Sodium Percarbonate Market Opportunity Assessment, By Application, 2022 & 2032F |
9.3 Indonesia Sodium Percarbonate Market Opportunity Assessment, By End-users, 2022 & 2032F |
10 Indonesia Sodium Percarbonate Market - Competitive Landscape |
10.1 Indonesia Sodium Percarbonate Market Revenue Share, By Companies, 2025 |
10.2 Indonesia Sodium Percarbonate Market Competitive Benchmarking, By Operating and Technical Parameters |
11 Company Profiles |
12 Recommendations |
13 Disclaimer |
Global Go To Market Strategy - 2030
Export potential enables firms to identify high-growth global markets with greater confidence by combining advanced trade intelligence with a structured quantitative methodology. The framework analyzes emerging demand trends and country-level import patterns while integrating macroeconomic and trade datasets such as GDP and population forecasts, bilateral import–export flows, tariff structures, elasticity differentials between developed and developing economies, geographic distance, and import demand projections. Using weighted trade values from 2020–2024 as the base period to project country-to-country export potential for 2030, these inputs are operationalized through calculated drivers such as gravity model parameters, tariff impact factors, and projected GDP per-capita growth. Through an analysis of hidden potentials, demand hotspots, and market conditions that are most favorable to success, this method enables firms to focus on target countries, maximize returns, and global expansion with data, backed by accuracy.
By factoring in the projected importer demand gap that is currently unmet and could be potential opportunity, it identifies the potential for the Exporter (Country) among 190 countries, against the general trade analysis, which identifies the biggest importer or exporter.
To discover high-growth global markets and optimize your business strategy:
Click Here
Pricing
- Single User License$ 1,995
- Department License$ 2,400
- Site License$ 3,120
- Global License$ 3,795

Leadership Perspectives from Industry Events
Search
Thought Leadership and Analyst Meet


Our Clients
6WResearch In News
- India Air Conditioner Market Set for Strong Rebound in 2026 After Weather-Led Correction and GST-Driven Recovery: 6Wresearch
- ADAS in India: How Automatic Emergency Braking, Blind Spot Detection & Driver Monitoring are Transforming Road Safety
- Doha a strategic location for EV manufacturing hub: IPA Qatar
- Demand for luxury TVs surging in the GCC, says Samsung
- Empowering Growth: The Thriving Journey of Bangladesh’s Cable Industry
- Demand for luxury TVs surging in the GCC, says Samsung
Latest Reports
- Nicaragua RPG Gaming Market (2026-2032)
- New Zealand RPG Gaming Market (2026-2032)
- Netherlands RPG Gaming Market (2026-2032)
- Nauru RPG Gaming Market (2026-2032)
- Namibia RPG Gaming Market (2026-2032)
- Mozambique RPG Gaming Market (2026-2032)
- Montenegro RPG Gaming Market (2026-2032)
- Mongolia RPG Gaming Market (2026-2032)
- Monaco RPG Gaming Market (2026-2032)
- Micronesia RPG Gaming Market (2026-2032)
Industry Events and Analyst Meet

HIMTEX 2026

India Refining Summit 2026

India EV Show 2026

EV tech India Expo 2026

Auto Tech Asia 2026
Whitepaper
- Middle East & Africa Commercial Security Market Click here to view more.
- Middle East & Africa Fire Safety Systems & Equipment Market Click here to view more.
- GCC Drone Market Click here to view more.
- Middle East Lighting Fixture Market Click here to view more.
- GCC Physical & Perimeter Security Market Click here to view more.