Indonesia Sodium Permanganate Market (2026-2032) Outlook | Companies, Growth, Trends, Size, Value, Forecast, Revenue, Share, Industry & Analysis
Market Forecast By Types (Sodium Permanganate 40%, Sodium Permanganate 20%), By Applications (Water Treatment, Electronics, Fine Chemicals and Pharmaceuticals) And Competitive Landscape
| Product Code: ETC194980 | Publication Date: Jul 2023 | Updated Date: Jun 2026 | Product Type: Market Research Report | |
| Publisher: 6Wresearch | Author: Ravi Bhandari | No. of Pages: 60 | No. of Figures: 40 | No. of Tables: 7 |
Indonesia Sodium Permanganate Market Size, Share & Growth Rate
The Indonesia Sodium Permanganate Market was estimated at USD 387 Million in 2025 and is projected to reach USD 516 Million by 2032, growing at a CAGR of 4.2% from 2026 to 2032. This growth trajectory is primarily fueled by the increasing demand across diverse applications, particularly in water treatment and environmental management sectors. Additionally, investments in expanding production capacity are further enhancing the market's potential as local and international consumption rises.
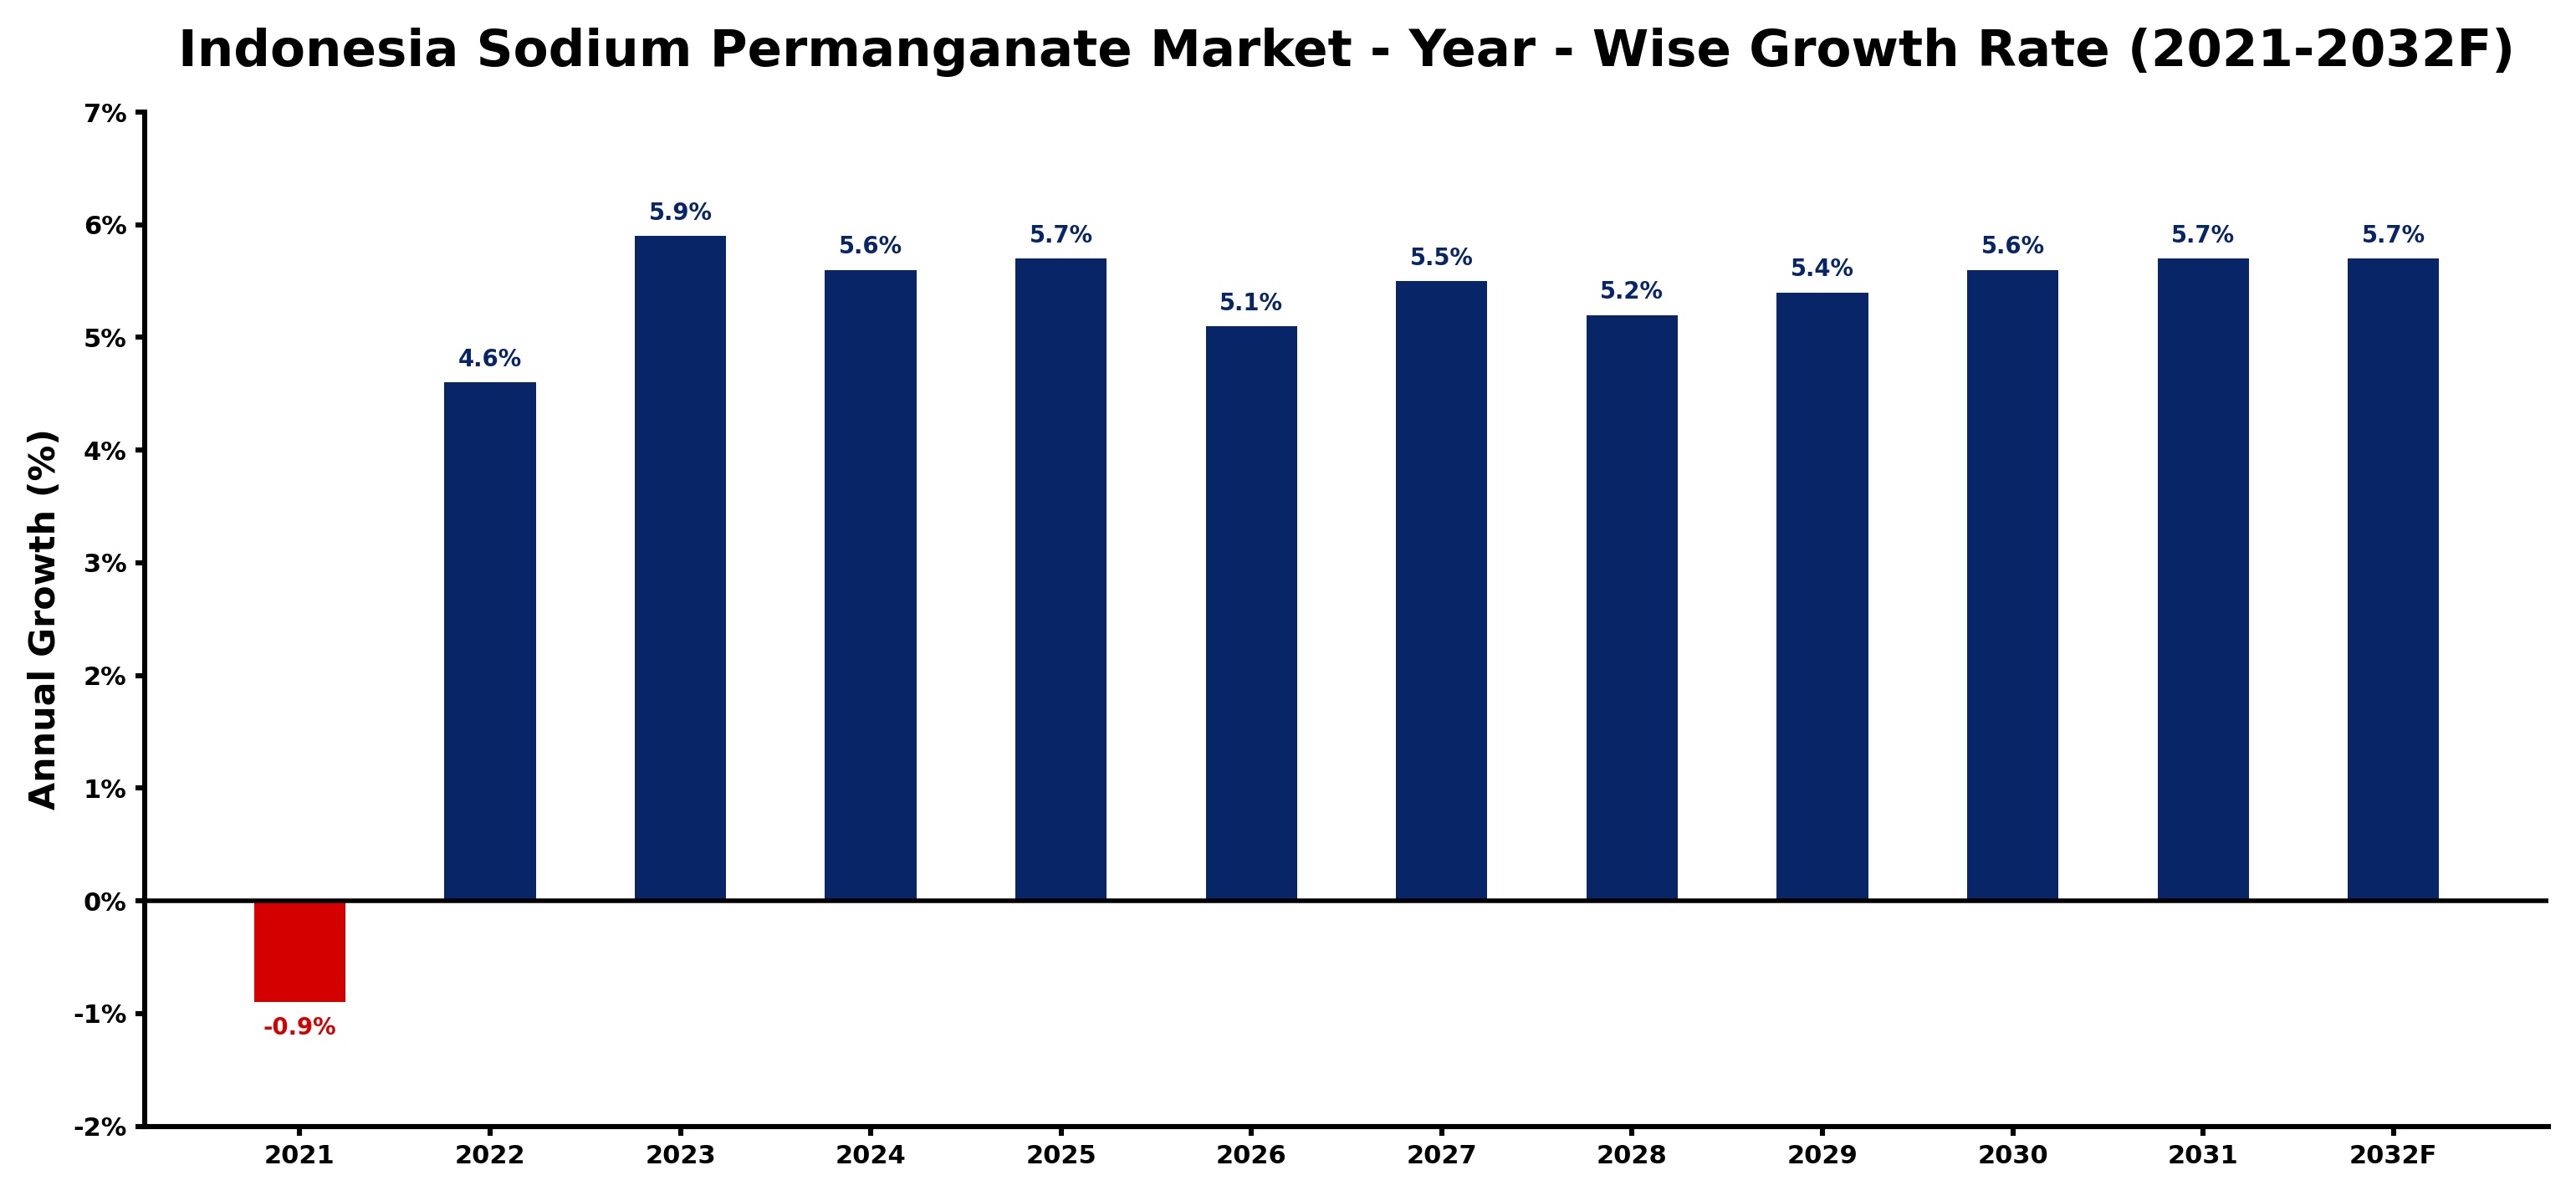
Indonesia Sodium Permanganate Market Growth Rate Analysis (2021-2032)
The sodium permanganate market in Indonesia has shown a promising recovery following a slight decline of 0.9% in 2021. Growth surged to 4.6% in 2022, driven by increased demand from the water treatment and pharmaceutical sectors. The upward trend continued in 2023, with a notable rise of 5.9%, fueled by investments in infrastructure and a shift towards sustainable practices amid Indonesia’s energy transition efforts. Projections indicate steady growth, with estimates suggesting a 5.6% increase in 2024 and maintaining similar growth rates over the following years. This sustained demand reflects enhanced consumer awareness and industrial applications, emphasizing sodium permanganate's critical role in environmental and health-related solutions.
Indonesia Sodium Permanganate Market Year-wise Growth Rate and Key Drivers
This graph highlights how the Indonesia Sodium Permanganate Market has steadily grown over the past five years, supported by major growth factors.
The table below presents the year‑wise growth rates along with the key drivers influencing the market
| Year | Growth Rate | Major Drivers |
| 2021 | -0.9% | Supply chain disruptions impacted availability |
| 2022 | 4.6% | Industrial applications drove demand growth |
| 2023 | 5.9% | Environmental regulations increased usage |
| 2024 | 5.6% | Water treatment sector expanded significantly |
| 2025 | 5.7% | Agricultural applications gained traction |
| 2026 | 5.1% | Chemical manufacturing growth accelerated demand |
| 2027 | 5.5% | Healthcare sector adoption increased usage |
| 2028 | 5.2% | Mining industry demand surged upward |
| 2029 | 5.4% | Research and development investments rose |
| 2030 | 5.6% | Export opportunities enhanced market reach |
| 2031 | 5.7% | Sustainability initiatives boosted consumption |
| 2032 | 5.7% | Technological advancements improved efficiency |
Note - Market size estimations and growth projections presented in this report are based on 6Wresearch’s advanced forecasting approach, validated with industry datasets as of June 2026.
Indonesia Sodium Permanganate Market Synopsis
Indonesia stands as the third-largest producer of sodium permanganate in Asia, showcasing a robust network of chemical manufacturers dedicated to producing and exporting this vital industrial chemical. Its diverse applications—from wastewater treatment to bleaching processes—underscore its significance in various industrial domains.
The market is witnessing consistent growth, propelled by government initiatives aimed at bolstering environmental protection. As industries shift towards sustainable practices, sodium permanganate's role as an oxidizing agent is becoming increasingly integral in sectors such as power generation, textiles, and metal finishing.
Indonesia Sodium Permanganate Market Key Takeaways
- Robust growth forecasted in the market driven by rising industrial demand and environmental regulations.
- Government initiatives promoting sustainability further boost sodium permanganate applications.
- Investment in new production facilities aligns with both local and international market needs.
- Availability of cost-effective raw materials enhances the competitive edge for manufacturers.
- COVID-19 has impacted market dynamics but recovery trends are emerging as operational normalcy resumes.
Evaluation of Restraints in Indonesia Sodium Permanganate Market
While the Indonesia sodium permanganate market is positioned for growth, several factors are tempering its potential. The high costs associated with research and development for new formulations can deter investment. Moreover, stringent government regulations regarding chemical safety add layers of compliance that manufacturers must navigate. Additionally, the presence of substitutes like chlorine dioxide introduces competitive pressures that may impact pricing and market share.
Indonesia Sodium Permanganate Market Trends
Emerging trends in the Indonesia sodium permanganate market highlight a shift towards eco-friendly applications. Industries are increasingly recognizing the importance of sustainable practices, leading to heightened demand for sodium permanganate in water treatment processes. Furthermore, technological advancements in production are streamlining manufacturing, thereby enhancing efficiency and reducing costs. The focus on automation and innovation is reshaping how producers meet the rising needs of their clients.
Indonesia Sodium Permanganate Market Opportunities
Genuine growth opportunities abound in Indonesia's sodium permanganate market, particularly in the burgeoning sectors of waste management and renewable energy. As urbanization escalates, the need for effective water treatment solutions becomes paramount, creating fertile ground for sodium permanganate usage. Additionally, expansion into international markets can provide a significant boost, especially given Indonesia's favorable position as a regional production hub.
Government Initiatives in the Indonesia Sodium Permanganate Market
The Indonesian government is actively promoting policies aimed at enhancing environmental protection and sustainability, impacting the sodium permanganate market positively. Initiatives such as funding for water treatment infrastructure and regulations encouraging the use of green chemicals reflect a commitment to fostering an environmentally sustainable industry landscape. Such policies provide a conducive environment for growth and innovation in the sodium permanganate sector.
Future Insights of the Indonesia Sodium Permanganate Market
Looking ahead, the Indonesia sodium permanganate market is anticipated to evolve significantly between 2026 and 2032. As manufacturers ramp up production capabilities and diversify application ranges, a broader acceptance of sodium permanganate in emerging sectors is expected. The alignment of industrial strategies with environmental objectives will further catalyze market growth, offering a unique blend of sustainability and profitability.
Indonesia Sodium Permanganate Market Latest Developments (May 2025 - June 2026)
Recent developments within the Indonesian sodium permanganate market indicate a shift towards increased production capacity. Companies are investing in state-of-the-art facilities that leverage advanced technologies to enhance production efficiency. Additionally, partnerships focused on R&D are emerging, aiming to refine existing products and explore new applications, signaling a proactive approach in meeting market demands.
Indonesia Sodium Permanganate Market - Key Attractiveness of the Report
- 10 Years of Market Numbers
- Historical Data Starting from 2022 to 2025
- Base Year: 2025
- Forecast Data until 2032
- Key Performance Indicators Impacting the Market
- Major Upcoming Developments and Projects
Key Highlights of the Report:
- Indonesia Sodium Permanganate Market Outlook
- Market Size of Indonesia Sodium Permanganate Market, 2025
- Forecast of Indonesia Sodium Permanganate Market, 2032
- Historical Data and Forecast of Indonesia Sodium Permanganate Revenues & Volume for the Period 2022-2032F
- Indonesia Sodium Permanganate Market Trend Evolution
- Indonesia Sodium Permanganate Market Drivers and Challenges
- Indonesia Sodium Permanganate Price Trends
- Indonesia Sodium Permanganate Porter's Five Forces
- Indonesia Sodium Permanganate Industry Life Cycle
- Historical Data and Forecast of Indonesia Sodium Permanganate Market Revenues & Volume By Types for the Period 2022-2032F
- Historical Data and Forecast of Indonesia Sodium Permanganate Market Revenues & Volume By Sodium Permanganate 40% for the Period 2022-2032F
- Historical Data and Forecast of Indonesia Sodium Permanganate Market Revenues & Volume By Sodium Permanganate 20% for the Period 2022-2032F
- Historical Data and Forecast of Indonesia Sodium Permanganate Market Revenues & Volume By Applications for the Period 2022-2032F
- Historical Data and Forecast of Indonesia Sodium Permanganate Market Revenues & Volume By Water Treatment for the Period 2022-2032F
- Historical Data and Forecast of Indonesia Sodium Permanganate Market Revenues & Volume By Electronics for the Period 2022-2032F
- Historical Data and Forecast of Indonesia Sodium Permanganate Market Revenues & Volume By Fine Chemicals and Pharmaceuticals for the Period 2022-2032F
- Indonesia Sodium Permanganate Import Export Trade Statistics
- Market Opportunity Assessment By Types
- Market Opportunity Assessment By Applications
- Indonesia Sodium Permanganate Top Companies Market Share
- Indonesia Sodium Permanganate Competitive Benchmarking By Technical and Operational Parameters
- Indonesia Sodium Permanganate Company Profiles
- Indonesia Sodium Permanganate Key Strategic Recommendations
Indonesia Sodium Permanganate Market - Frequently Asked Questions
The market was estimated at USD 387 Million in 2025 and is projected to grow to USD 516 Million by 2032, reflecting a CAGR of 4.2% during the period.
Stricter environmental regulations are leading to increased demand for sodium permanganate as industries seek more effective and sustainable solutions for water treatment and waste management.
Sodium permanganate is predominantly utilized in water and wastewater treatment, pulp and paper bleaching, leather tanning, and textile processing, underscoring its versatility across industries.
Manufacturers are confronted with high R&D costs, stringent regulations, and competition from substitutes like chlorine dioxide, which can hinder market growth.
Opportunities lie in expanding applications in emerging sectors such as renewable energy and advanced water treatment solutions, which are critical to urban development and sustainability goals.
6Wresearch actively monitors the Indonesia Sodium Permanganate Market and publishes its comprehensive annual report, highlighting emerging trends, growth drivers, revenue analysis, and forecast outlook. Our insights help businesses to make data-backed strategic decisions with ongoing market dynamics. Our analysts track relevent industries related to the Indonesia Sodium Permanganate Market, allowing our clients with actionable intelligence and reliable forecasts tailored to emerging regional needs.
Yes, we provide customisation as per your requirements. To learn more, feel free to contact us on sales@6wresearch.com
1 Executive Summary |
2 Introduction |
2.1 Key Highlights of the Report |
2.2 Report Description |
2.3 Market Scope & Segmentation |
2.4 Research Methodology |
2.5 Assumptions |
3 Indonesia Sodium Permanganate Market Overview |
3.1 Indonesia Country Macro Economic Indicators |
3.2 Indonesia Sodium Permanganate Market Revenues & Volume, 2022 & 2032F |
3.3 Indonesia Sodium Permanganate Market - Industry Life Cycle |
3.4 Indonesia Sodium Permanganate Market - Porter's Five Forces |
3.5 Indonesia Sodium Permanganate Market Revenues & Volume Share, By Types, 2022 & 2032F |
3.6 Indonesia Sodium Permanganate Market Revenues & Volume Share, By Applications, 2022 & 2032F |
4 Indonesia Sodium Permanganate Market Dynamics |
4.1 Impact Analysis |
4.2 Market Drivers |
4.2.1 Increasing demand for water treatment solutions in Indonesia |
4.2.2 Growing emphasis on environmental sustainability and water quality |
4.2.3 Rising awareness about the importance of wastewater treatment in industries |
4.3 Market Restraints |
4.3.1 Fluctuating raw material prices impacting production costs |
4.3.2 Stringent government regulations and compliance requirements |
4.3.3 Competition from alternative water treatment chemicals |
5 Indonesia Sodium Permanganate Market Trends |
6 Indonesia Sodium Permanganate Market, By Types |
6.1 Indonesia Sodium Permanganate Market, By Types |
6.1.1 Overview and Analysis |
6.1.2 Indonesia Sodium Permanganate Market Revenues & Volume, By Types, 2022-2032F |
6.1.3 Indonesia Sodium Permanganate Market Revenues & Volume, By Sodium Permanganate 40%, 2022-2032F |
6.1.4 Indonesia Sodium Permanganate Market Revenues & Volume, By Sodium Permanganate 20%, 2022-2032F |
6.2 Indonesia Sodium Permanganate Market, By Applications |
6.2.1 Overview and Analysis |
6.2.2 Indonesia Sodium Permanganate Market Revenues & Volume, By Water Treatment, 2022-2032F |
6.2.3 Indonesia Sodium Permanganate Market Revenues & Volume, By Electronics, 2022-2032F |
6.2.4 Indonesia Sodium Permanganate Market Revenues & Volume, By Fine Chemicals and Pharmaceuticals, 2022-2032F |
7 Indonesia Sodium Permanganate Market Import-Export Trade Statistics |
7.1 Indonesia Sodium Permanganate Market Export to Major Countries |
7.2 Indonesia Sodium Permanganate Market Imports from Major Countries |
8 Indonesia Sodium Permanganate Market Key Performance Indicators |
8.1 Percentage of industrial facilities in Indonesia using sodium permanganate for water treatment |
8.2 Growth rate of the water treatment industry in Indonesia |
8.3 Number of new wastewater treatment projects utilizing sodium permanganate technology |
8.4 Environmental impact assessments related to the use of sodium permanganate in water treatment |
8.5 Research and development investments in improving sodium permanganate formulations for enhanced water treatment efficiency |
9 Indonesia Sodium Permanganate Market - Opportunity Assessment |
9.1 Indonesia Sodium Permanganate Market Opportunity Assessment, By Types, 2022 & 2032F |
9.2 Indonesia Sodium Permanganate Market Opportunity Assessment, By Applications, 2022 & 2032F |
10 Indonesia Sodium Permanganate Market - Competitive Landscape |
10.1 Indonesia Sodium Permanganate Market Revenue Share, By Companies, 2025 |
10.2 Indonesia Sodium Permanganate Market Competitive Benchmarking, By Operating and Technical Parameters |
11 Company Profiles |
12 Recommendations |
13 Disclaimer |
Global Go To Market Strategy - 2030
Export potential enables firms to identify high-growth global markets with greater confidence by combining advanced trade intelligence with a structured quantitative methodology. The framework analyzes emerging demand trends and country-level import patterns while integrating macroeconomic and trade datasets such as GDP and population forecasts, bilateral import–export flows, tariff structures, elasticity differentials between developed and developing economies, geographic distance, and import demand projections. Using weighted trade values from 2020–2024 as the base period to project country-to-country export potential for 2030, these inputs are operationalized through calculated drivers such as gravity model parameters, tariff impact factors, and projected GDP per-capita growth. Through an analysis of hidden potentials, demand hotspots, and market conditions that are most favorable to success, this method enables firms to focus on target countries, maximize returns, and global expansion with data, backed by accuracy.
By factoring in the projected importer demand gap that is currently unmet and could be potential opportunity, it identifies the potential for the Exporter (Country) among 190 countries, against the general trade analysis, which identifies the biggest importer or exporter.
To discover high-growth global markets and optimize your business strategy:
Click Here
Pricing
- Single User License$ 1,995
- Department License$ 2,400
- Site License$ 3,120
- Global License$ 3,795

Leadership Perspectives from Industry Events
Search
Thought Leadership and Analyst Meet


Our Clients
6WResearch In News
- India Air Conditioner Market Set for Strong Rebound in 2026 After Weather-Led Correction and GST-Driven Recovery: 6Wresearch
- ADAS in India: How Automatic Emergency Braking, Blind Spot Detection & Driver Monitoring are Transforming Road Safety
- Doha a strategic location for EV manufacturing hub: IPA Qatar
- Demand for luxury TVs surging in the GCC, says Samsung
- Empowering Growth: The Thriving Journey of Bangladesh’s Cable Industry
- Demand for luxury TVs surging in the GCC, says Samsung
Latest Reports
- Nicaragua RPG Gaming Market (2026-2032)
- New Zealand RPG Gaming Market (2026-2032)
- Netherlands RPG Gaming Market (2026-2032)
- Nauru RPG Gaming Market (2026-2032)
- Namibia RPG Gaming Market (2026-2032)
- Mozambique RPG Gaming Market (2026-2032)
- Montenegro RPG Gaming Market (2026-2032)
- Mongolia RPG Gaming Market (2026-2032)
- Monaco RPG Gaming Market (2026-2032)
- Micronesia RPG Gaming Market (2026-2032)
Industry Events and Analyst Meet

HIMTEX 2026

India Refining Summit 2026

India EV Show 2026

EV tech India Expo 2026

Auto Tech Asia 2026
Whitepaper
- Middle East & Africa Commercial Security Market Click here to view more.
- Middle East & Africa Fire Safety Systems & Equipment Market Click here to view more.
- GCC Drone Market Click here to view more.
- Middle East Lighting Fixture Market Click here to view more.
- GCC Physical & Perimeter Security Market Click here to view more.