Indonesia Solenoid Valve Market (2026-2032) Outlook | Companies, Forecast, Growth, Value, Industry, Share, Revenue, Trends, Size & Analysis
Market Forecast By Body Material (Stainless Steel, Brass, Aluminium, Plastic), By Valve Design Type (2-way, 3-way, 4-way, 5-way), By Industry (Oil & Gas, Chemical & Petrochemical, Water & Wastewater, Food & Beverages, Power Generation, Pharmaceuticals, Automotive, Others) And Competitive Landscape
| Product Code: ETC129252 | Publication Date: Jul 2023 | Updated Date: Jun 2026 | Product Type: Report | |
| Publisher: 6Wresearch | Author: Ravi Bhandari | No. of Pages: 70 | No. of Figures: 35 | No. of Tables: 5 |
Indonesia Solenoid Valve Market Size, Share & Growth Rate
The Indonesia Solenoid Valve Market was estimated at USD 293 Million in 2025 and is projected to reach USD 388 Million by 2032, growing at a CAGR of 4.1% from 2026 to 2032. This positive growth trajectory can be attributed to several key factors. Increasing government investments in the oil & gas sector, along with a surge in industrial production activities, are fueling demand for solenoid valves. Moreover, the rising emphasis on safety systems across various industries further enhances market prospects.
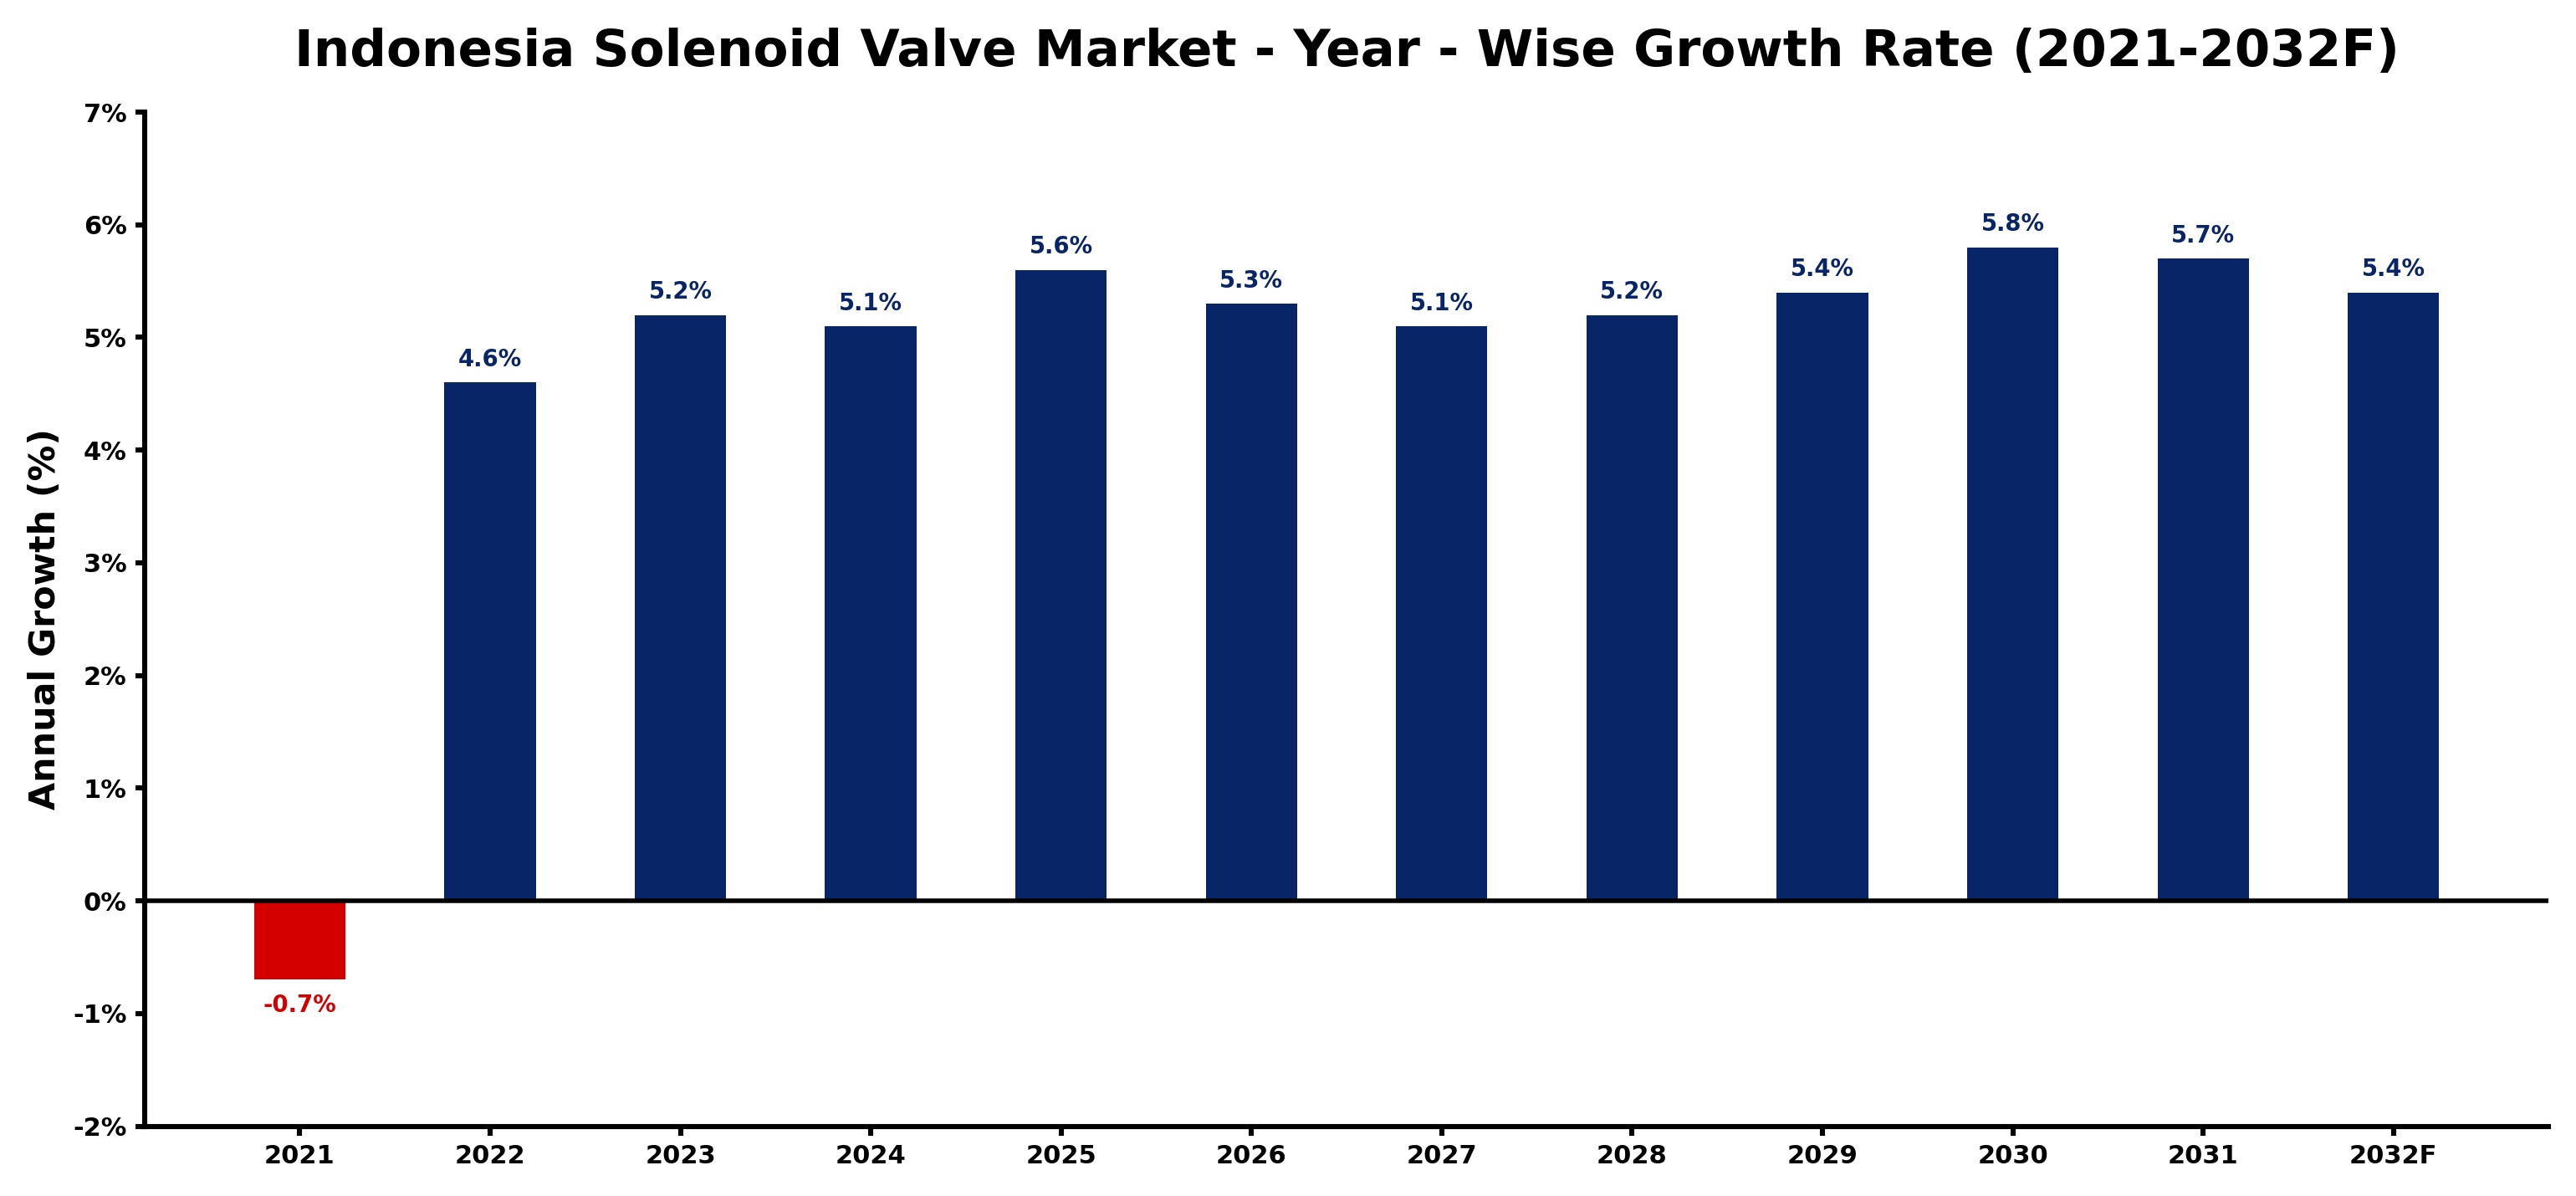
Indonesia Solenoid Valve Market Growth Rate Analysis (2021-2032)
The solenoid valve market in Indonesia has shown a notable recovery after experiencing a slight contraction of -0.7% in 2021. This rebound became evident with a growth of 4.6% in 2022, driven largely by rising consumer demand and increased investments in infrastructure projects. The upward trend continued, with expansions of 5.2% in 2023 and projected growth rates between 5.1% and 5.8% through 2032. The growth can be attributed to advancements in technology and a shift towards energy-efficient solutions, as industries increasingly prioritize automation and digitalization in their operations. Overall, the market reflects a robust commitment to modernization, underpinning its sustained growth amid evolving industrial needs.
Indonesia Solenoid Valve Market Year-wise Growth Rate and Key Drivers
This graph highlights how the Indonesia Solenoid Valve Market has steadily grown over the past five years, supported by major growth factors.
The table below presents the year‑wise growth rates along with the key drivers influencing the market
| Year | Growth Rate | Major Drivers |
| 2021 | -0.7% | Increasing industrial infrastructure investments |
| 2022 | 4.6% | Increasing industrial infrastructure investments |
| 2023 | 5.2% | Expansion of manufacturing activities |
| 2024 | 5.1% | Increasing industrial automation investments |
| 2025 | 5.6% | Government infrastructure modernization initiatives |
| 2026 | 5.3% | Expansion of manufacturing activities |
| 2027 | 5.1% | Expansion of commercial construction activities |
| 2028 | 5.2% | Growing urbanization and commercial development |
| 2029 | 5.4% | Expansion of commercial construction activities |
| 2030 | 5.8% | Increasing industrial infrastructure investments |
| 2031 | 5.7% | Increasing smart city development projects |
| 2032 | 5.4% | Growing urbanization and commercial development |
Note - Market size estimations and growth projections presented in this report are based on 6Wresearch’s advanced forecasting approach, validated with industry datasets as of June 2026.
Indonesia Solenoid Valve Market Synopsis
Currently, the Indonesia Solenoid Valve Market is witnessing a surge in demand due to its pivotal role in crucial sectors like Oil & Gas, Pharmaceuticals, and Chemical Industries. The versatility and reliability of solenoid valves make them essential in these applications, ensuring efficient operation and safety.
Market players are increasingly focusing on technological innovations, such as the miniaturization of solenoid valves and the integration of automation solutions. These advancements are expected to create ample opportunities for manufacturers, helping them meet the diverse needs of industrial clients in Indonesia.
Indonesia Solenoid Valve Market Key Takeaways
- Steady growth expected driven by increased investments in the oil & gas sector.
- Significant opportunities from advancements in technology and automation solutions.
- Diverse application areas spanning critical industries including pharmaceuticals and chemicals.
- Heightened emphasis on safety measures in industrial operations propelling market demand.
- Regional industrial production activities are on the rise, further bolstering market expansion.
Evaluation of Restraints in Indonesia Solenoid Valve Market
Despite the positive outlook, the Indonesia Solenoid Valve Market does face certain restraints. One major limiting factor is the dependency on global economic conditions, particularly in the oil & gas sector, which can lead to fluctuations in demand. Additionally, issues related to supply chain disruptions and the availability of raw materials can hinder production capacities. Furthermore, the lack of awareness regarding advanced solenoid valve technologies among smaller enterprises may also restrict market penetration.
Indonesia Solenoid Valve Market Trends
Several trends are shaping the landscape of the Indonesia Solenoid Valve Market. Firstly, there is a noticeable shift towards the development of smart solenoid valves that integrate with IoT (Internet of Things) systems for improved monitoring and control. Additionally, the demand for energy-efficient products is gaining traction, as industries seek to reduce operational costs and carbon footprints. Furthermore, the trend of digitalization within the manufacturing sector is leading to increased automation, which necessitates more sophisticated solenoid valve solutions.
Indonesia Solenoid Valve Market Opportunities
Opportunities in the Indonesia Solenoid Valve Market are abundant, particularly as the government continues to prioritize infrastructure development and industrial expansion. Investments in renewable energy projects are also expected to create a new segment for solenoid valves. Furthermore, rising health and safety standards across various industries will drive demand for reliable and efficient solenoid valves, allowing manufacturers to innovate and diversify their offerings to meet specific market needs.
Government Initiatives in the Indonesia Solenoid Valve Market
The Indonesian government is actively promoting investment in the oil & gas sector, implementing policies aimed at enhancing production capacities and infrastructure development. Additionally, initiatives focused on improving industrial safety standards and supporting technological advancements provide a favorable environment for the growth of the solenoid valve market. These policies are expected to encourage local production and foster partnerships between government and private sector players.
Future Insights of the Indonesia Solenoid Valve Market
Looking ahead to the period from 2026 to 2032, the Indonesia Solenoid Valve Market is poised for substantial growth. As industries increasingly recognize the importance of safety and efficiency, the adoption of advanced solenoid valve technologies will likely become the norm. Moreover, government support for infrastructural improvements and industrial expansion will continue to fuel market demand, establishing Indonesia as a vital player in the regional solenoid valve landscape.
Indonesia Solenoid Valve Market Latest Developments (May 2025 - June 2026)
Recent developments within the Indonesia Solenoid Valve Market indicate a strong focus on innovation and sustainability. Companies are increasingly investing in R&D to develop energy-efficient and automated solutions tailored to specific industry needs. Furthermore, collaborations among key stakeholders are being forged to enhance product offerings and improve supply chain efficiencies, ensuring competitiveness in an evolving market.
Indonesia Solenoid Valve Market - Key Attractiveness of the Report
- 10 Years of Market Numbers
- Historical Data Starting from 2022 to 2025
- Base Year: 2025
- Forecast Data until 2032
- Key Performance Indicators Impacting the Market
- Major Upcoming Developments and Projects
Key Highlights of the Report:
- Indonesia Solenoid Valve Market Outlook
- Market Size of Indonesia Solenoid Valve Market, 2025
- Forecast of Indonesia Solenoid Valve Market, 2032F
- Historical Data and Forecast of Indonesia Solenoid Valve Revenues & Volume for the Period 2022-2032F
- Indonesia Solenoid Valve Market Trend Evolution
- Indonesia Solenoid Valve Market Drivers and Challenges
- Indonesia Solenoid Valve Price Trends
- Indonesia Solenoid Valve Porter's Five Forces
- Indonesia Solenoid Valve Industry Life Cycle
- Historical Data and Forecast of Indonesia Solenoid Valve Market Revenues & Volume By Body Material for the Period 2022-2032F
- Historical Data and Forecast of Indonesia Solenoid Valve Market Revenues & Volume By Stainless Steel for the Period 2022-2032F
- Historical Data and Forecast of Indonesia Solenoid Valve Market Revenues & Volume By Brass for the Period 2022-2032F
- Historical Data and Forecast of Indonesia Solenoid Valve Market Revenues & Volume By Aluminium for the Period 2022-2032F
- Historical Data and Forecast of Indonesia Solenoid Valve Market Revenues & Volume By Plastic for the Period 2022-2032F
- Historical Data and Forecast of Indonesia Solenoid Valve Market Revenues & Volume By Valve Design Type for the Period 2022-2032F
- Historical Data and Forecast of Indonesia Solenoid Valve Market Revenues & Volume By 2-way for the Period 2022-2032F
- Historical Data and Forecast of Indonesia Solenoid Valve Market Revenues & Volume By 3-way for the Period 2022-2032F
- Historical Data and Forecast of Indonesia Solenoid Valve Market Revenues & Volume By 4-way for the Period 2022-2032F
- Historical Data and Forecast of Indonesia Solenoid Valve Market Revenues & Volume By 5-way for the Period 2022-2032F
- Historical Data and Forecast of Indonesia Solenoid Valve Market Revenues & Volume By Industry for the Period 2022-2032F
- Historical Data and Forecast of Indonesia Solenoid Valve Market Revenues & Volume By Oil & Gas for the Period 2022-2032F
- Historical Data and Forecast of Indonesia Solenoid Valve Market Revenues & Volume By Chemical & Petrochemical for the Period 2022-2032F
- Historical Data and Forecast of Indonesia Solenoid Valve Market Revenues & Volume By Water & Wastewater for the Period 2022-2032F
- Historical Data and Forecast of Indonesia Solenoid Valve Market Revenues & Volume By Food & Beverages for the Period 2022-2032F
- Historical Data and Forecast of Indonesia Solenoid Valve Market Revenues & Volume By Power Generation for the Period 2022-2032F
- Historical Data and Forecast of Indonesia Solenoid Valve Market Revenues & Volume By Pharmaceuticals for the Period 2022-2032F
- Historical Data and Forecast of Indonesia Solenoid Valve Market Revenues & Volume By Automotive for the Period 2022-2032F
- Historical Data and Forecast of Indonesia Solenoid Valve Market Revenues & Volume By Others for the Period 2022-2032F
- Indonesia Solenoid Valve Import Export Trade Statistics
- Market Opportunity Assessment By Body Material
- Market Opportunity Assessment By Valve Design Type
- Market Opportunity Assessment By Industry
- Indonesia Solenoid Valve Top Companies Market Share
- Indonesia Solenoid Valve Competitive Benchmarking By Technical and Operational Parameters
- Indonesia Solenoid Valve Company Profiles
- Indonesia Solenoid Valve Key Strategic Recommendations
Indonesia Solenoid Valve Market - Frequently Asked Questions
The Indonesia Solenoid Valve Market was estimated at USD 293 Million in 2025 and is projected to reach USD 388 Million by 2032, growing at a CAGR of 4.1% from 2026 to 2032.
Key sectors include Oil & Gas, Pharmaceuticals, and Chemical Industries, where solenoid valves are critical for operational efficiency and safety.
Innovations such as miniaturization and integration with automation solutions are expected to create new growth opportunities for manufacturers, enhancing product performance.
Government initiatives aimed at boosting investments in the oil & gas sector and improving industrial safety standards provide a supportive environment for market growth.
The market is expected to see a shift toward smart solenoid valves that utilize IoT for enhanced control, alongside a rising demand for energy-efficient solutions.
Manufacturers may encounter challenges related to supply chain disruptions and fluctuating demand influenced by global economic conditions, particularly in the oil & gas sector.
6Wresearch actively monitors the Indonesia Solenoid Valve Market and publishes its comprehensive annual report, highlighting emerging trends, growth drivers, revenue analysis, and forecast outlook. Our insights help businesses to make data-backed strategic decisions with ongoing market dynamics. Our analysts track relevent industries related to the Indonesia Solenoid Valve Market, allowing our clients with actionable intelligence and reliable forecasts tailored to emerging regional needs.
Yes, we provide customisation as per your requirements. To learn more, feel free to contact us on sales@6wresearch.com
Indonesia Solenoid Valve |
1 Executive Summary |
2 Introduction |
2.1 Key Highlights of the Report |
2.2 Report Description |
2.3 Market Scope & Segmentation |
2.4 Research Methodology |
2.5 Assumptions |
3 Indonesia Solenoid Valve Market Overview |
3.1 Indonesia Country Macro Economic Indicators |
3.2 Indonesia Solenoid Valve Market Revenues & Volume, 2022 & 2032F |
3.3 Indonesia Solenoid Valve Market - Industry Life Cycle |
3.4 Indonesia Solenoid Valve Market - Porter's Five Forces |
3.5 Indonesia Solenoid Valve Market Revenues & Volume Share, By Body Material, 2022 & 2032F |
3.6 Indonesia Solenoid Valve Market Revenues & Volume Share, By Valve Design Type, 2022 & 2032F |
3.7 Indonesia Solenoid Valve Market Revenues & Volume Share, By Industry, 2022 & 2032F |
4 Indonesia Solenoid Valve Market Dynamics |
4.1 Impact Analysis |
4.2 Market Drivers |
4.3 Market Restraints |
5 Indonesia Solenoid Valve Market Trends |
6 Indonesia Solenoid Valve Market, By Types |
6.1 Indonesia Solenoid Valve Market, By Body Material |
6.1.1 Overview and Analysis |
6.1.2 Indonesia Solenoid Valve Market Revenues & Volume, By Body Material, 2022-2032F |
6.1.3 Indonesia Solenoid Valve Market Revenues & Volume, By Stainless Steel, 2022-2032F |
6.1.4 Indonesia Solenoid Valve Market Revenues & Volume, By Brass, 2022-2032F |
6.1.5 Indonesia Solenoid Valve Market Revenues & Volume, By Aluminium, 2022-2032F |
6.1.6 Indonesia Solenoid Valve Market Revenues & Volume, By Plastic, 2022-2032F |
6.2 Indonesia Solenoid Valve Market, By Valve Design Type |
6.2.1 Overview and Analysis |
6.2.2 Indonesia Solenoid Valve Market Revenues & Volume, By 2-way, 2022-2032F |
6.2.3 Indonesia Solenoid Valve Market Revenues & Volume, By 3-way, 2022-2032F |
6.2.4 Indonesia Solenoid Valve Market Revenues & Volume, By 4-way, 2022-2032F |
6.2.5 Indonesia Solenoid Valve Market Revenues & Volume, By 5-way, 2022-2032F |
6.3 Indonesia Solenoid Valve Market, By Industry |
6.3.1 Overview and Analysis |
6.3.2 Indonesia Solenoid Valve Market Revenues & Volume, By Oil & Gas, 2022-2032F |
6.3.3 Indonesia Solenoid Valve Market Revenues & Volume, By Chemical & Petrochemical, 2022-2032F |
6.3.4 Indonesia Solenoid Valve Market Revenues & Volume, By Water & Wastewater, 2022-2032F |
6.3.5 Indonesia Solenoid Valve Market Revenues & Volume, By Food & Beverages, 2022-2032F |
6.3.6 Indonesia Solenoid Valve Market Revenues & Volume, By Power Generation, 2022-2032F |
6.3.7 Indonesia Solenoid Valve Market Revenues & Volume, By Pharmaceuticals, 2022-2032F |
6.3.8 Indonesia Solenoid Valve Market Revenues & Volume, By Others, 2022-2032F |
6.3.9 Indonesia Solenoid Valve Market Revenues & Volume, By Others, 2022-2032F |
7 Indonesia Solenoid Valve Market Import-Export Trade Statistics |
7.1 Indonesia Solenoid Valve Market Export to Major Countries |
7.2 Indonesia Solenoid Valve Market Imports from Major Countries |
8 Indonesia Solenoid Valve Market Key Performance Indicators |
9 Indonesia Solenoid Valve Market - Opportunity Assessment |
9.1 Indonesia Solenoid Valve Market Opportunity Assessment, By Body Material, 2022 & 2032F |
9.2 Indonesia Solenoid Valve Market Opportunity Assessment, By Valve Design Type, 2022 & 2032F |
9.3 Indonesia Solenoid Valve Market Opportunity Assessment, By Industry, 2022 & 2032F |
10 Indonesia Solenoid Valve Market - Competitive Landscape |
10.1 Indonesia Solenoid Valve Market Revenue Share, By Companies, 2025 |
10.2 Indonesia Solenoid Valve Market Competitive Benchmarking, By Operating and Technical Parameters |
11 Company Profiles |
12 Recommendations |
13 Disclaimer |
Global Go To Market Strategy - 2030
Export potential enables firms to identify high-growth global markets with greater confidence by combining advanced trade intelligence with a structured quantitative methodology. The framework analyzes emerging demand trends and country-level import patterns while integrating macroeconomic and trade datasets such as GDP and population forecasts, bilateral import–export flows, tariff structures, elasticity differentials between developed and developing economies, geographic distance, and import demand projections. Using weighted trade values from 2020–2024 as the base period to project country-to-country export potential for 2030, these inputs are operationalized through calculated drivers such as gravity model parameters, tariff impact factors, and projected GDP per-capita growth. Through an analysis of hidden potentials, demand hotspots, and market conditions that are most favorable to success, this method enables firms to focus on target countries, maximize returns, and global expansion with data, backed by accuracy.
By factoring in the projected importer demand gap that is currently unmet and could be potential opportunity, it identifies the potential for the Exporter (Country) among 190 countries, against the general trade analysis, which identifies the biggest importer or exporter.
To discover high-growth global markets and optimize your business strategy:
Click Here
Pricing
- Single User License$ 1,995
- Department License$ 2,400
- Site License$ 3,120
- Global License$ 3,795

Leadership Perspectives from Industry Events
Search
Thought Leadership and Analyst Meet


Our Clients
6WResearch In News
- India Air Conditioner Market Set for Strong Rebound in 2026 After Weather-Led Correction and GST-Driven Recovery: 6Wresearch
- ADAS in India: How Automatic Emergency Braking, Blind Spot Detection & Driver Monitoring are Transforming Road Safety
- Doha a strategic location for EV manufacturing hub: IPA Qatar
- Demand for luxury TVs surging in the GCC, says Samsung
- Empowering Growth: The Thriving Journey of Bangladesh’s Cable Industry
- Demand for luxury TVs surging in the GCC, says Samsung
Latest Reports
- Nicaragua RPG Gaming Market (2026-2032)
- New Zealand RPG Gaming Market (2026-2032)
- Netherlands RPG Gaming Market (2026-2032)
- Nauru RPG Gaming Market (2026-2032)
- Namibia RPG Gaming Market (2026-2032)
- Mozambique RPG Gaming Market (2026-2032)
- Montenegro RPG Gaming Market (2026-2032)
- Mongolia RPG Gaming Market (2026-2032)
- Monaco RPG Gaming Market (2026-2032)
- Micronesia RPG Gaming Market (2026-2032)
Industry Events and Analyst Meet

HIMTEX 2026

India Refining Summit 2026

India EV Show 2026

EV tech India Expo 2026

Auto Tech Asia 2026
Whitepaper
- Middle East & Africa Commercial Security Market Click here to view more.
- Middle East & Africa Fire Safety Systems & Equipment Market Click here to view more.
- GCC Drone Market Click here to view more.
- Middle East Lighting Fixture Market Click here to view more.
- GCC Physical & Perimeter Security Market Click here to view more.