Indonesia Sports Optic Market (2026-2032) Outlook | Share, Forecast, Size, Growth, Revenue, Trends, Analysis, Value, Companies & Industry
Market Forecast By Products (Telescopes, Binoculars, Rangefinders, Riflescopes), By Games (Shooting Sports, Golf, Water Sports, Wheel Sports, Snow Sports, Horse Racing), By Distribution Channel (Online, Offline) And Competitive Landscape
| Product Code: ETC4448849 | Publication Date: Jul 2023 | Updated Date: Mar 2026 | Product Type: Report | |
| Publisher: 6Wresearch | Author: Ravi Bhandari | No. of Pages: 85 | No. of Figures: 45 | No. of Tables: 25 |
Indonesia Sports Optic Market: Import Trend Analysis
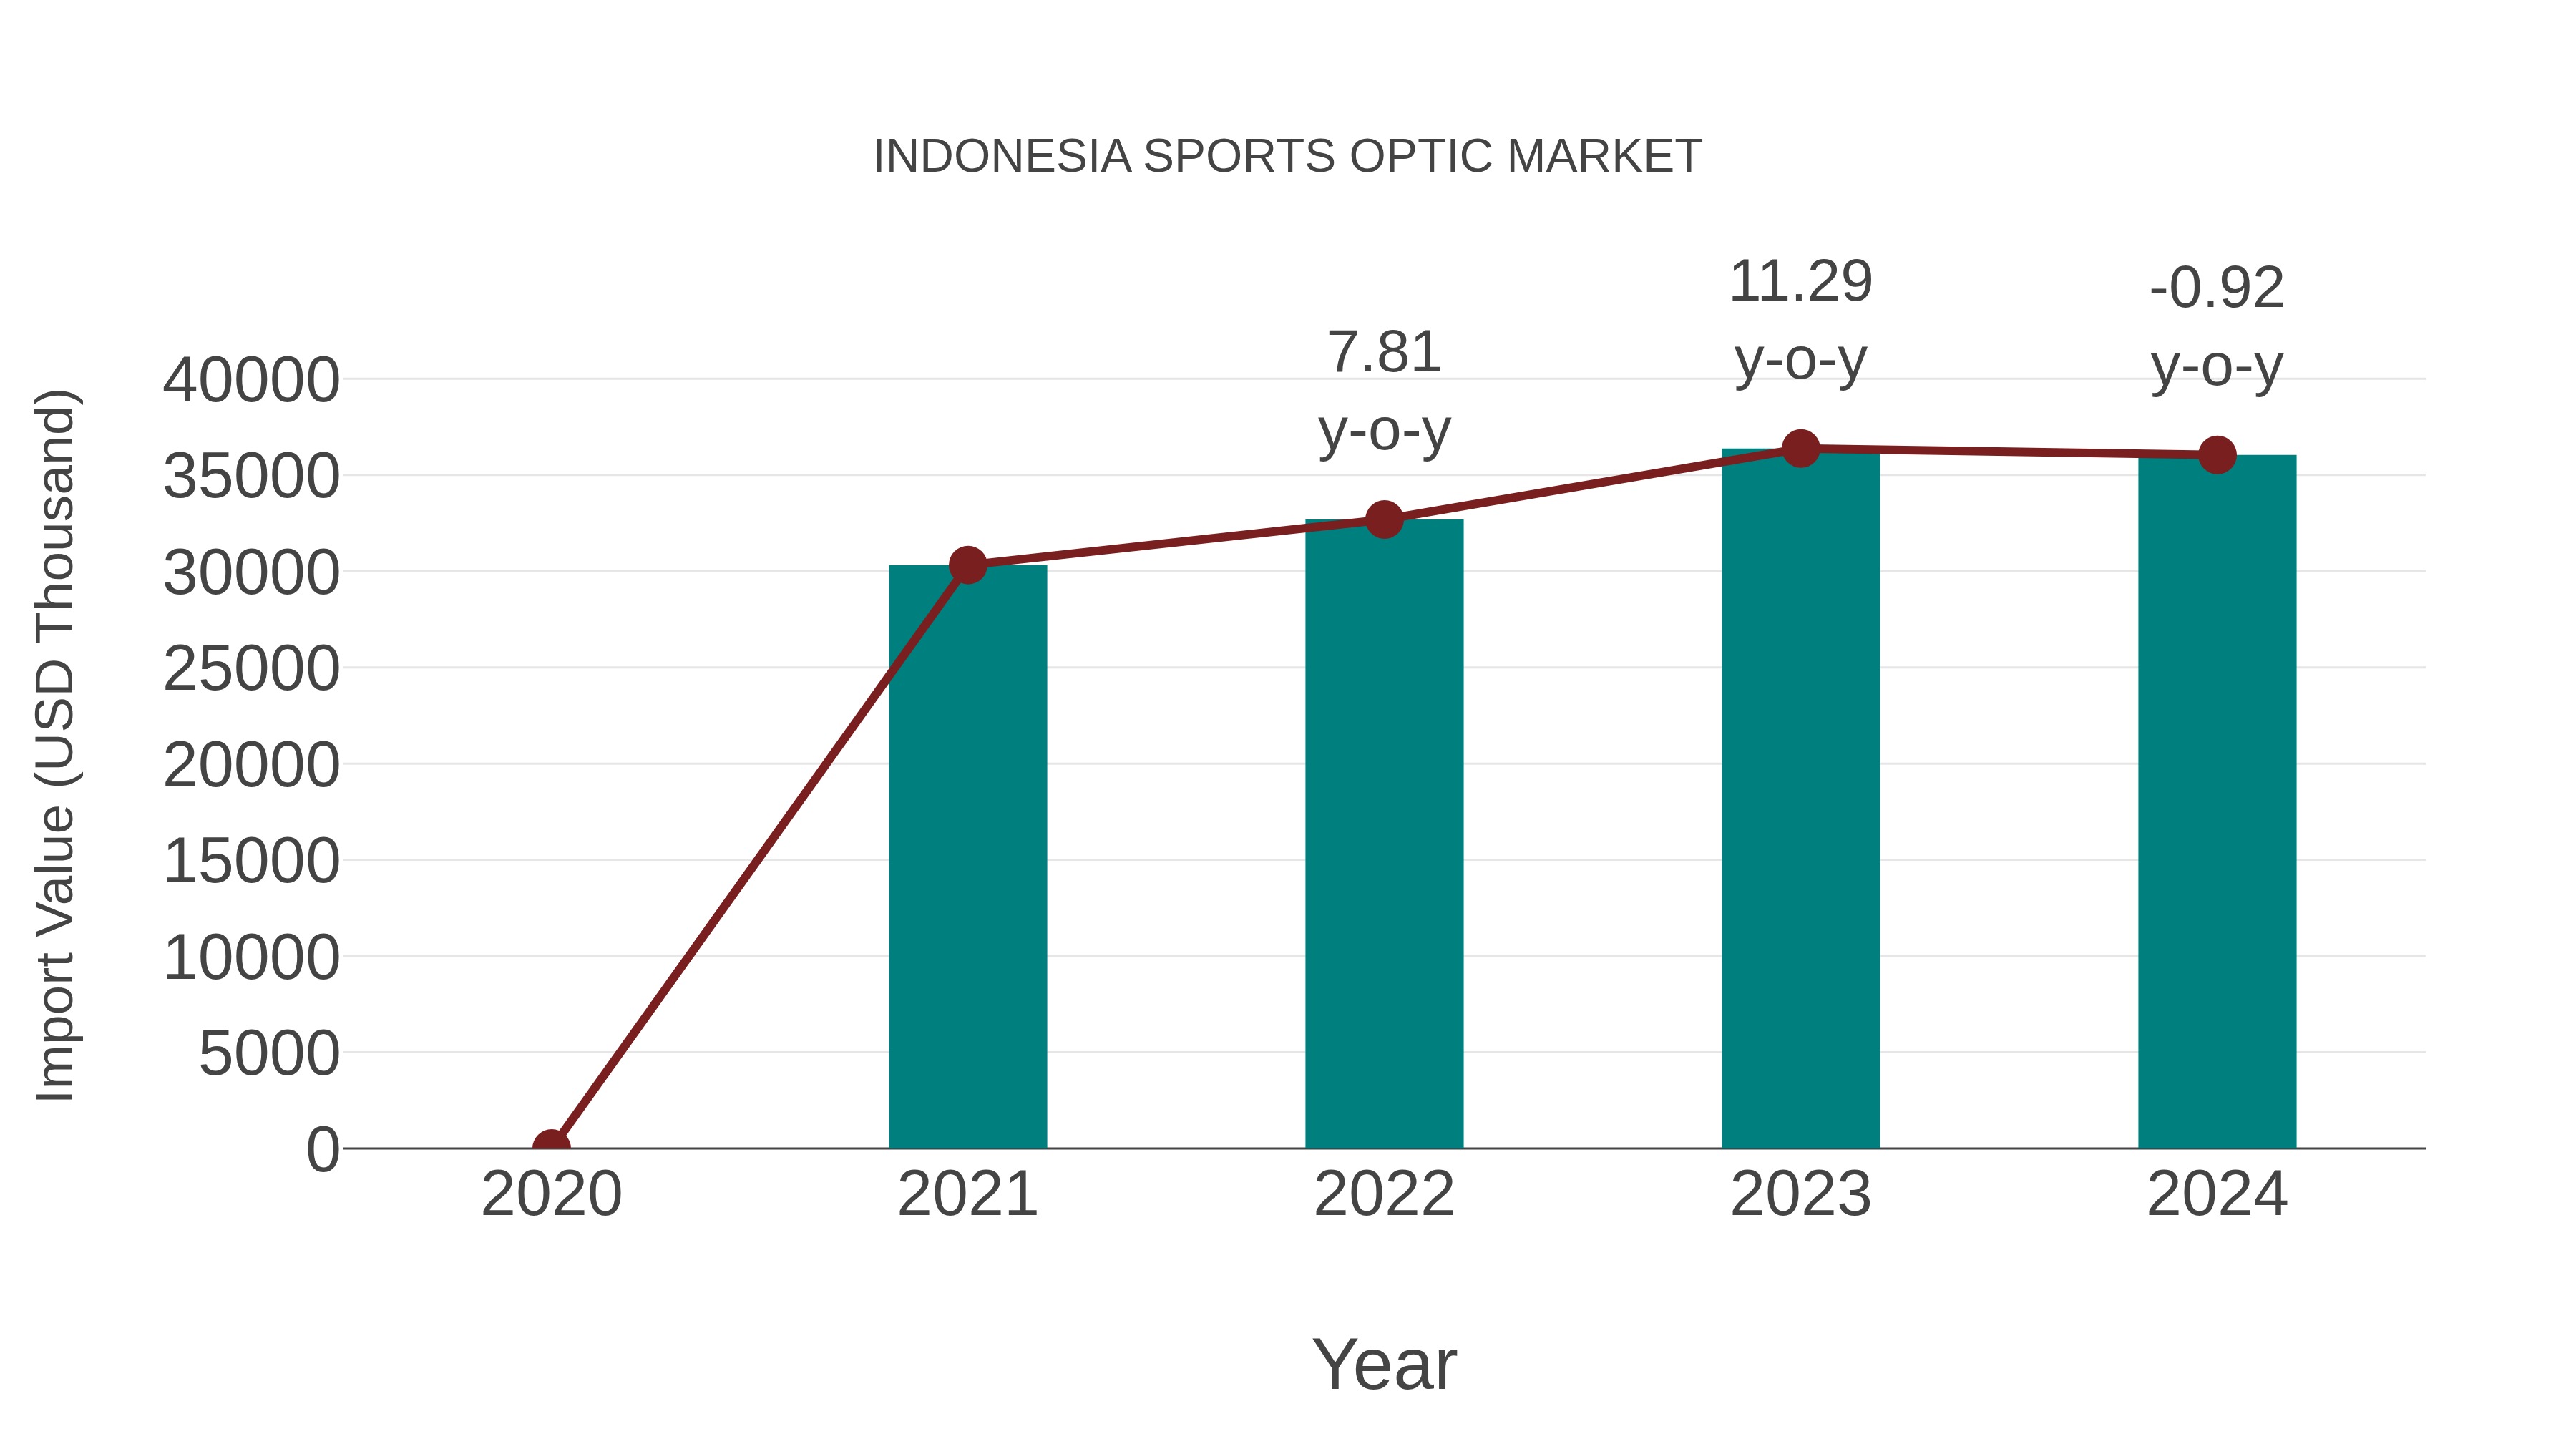
In the Indonesia sports optic market, the import trend experienced a slight decline from 2023 to 2024, with a growth rate of -0.92%. However, the compound annual growth rate (CAGR) for imports from 2020 to 2024 stood at 5.93%. This dip in import momentum in 2024 could be attributed to shifting consumer preferences or changes in trade policies impacting market stability.
Indonesia Sports Optic Market Overview
The Sports Optic market in Indonesia represents a niche but growing segment within the broader sporting goods industry. Sports optics include products like binoculars, scopes, and range finders, catering to the needs of outdoor enthusiasts, hunters, and sports shooters. As the interest in outdoor activities and shooting sports grows in Indonesia, the demand for high-quality sports optics has increased. This market is characterized by the demand for precision and durability in optical equipment.
Drivers of the Market
Increased interest in outdoor sports and activities in Indonesia may drive the sports optic market. Demand for high-quality binoculars, scopes, and optics for various sports and recreational purposes can be key drivers.
Challenges of the Market
The Sports Optic market confronts issues of affordability, making high-quality products accessible to a broader population. Branding and marketing strategies must address this challenge. Additionally, providing durable and weather-resistant optics suited to Indonesia`s climate and terrain is a priority.
COVID-19 Impacts on the Market
Due to lockdowns and restrictions, the sports industry faced setbacks. This impacted the sports optic market as fewer people engaged in sports and outdoor activities, resulting in decreased demand for sports optics.
Key Players of the Makret
Major contenders in the Indonesia Sports Optic market encompass renowned brands like Nikon Corporation, Carl Zeiss AG, Bushnell Corporation, Leupold & Stevens, Inc., and Vortex Optics.
Key Highlights of the Report:
- Indonesia Sports Optic Market Outlook
- Market Size of Indonesia Sports Optic Market, 2025
- Forecast of Indonesia Sports Optic Market, 2032
- Historical Data and Forecast of Indonesia Sports Optic Revenues & Volume for the Period 2022-2032F
- Indonesia Sports Optic Market Trend Evolution
- Indonesia Sports Optic Market Drivers and Challenges
- Indonesia Sports Optic Price Trends
- Indonesia Sports Optic Porter's Five Forces
- Indonesia Sports Optic Industry Life Cycle
- Historical Data and Forecast of Indonesia Sports Optic Market Revenues & Volume By Products for the Period 2022-2032F
- Historical Data and Forecast of Indonesia Sports Optic Market Revenues & Volume By Telescopes for the Period 2022-2032F
- Historical Data and Forecast of Indonesia Sports Optic Market Revenues & Volume By Binoculars for the Period 2022-2032F
- Historical Data and Forecast of Indonesia Sports Optic Market Revenues & Volume By Rangefinders for the Period 2022-2032F
- Historical Data and Forecast of Indonesia Sports Optic Market Revenues & Volume By Riflescopes for the Period 2022-2032F
- Historical Data and Forecast of Indonesia Sports Optic Market Revenues & Volume By Games for the Period 2022-2032F
- Historical Data and Forecast of Indonesia Sports Optic Market Revenues & Volume By Shooting Sports for the Period 2022-2032F
- Historical Data and Forecast of Indonesia Sports Optic Market Revenues & Volume By Golf for the Period 2022-2032F
- Historical Data and Forecast of Indonesia Sports Optic Market Revenues & Volume By Water Sports for the Period 2022-2032F
- Historical Data and Forecast of Indonesia Sports Optic Market Revenues & Volume By Wheel Sports for the Period 2022-2032F
- Historical Data and Forecast of Indonesia Sports Optic Market Revenues & Volume By Snow Sports for the Period 2022-2032F
- Historical Data and Forecast of Indonesia Sports Optic Market Revenues & Volume By Horse Racing for the Period 2022-2032F
- Historical Data and Forecast of Indonesia Sports Optic Market Revenues & Volume By Distribution Channel for the Period 2022-2032F
- Historical Data and Forecast of Indonesia Sports Optic Market Revenues & Volume By Online for the Period 2022-2032F
- Historical Data and Forecast of Indonesia Sports Optic Market Revenues & Volume By Offline for the Period 2022-2032F
- Indonesia Sports Optic Import Export Trade Statistics
- Market Opportunity Assessment By Products
- Market Opportunity Assessment By Games
- Market Opportunity Assessment By Distribution Channel
- Indonesia Sports Optic Top Companies Market Share
- Indonesia Sports Optic Competitive Benchmarking By Technical and Operational Parameters
- Indonesia Sports Optic Company Profiles
- Indonesia Sports Optic Key Strategic Recommendations
Indonesia Sports Optic Market (2026-2032): FAQs
6Wresearch actively monitors the Indonesia Sports Optic Market and publishes its comprehensive annual report, highlighting emerging trends, growth drivers, revenue analysis, and forecast outlook. Our insights help businesses to make data-backed strategic decisions with ongoing market dynamics. Our analysts track relevent industries related to the Indonesia Sports Optic Market, allowing our clients with actionable intelligence and reliable forecasts tailored to emerging regional needs.
Yes, we provide customisation as per your requirements. To learn more, feel free to contact us on sales@6wresearch.com
1 Executive Summary |
2 Introduction |
2.1 Key Highlights of the Report |
2.2 Report Description |
2.3 Market Scope & Segmentation |
2.4 Research Methodology |
2.5 Assumptions |
3 Indonesia Sports Optic Market Overview |
3.1 Indonesia Country Macro Economic Indicators |
3.2 Indonesia Sports Optic Market Revenues & Volume, 2022 & 2032F |
3.3 Indonesia Sports Optic Market - Industry Life Cycle |
3.4 Indonesia Sports Optic Market - Porter's Five Forces |
3.5 Indonesia Sports Optic Market Revenues & Volume Share, By Products , 2022 & 2032F |
3.6 Indonesia Sports Optic Market Revenues & Volume Share, By Games , 2022 & 2032F |
3.7 Indonesia Sports Optic Market Revenues & Volume Share, By Distribution Channel, 2022 & 2032F |
4 Indonesia Sports Optic Market Dynamics |
4.1 Impact Analysis |
4.2 Market Drivers |
4.2.1 Increasing interest in outdoor activities and sports among the Indonesian population |
4.2.2 Growing awareness about the importance of eye protection during sports activities |
4.2.3 Rising disposable income leading to higher spending on sports and outdoor gear |
4.3 Market Restraints |
4.3.1 High import duties and taxes on sports optic products affecting affordability |
4.3.2 Limited availability of specialized sports optic products in the Indonesian market |
4.3.3 Competition from local brands and counterfeit products impacting market growth |
5 Indonesia Sports Optic Market Trends |
6 Indonesia Sports Optic Market, By Types |
6.1 Indonesia Sports Optic Market, By Products |
6.1.1 Overview and Analysis |
6.1.2 Indonesia Sports Optic Market Revenues & Volume, By Products , 2022-2032F |
6.1.3 Indonesia Sports Optic Market Revenues & Volume, By Telescopes, 2022-2032F |
6.1.4 Indonesia Sports Optic Market Revenues & Volume, By Binoculars, 2022-2032F |
6.1.5 Indonesia Sports Optic Market Revenues & Volume, By Rangefinders, 2022-2032F |
6.1.6 Indonesia Sports Optic Market Revenues & Volume, By Riflescopes, 2022-2032F |
6.2 Indonesia Sports Optic Market, By Games |
6.2.1 Overview and Analysis |
6.2.2 Indonesia Sports Optic Market Revenues & Volume, By Shooting Sports, 2022-2032F |
6.2.3 Indonesia Sports Optic Market Revenues & Volume, By Golf, 2022-2032F |
6.2.4 Indonesia Sports Optic Market Revenues & Volume, By Water Sports, 2022-2032F |
6.2.5 Indonesia Sports Optic Market Revenues & Volume, By Wheel Sports, 2022-2032F |
6.2.6 Indonesia Sports Optic Market Revenues & Volume, By Snow Sports, 2022-2032F |
6.2.7 Indonesia Sports Optic Market Revenues & Volume, By Horse Racing, 2022-2032F |
6.3 Indonesia Sports Optic Market, By Distribution Channel |
6.3.1 Overview and Analysis |
6.3.2 Indonesia Sports Optic Market Revenues & Volume, By Online, 2022-2032F |
6.3.3 Indonesia Sports Optic Market Revenues & Volume, By Offline, 2022-2032F |
7 Indonesia Sports Optic Market Import-Export Trade Statistics |
7.1 Indonesia Sports Optic Market Export to Major Countries |
7.2 Indonesia Sports Optic Market Imports from Major Countries |
8 Indonesia Sports Optic Market Key Performance Indicators |
8.1 Percentage increase in participation rates in outdoor sports activities |
8.2 Number of sports events and tournaments promoting the use of sports optic products |
8.3 Growth in the number of retail outlets and online platforms offering sports optic products |
9 Indonesia Sports Optic Market - Opportunity Assessment |
9.1 Indonesia Sports Optic Market Opportunity Assessment, By Products , 2022 & 2032F |
9.2 Indonesia Sports Optic Market Opportunity Assessment, By Games , 2022 & 2032F |
9.3 Indonesia Sports Optic Market Opportunity Assessment, By Distribution Channel, 2022 & 2032F |
10 Indonesia Sports Optic Market - Competitive Landscape |
10.1 Indonesia Sports Optic Market Revenue Share, By Companies, 2025 |
10.2 Indonesia Sports Optic Market Competitive Benchmarking, By Operating and Technical Parameters |
11 Company Profiles |
12 Recommendations |
13 Disclaimer |
Global Go To Market Strategy - 2030
Export potential enables firms to identify high-growth global markets with greater confidence by combining advanced trade intelligence with a structured quantitative methodology. The framework analyzes emerging demand trends and country-level import patterns while integrating macroeconomic and trade datasets such as GDP and population forecasts, bilateral import–export flows, tariff structures, elasticity differentials between developed and developing economies, geographic distance, and import demand projections. Using weighted trade values from 2020–2024 as the base period to project country-to-country export potential for 2030, these inputs are operationalized through calculated drivers such as gravity model parameters, tariff impact factors, and projected GDP per-capita growth. Through an analysis of hidden potentials, demand hotspots, and market conditions that are most favorable to success, this method enables firms to focus on target countries, maximize returns, and global expansion with data, backed by accuracy.
By factoring in the projected importer demand gap that is currently unmet and could be potential opportunity, it identifies the potential for the Exporter (Country) among 190 countries, against the general trade analysis, which identifies the biggest importer or exporter.
To discover high-growth global markets and optimize your business strategy:
Click Here
Pricing
- Single User License$ 1,995
- Department License$ 2,400
- Site License$ 3,120
- Global License$ 3,795

Leadership Perspectives from Industry Events
Search
Thought Leadership and Analyst Meet


Our Clients
6WResearch In News
- India Export Attractiveness Tracker 2026
- India Air Conditioner Market Set for Strong Rebound in 2026 After Weather-Led Correction and GST-Driven Recovery: 6Wresearch
- ADAS in India: How Automatic Emergency Braking, Blind Spot Detection & Driver Monitoring are Transforming Road Safety
- Doha a strategic location for EV manufacturing hub: IPA Qatar
- Demand for luxury TVs surging in the GCC, says Samsung
- Empowering Growth: The Thriving Journey of Bangladesh’s Cable Industry
Latest Reports
- Nicaragua RPG Gaming Market (2026-2032)
- New Zealand RPG Gaming Market (2026-2032)
- Netherlands RPG Gaming Market (2026-2032)
- Nauru RPG Gaming Market (2026-2032)
- Namibia RPG Gaming Market (2026-2032)
- Mozambique RPG Gaming Market (2026-2032)
- Montenegro RPG Gaming Market (2026-2032)
- Mongolia RPG Gaming Market (2026-2032)
- Monaco RPG Gaming Market (2026-2032)
- Micronesia RPG Gaming Market (2026-2032)
Industry Events and Analyst Meet

EV India Expo 2026

HIMTEX 2026

India Refining Summit 2026

India EV Show 2026

EV tech India Expo 2026
Whitepaper
- Middle East & Africa Commercial Security Market Click here to view more.
- Middle East & Africa Fire Safety Systems & Equipment Market Click here to view more.
- GCC Drone Market Click here to view more.
- Middle East Lighting Fixture Market Click here to view more.
- GCC Physical & Perimeter Security Market Click here to view more.