Indonesia Sulphuric Acid Market (2026-2032) | Forecast, Trends, Companies, Analysis, Value, Revenue, Growth, Size, Share & Industry
Market Forecast By Raw Material (Elemental sulfur, Base metal smelters, Pyrite ore, Others), By Applications (Fertilizers, Chemical manufacturing, Metal processing, Petroleum refining, Textile industry, Automotive, Paper & pulp, Others) And Competitive Landscape
| Product Code: ETC074567 | Publication Date: Jun 2021 | Updated Date: Mar 2026 | Product Type: Report | |
| Publisher: 6Wresearch | Author: Ravi Bhandari | No. of Pages: 70 | No. of Figures: 35 | No. of Tables: 5 |
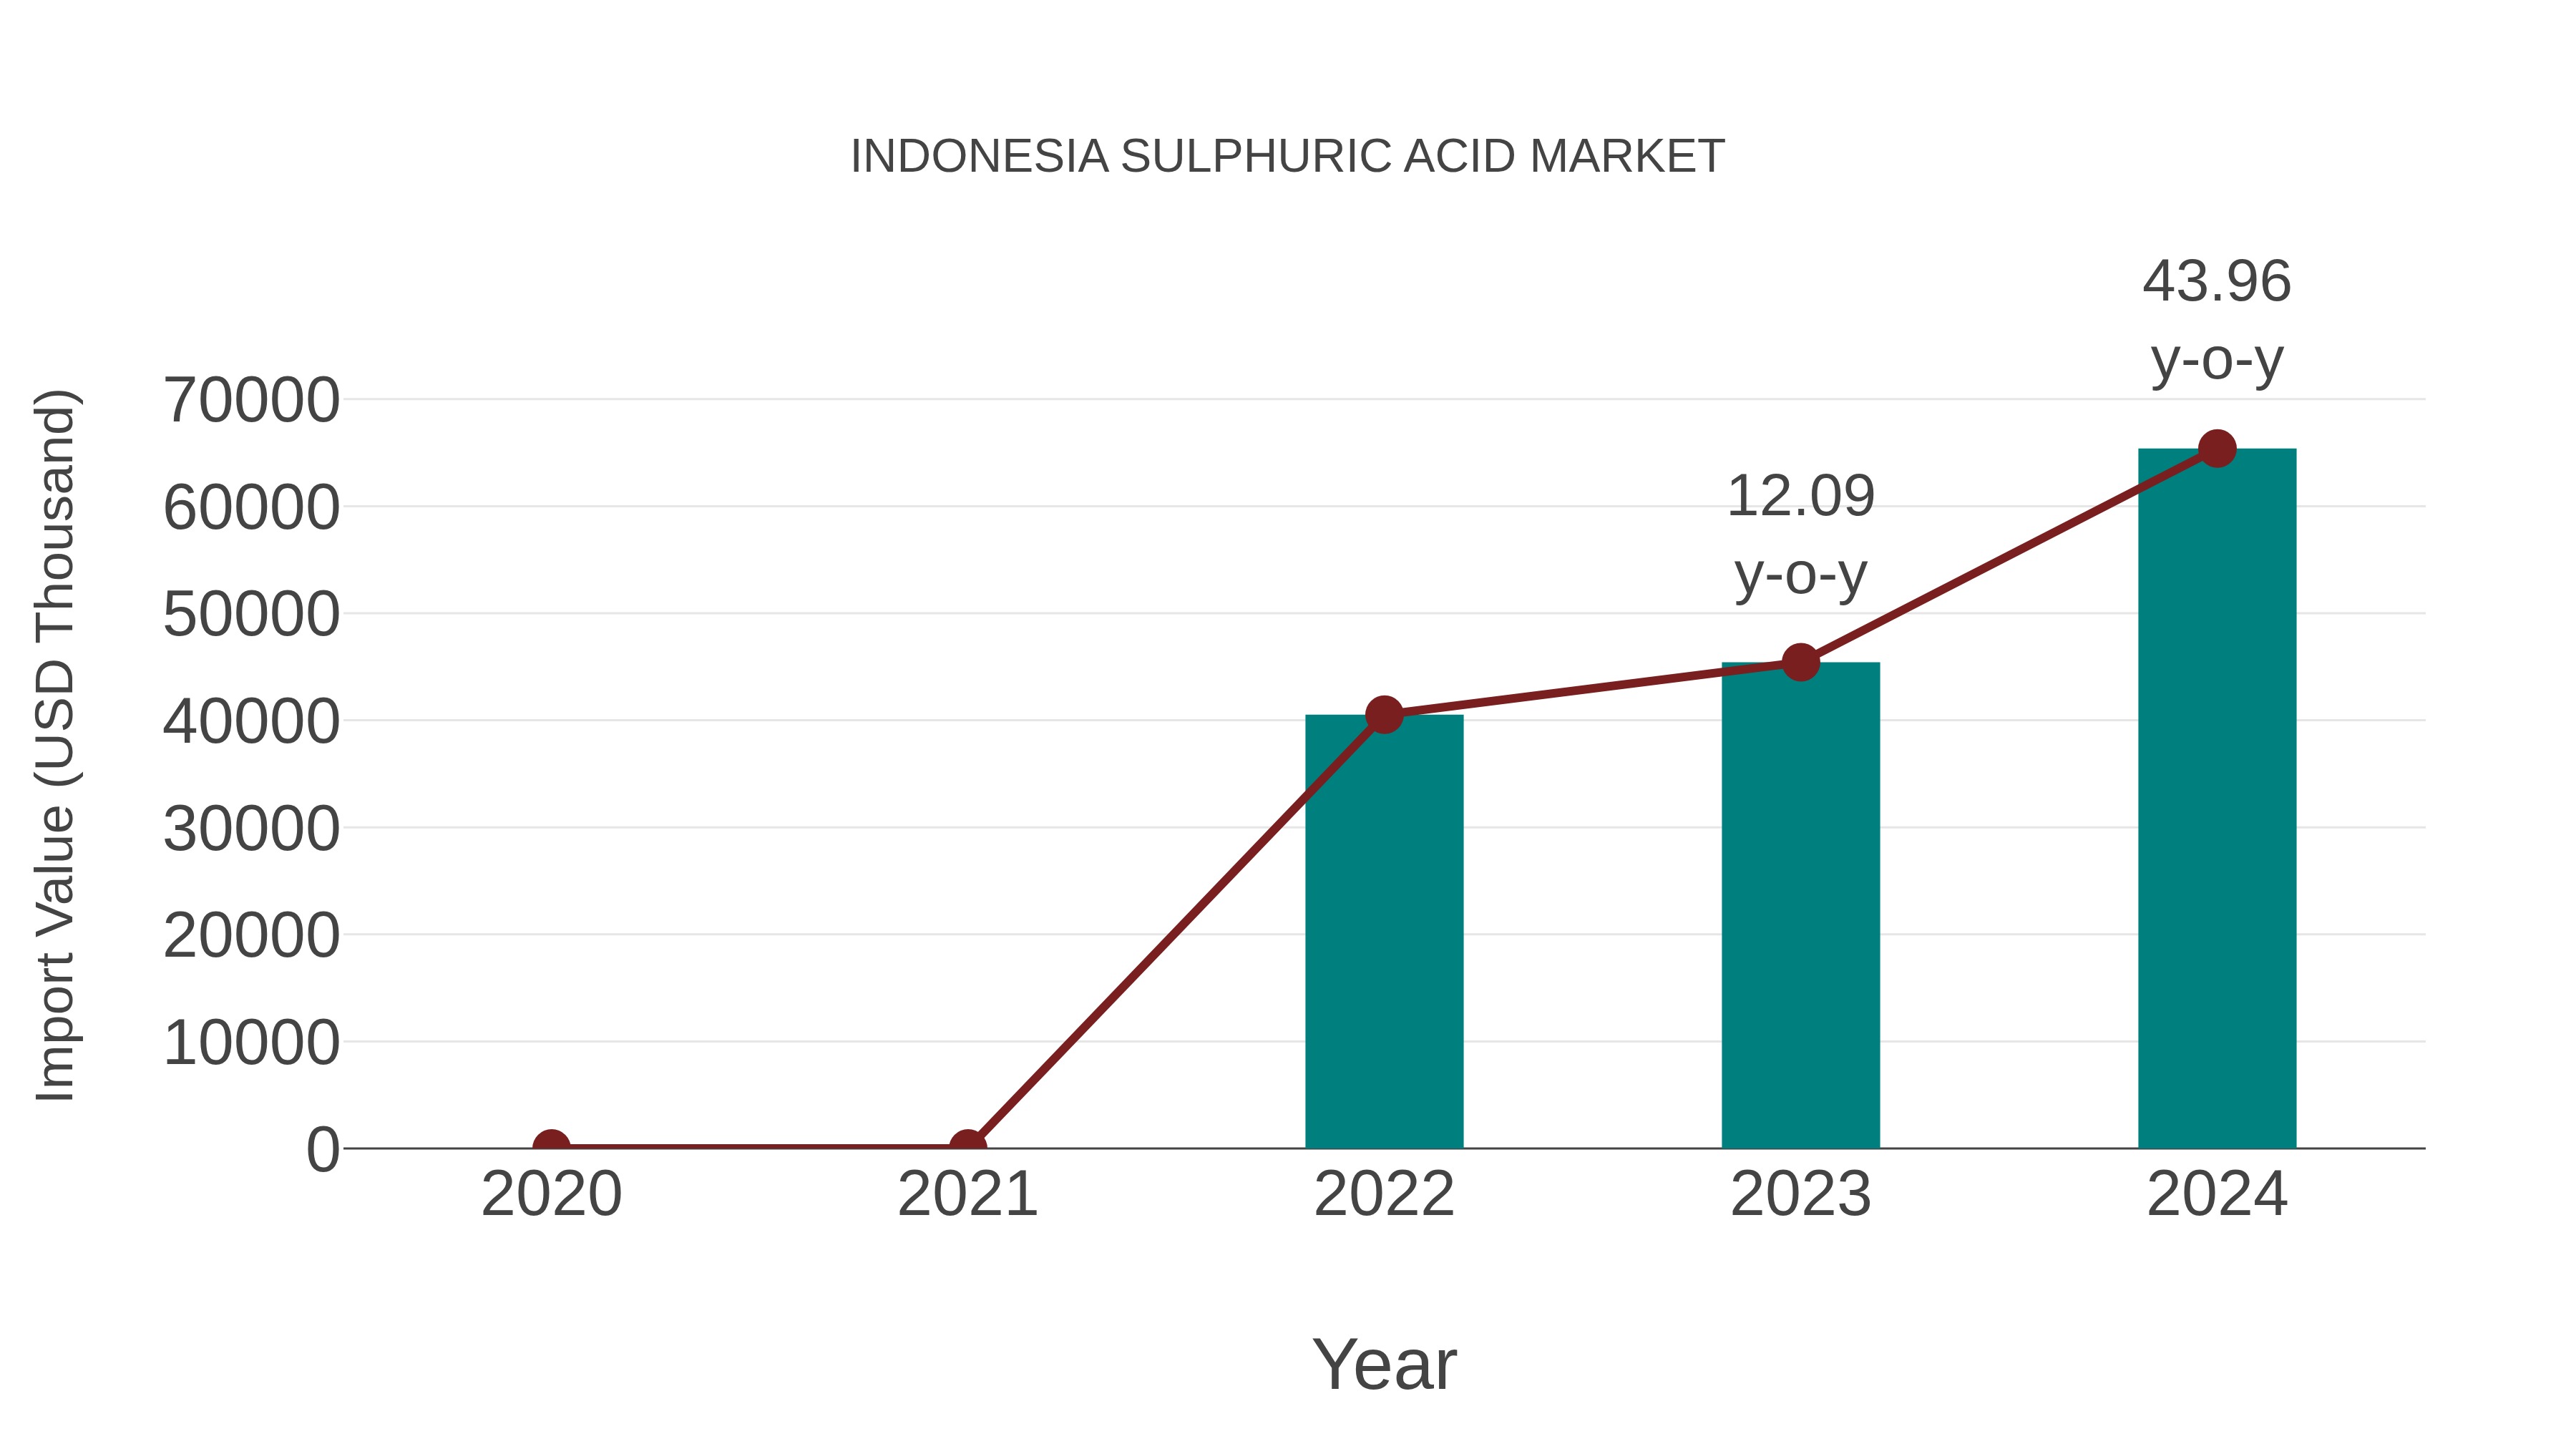
Indonesia Sulphuric Acid Market: Import Trend Analysis
In the Indonesia sulphuric acid market, the import trend showed significant growth from 2023 to 2024, with a notable increase of 43.96%. The compound annual growth rate (CAGR) for imports between 2020 and 2024 stood at 27.03%. This robust import momentum can be attributed to a steady demand shift towards industrial applications, indicating a stable market environment conducive to trade expansion.
Indonesia Sulphuric Acid Market Growth Rate
According to 6Wresearch internal database and industry insights, the Indonesia Sulphuric Acid Market is growing at a compound annual growth rate (CAGR) of 6.5% during the forecast period (2026–2032).
Topics Covered in the Indonesia Sulphuric Acid Market Report
The Indonesia Sulphuric Acid Market report thoroughly covers the market by raw materials and applications. The report provides an unbiased and detailed analysis of ongoing market trends, opportunities/high growth areas, and market drivers, helping stakeholders devise and align their market strategies according to the current and future market dynamics.
Indonesia Sulphuric Acid Market Highlights
| Report Name | Indonesia Sulphuric Acid Market |
| Forecast period | 2026-2032 |
| CAGR | 6.5% |
| Growing Sector | Fertilizer Manufacturing |
Indonesia Sulphuric Acid Market Synopsis
The Indonesia Sulphuric Acid Market is experiencing steady growth as fertilizer manufacturing companies need more sulfuric acid while industrial production facilities grow their operations. The chemical manufacturing sector and mining industry and petroleum refining sector drive market growth. The government infrastructure development programs together with new production technologies drive increased demand for products. The market will continue to expand as various industries use sulfuric acid for different purposes.
Evaluation of Growth Drivers in the Indonesia Sulphuric Acid Market
Below mentioned are some growth drivers and their impact on market dynamics:
| Drivers | Primary Segments Affected | Why It Matters |
| Increasing Demand for Fertilizers | Application (Fertilizers) | Fertilizers are a major consumer of sulfuric acid, fueling growth in agricultural production. |
| Industrial Expansion | Raw Material (Elemental Sulfur) | Growing industrialization increases the need for sulfuric acid in various processes |
| Technological Advancements | Raw Material (Base Metal Smelters) | Advanced technologies improve sulfuric acid production and reduce environmental impact. |
| Growing Chemical Manufacturing | Application (Chemical Manufacturing) | Sulphuric acid is essential in many chemical production processes, boosting demand. |
| Development of Infrastructure | Applications (Various industries) | Infrastructure expansion fuels demand for acid in construction, automotive, and textiles. |
The Indonesia Sulphuric Acid Market is projected to grow at a CAGR of 6.5% during the forecast period of 2026-2032. The sulfuric acid market in Indonesia develops through two main factors which include increasing fertilizer industry demand for phosphate fertilizers. The market experiences growth as the chemical manufacturing and metal processing industries continue to expand their operations. The mining industry drives increased infrastructure development which creates higher sulfuric acid demand. The market develops through government industrial growth initiatives which work together with environmental regulations to promote sustainable production methods. The rising agricultural activities in Indonesia create an increasing demand for sulfuric acid, which is used in fertilizers.
Evaluation of Restraints in the Indonesia Sulphuric Acid Market
Below are some key challenges and their influence on market dynamics:
| Restraints | Primary Segments Affected | What This Means |
| Volatility of Raw Material Prices | Raw Material (Elemental Sulfur) | Volatility in the pricing of raw materials can hamper market growth. |
| Environmental Concerns | Manufacturing Process | Stricter regulations regarding sulfur emission is limiting production capacity. |
| High Energy Consumption | Raw Material (Base Metal Smelters) | The profitability and operational coast gets reduced due to Energy-intensive production. |
| Competition from Alternative Materials | Application (Packaging, Automotive) | The presence of other substitutes like bio-based solutions are lowering sulfuric acid demand. |
| Supply Chain Challenges | Distribution Channel (All Channels) | The inefficient supply chain is affecting the growth of the industry. |
Indonesia Sulphuric Acid Market Challenges
The Indonesia Sulphuric Acid Market faces several challenges in its path of growth. These challenges includes fluctuations in raw material prices, mainly sulfur, which impacts production costs. Environmental concerns related to sulfur emissions and stringent regulations add compliance costs. Other than that, production requires high energy consumption which increases operational expenses while bio-based acids and other materials create competition that hampers market development. Production delays occur through supply chain disruptions which then impact inventory management. The organization needs to develop strategic solutions which will enable them to achieve profitability while maintaining market stability.
Indonesia Sulphuric Acid Market Trends
Some major trends contributing to the development of the Indonesia Sulphuric Acid Market Growth are:
- Rising Demand in Mining: Due to the growth of mining activities in Indonesia, mainly for extraction of copper and gold the market is expected to grow robustly.
- Increasing Technological Innovations: Advancements in production technologies like solvent extraction and membrane filtration increases sulfuric acid efficiency and lower costs.
- Recycling and Reuse: growing focus on recycling sulfuric acid from spent catalysts and industrial waste encourages sustainability and lower environmental impact.
Investment Opportunities in the Indonesia Sulphuric Acid Market
Here are some investment opportunities in the Indonesia Sulphuric Acid Industry:
- Fertilizer Production: Expanding sulfuric acid production facilities in fertilizers supports growing agricultural demand, ensuring a steady supply for the sector.
- Alternative Production Methods: Investing in sustainable and energy-efficient sulfuric acid technologies helps meet environmental standards and reduces operational costs.
- Growth of the Mining Sector: Investing more on the mining sector's growth, mainly for copper extraction, increases the demand for sulfuric acid production in Indonesia.
Top 5 Leading Players in the Indonesia Sulphuric Acid Market
Here are some top companies contributing to the Indonesia Sulphuric Acid Market Share:
1. PT Petrokimia Gresik
| Company Name | PT Petrokimia Gresik |
|---|---|
| Established Year | 1972 |
| Headquarters | Gresik, East Java, Indonesia |
| Official Website | Click Here |
PT Petrokimia Gresik is the most complete fertilizer producer in Indonesia and a dominant force in the domestic sulphuric acid market. The company operates massive sulphuric acid plants to support its core production of NPK and phosphate fertilizers.
2. PT Smelting
| Company Name | PT Smelting |
|---|---|
| Established Year | 1996 |
| Headquarters | Gresik, East Java, Indonesia |
| Official Website | Click Here |
PT Smelting is Indonesia’s first copper smelter and refinery, operated as a joint venture involving Mitsubishi Materials and Freeport Indonesia. The facility captures sulphur dioxide emissions from its copper smelting process and converts them into high-quality sulphuric acid.
3. PT Freeport Indonesia (Manyar Smelter)
| Company Name | PT Freeport Indonesia (Manyar Smelter) |
|---|---|
| Established Year | 1967 |
| Headquarters | Jakarta, Indonesia |
| Official Website | Click Here |
PT Freeport Indonesia is a titan in the mining and metals sector, recently completing its "Manyar" copper smelter at the Java Integrated Industrial and Ports Estate (JIIPE). This world-class facility includes one of the largest single-line sulphuric acid units globally.
4. PT Indonesian Acids Industry
| Company Name | PT Indonesian Acids Industry |
|---|---|
| Established Year | 1970 |
| Headquarters | Jakarta, Indonesia |
| Official Website | - |
As a dedicated chemical manufacturer, PT Indonesian Acids Industry specializes in the production of sulphuric acid and its derivatives, such as aluminum sulphate and battery acid. The company is a key supplier to the Indonesian textile, water treatment, and automotive industries.
5. PT Kaltim Parna Industri (KPI)
| Company Name | PT Kaltim Parna Industri (KPI) |
|---|---|
| Established Year | 1995 |
| Headquarters | Bontang, East Kalimantan, Indonesia |
| Official Website | Click Here |
Located in the strategic industrial hub of Bontang, PT Kaltim Parna Industri is a major player in the Indonesian petrochemical landscape. While primarily known as a massive anhydrous ammonia producer, the company is deeply integrated into the industrial chemical value chain in Kalimantan.
Government Initiatives in the Indonesia Sulphuric Acid Market
According to the Indonesian Government Data, the Indonesian government promotes sustainable industrial growth through initiatives like the National Industrial Development Plan which supports efficient sulfuric acid production. The National Green Growth Program supports eco-friendly manufacturing processes to minimize environmental impact. The Ministry of Energy and Mineral Resources wants to increase sulfuric acid usage in the mining sector especially for copper extraction. Government-backed investments in infrastructure and technology upgrades further support the growth of sulfuric acid production which ensures compliance with environmental regulations.
Future Insights of the Indonesia Sulphuric Acid Market
The Indonesia Sulphuric Acid Market will experience substantial growth as industrialization will create higher demand from fertilizer, chemical manufacturing and mining operations. Government policies which promote sustainability and build infrastructure will create additional market growth opportunities. The market will develop over time as of technological advancements which improve sulfuric acid production processes and recycling methods. The increasing need for sulfuric acid in emerging industries such as textiles and automotive will shape market development in the future.
Market Segmentation Analysis
The report offers a comprehensive study of the subsequent market segments and their leading categories.
Elemental Sulfur to Dominate the Market – By Raw Material
According to Guneet Kaur, Senior Research Analyst at 6Wresearch, elemental sulfur dominates the market due to its cost-effectiveness and availability. It is widely used in sulfuric acid production, particularly in the fertilizer industry, making it the preferred choice in Indonesia's market.
Fertilizers to Dominate the Market – By Applications
Fertilizers are leading the market by application. Sulfuric acid is crucial in producing phosphate fertilizers, which are important for agriculture. Also, the growing demand for fertilizers in Indonesia, driven by agricultural expansion, strengthens its dominance as the largest consumer of sulfuric acid in the country.
Key Attractiveness of the Report
- 10 Years of Market Numbers
- Historical Data Starting from 2022 to 2025
- Base Year: 2025
- Forecast Data until 2032
- Key Performance Indicators Impacting the Market
- Major Upcoming Developments and Projects
Key Highlights of the Report:
- Indonesia Sulphuric Acid Market Outlook
- Market Size of Indonesia Sulphuric Acid Market, 2025
- Forecast of Indonesia Sulphuric Acid Market, 2032
- Historical Data and Forecast of Indonesia Sulphuric Acid Revenues & Volume for the Period 2022-2032
- Indonesia Sulphuric Acid Market Trend Evolution
- Indonesia Sulphuric Acid Market Drivers and Challenges
- Indonesia Sulphuric Acid Price Trends
- Indonesia Sulphuric Acid Porter's Five Forces
- Indonesia Sulphuric Acid Industry Life Cycle
- Historical Data and Forecast of Indonesia Sulphuric Acid Market Revenues & Volume By Raw Material for the Period 2022-2032
- Historical Data and Forecast of Indonesia Sulphuric Acid Market Revenues & Volume By Elemental sulfur for the Period 2022-2032
- Historical Data and Forecast of Indonesia Sulphuric Acid Market Revenues & Volume By Base metal smelters for the Period 2022-2032
- Historical Data and Forecast of Indonesia Sulphuric Acid Market Revenues & Volume By Pyrite ore for the Period 2022-2032
- Historical Data and Forecast of Indonesia Sulphuric Acid Market Revenues & Volume By Others for the Period 2022-2032
- Historical Data and Forecast of Indonesia Sulphuric Acid Market Revenues & Volume By Applications for the Period 2022-2032
- Historical Data and Forecast of Indonesia Sulphuric Acid Market Revenues & Volume By Fertilizers for the Period 2022-2032
- Historical Data and Forecast of Indonesia Sulphuric Acid Market Revenues & Volume By Chemical manufacturing for the Period 2022-2032
- Historical Data and Forecast of Indonesia Sulphuric Acid Market Revenues & Volume By Metal processing for the Period 2022-2032
- Historical Data and Forecast of Indonesia Sulphuric Acid Market Revenues & Volume By Petroleum refining for the Period 2022-2032
- Historical Data and Forecast of Indonesia Sulphuric Acid Market Revenues & Volume By Textile industry for the Period 2022-2032
- Historical Data and Forecast of Indonesia Sulphuric Acid Market Revenues & Volume By Automotive for the Period 2022-2032
- Historical Data and Forecast of Indonesia Sulphuric Acid Market Revenues & Volume By Paper & pulp for the Period 2022-2032
- Historical Data and Forecast of Indonesia Sulphuric Acid Market Revenues & Volume By Others for the Period 2022-2032
- Indonesia Sulphuric Acid Import Export Trade Statistics
- Market Opportunity Assessment By Raw Material
- Market Opportunity Assessment By Applications
- Indonesia Sulphuric Acid Top Companies Market Share
- Indonesia Sulphuric Acid Competitive Benchmarking By Technical and Operational Parameters
- Indonesia Sulphuric Acid Company Profiles
- Indonesia Sulphuric Acid Key Strategic Recommendations
Markets Covered
The report provides a detailed analysis of the following market segments:
By Countries
- Indonesia
- Malaysia
- Thailand
- Vietnam
- Philippines
By Raw Material
- Elemental Sulfur
- Base Metal Smelters
- Pyrite Ore
- Others
By Application
- Fertilizers
- Chemical Manufacturing
- Metal Processing
- Petroleum Refining
- Textile Industry
- Automotive
- Paper & Pulp
- Others
Indonesia Sulphuric Acid Market (2026-2032): FAQs
Fluctuating raw material prices and increased competition from the presence of other alternative materials like bio-based acids are key restraints of the market.
Growth in the fertilizer, chemical manufacturing, and mining industries is driving the demand for sulfuric acid in Indonesia.
The government supports sulfuric acid production through the National Industrial Development Plan and National Green Growth Program.
The Indonesia Sulphuric Acid Market is projected to grow at a CAGR of 6.5% during the forecast period of 2026-2032.
6Wresearch actively monitors the Indonesia Sulphuric Acid Market and publishes its comprehensive annual report, highlighting emerging trends, growth drivers, revenue analysis, and forecast outlook. Our insights help businesses to make data-backed strategic decisions with ongoing market dynamics. Our analysts track relevent industries related to the Indonesia Sulphuric Acid Market, allowing our clients with actionable intelligence and reliable forecasts tailored to emerging regional needs.
Yes, we provide customisation as per your requirements. To learn more, feel free to contact us on sales@6wresearch.com
| 1 Executive Summary |
| 2 Introduction |
| 2.1 Key Highlights of the Report |
| 2.2 Report Description |
| 2.3 Market Scope & Segmentation |
| 2.4 Research Methodology |
| 2.5 Assumptions |
| 3 Indonesia Sulphuric Acid Market Overview |
| 3.1 Indonesia Sulphuric Acid Market Revenues & Volume, 2022-2032F |
| 3.2 Indonesia Sulphuric Acid Market - Industry Life Cycle |
| 3.3 Indonesia Sulphuric Acid Market - Porter's Five Forces |
| 3.4 Indonesia Sulphuric Acid Market Revenues & Volume Share, By Raw Material, 2022 & 2032F |
| 3.5 Indonesia Sulphuric Acid Market Revenues & Volume Share, By Applications, 2022 & 2032F |
| 4 Indonesia Sulphuric Acid Market Dynamics |
| 4.1 Impact Analysis |
| 4.2 Market Drivers |
| 4.2.1 Increasing demand from various industries such as fertilizers, chemicals, and mining |
| 4.2.2 Growth in industrial activities and infrastructure development in Indonesia |
| 4.2.3 Favorable government policies and incentives promoting domestic production of sulphuric acid |
| 4.3 Market Restraints |
| 4.3.1 Volatility in raw material prices, such as sulfur and natural gas, impacting production costs |
| 4.3.2 Environmental regulations and compliance requirements affecting production processes |
| 4.3.3 Competition from imported sulphuric acid products in the Indonesian market |
| 5 Indonesia Sulphuric Acid Market Trends |
| 6 Indonesia Sulphuric Acid Market Segmentation |
| 6.1 Indonesia Sulphuric Acid Market, By Raw Material |
| 6.1.1 Overview and Analysis |
| 6.1.2 Indonesia Sulphuric Acid Market Revenues & Volume, By Raw Material, 2022-2032F |
| 6.1.3 Indonesia Sulphuric Acid Market Revenues & Volume, By Elemental sulfur, 2022-2032F |
| 6.1.4 Indonesia Sulphuric Acid Market Revenues & Volume, By Base metal smelters, 2022-2032F |
| 6.1.5 Indonesia Sulphuric Acid Market Revenues & Volume, By Pyrite ore, 2022-2032F |
| 6.1.6 Indonesia Sulphuric Acid Market Revenues & Volume, By Others, 2022-2032F |
| 6.2 Indonesia Sulphuric Acid Market, By Applications |
| 6.2.1 Overview and Analysis |
| 6.2.2 Indonesia Sulphuric Acid Market Revenues & Volume, By Fertilizers, 2022-2032F |
| 6.2.3 Indonesia Sulphuric Acid Market Revenues & Volume, By Chemical manufacturing, 2022-2032F |
| 6.2.4 Indonesia Sulphuric Acid Market Revenues & Volume, By Metal processing, 2022-2032F |
| 6.2.5 Indonesia Sulphuric Acid Market Revenues & Volume, By Petroleum refining, 2022-2032F |
| 6.2.6 Indonesia Sulphuric Acid Market Revenues & Volume, By Textile industry, 2022-2032F |
| 6.2.7 Indonesia Sulphuric Acid Market Revenues & Volume, By Automotive, 2022-2032F |
| 6.2.8 Indonesia Sulphuric Acid Market Revenues & Volume, By Others, 2022-2032F |
| 6.2.9 Indonesia Sulphuric Acid Market Revenues & Volume, By Others, 2022-2032F |
| 7 Indonesia Sulphuric Acid Market Import-Export Trade Statistics |
| 7.1 Indonesia Sulphuric Acid Market Export to Major Countries |
| 7.2 Indonesia Sulphuric Acid Market Imports from Major Countries |
| 8 Indonesia Sulphuric Acid Market Key Performance Indicators |
| 8.1 Capacity utilization rate of sulphuric acid production plants |
| 8.2 Average selling price of sulphuric acid in the domestic market |
| 8.3 Number of new investments or expansions in the sulphuric acid production sector |
| 9 Indonesia Sulphuric Acid Market - Opportunity Assessment |
| 9.1 Indonesia Sulphuric Acid Market Opportunity Assessment, By Raw Material, 2022 & 2032F |
| 9.2 Indonesia Sulphuric Acid Market Opportunity Assessment, By Applications, 2022 & 2032F |
| 10 Indonesia Sulphuric Acid Market - Competitive Landscape |
| 10.1 Indonesia Sulphuric Acid Market Revenue Share, By Companies, 2025 |
| 10.2 Indonesia Sulphuric Acid Market Competitive Benchmarking, By Operating and Technical Parameters |
| 11 Company Profiles |
| 12 Recommendations |
| 13 Disclaimer |
Global Go To Market Strategy - 2030
Export potential enables firms to identify high-growth global markets with greater confidence by combining advanced trade intelligence with a structured quantitative methodology. The framework analyzes emerging demand trends and country-level import patterns while integrating macroeconomic and trade datasets such as GDP and population forecasts, bilateral import–export flows, tariff structures, elasticity differentials between developed and developing economies, geographic distance, and import demand projections. Using weighted trade values from 2020–2024 as the base period to project country-to-country export potential for 2030, these inputs are operationalized through calculated drivers such as gravity model parameters, tariff impact factors, and projected GDP per-capita growth. Through an analysis of hidden potentials, demand hotspots, and market conditions that are most favorable to success, this method enables firms to focus on target countries, maximize returns, and global expansion with data, backed by accuracy.
By factoring in the projected importer demand gap that is currently unmet and could be potential opportunity, it identifies the potential for the Exporter (Country) among 190 countries, against the general trade analysis, which identifies the biggest importer or exporter.
To discover high-growth global markets and optimize your business strategy:
Click Here
Pricing
- Single User License$ 1,995
- Department License$ 2,400
- Site License$ 3,120
- Global License$ 3,795

Leadership Perspectives from Industry Events
Search
Thought Leadership and Analyst Meet


Our Clients
6WResearch In News
- India Air Conditioner Market Set for Strong Rebound in 2026 After Weather-Led Correction and GST-Driven Recovery: 6Wresearch
- ADAS in India: How Automatic Emergency Braking, Blind Spot Detection & Driver Monitoring are Transforming Road Safety
- Doha a strategic location for EV manufacturing hub: IPA Qatar
- Demand for luxury TVs surging in the GCC, says Samsung
- Empowering Growth: The Thriving Journey of Bangladesh’s Cable Industry
- Demand for luxury TVs surging in the GCC, says Samsung
Latest Reports
- Nicaragua RPG Gaming Market (2026-2032)
- New Zealand RPG Gaming Market (2026-2032)
- Netherlands RPG Gaming Market (2026-2032)
- Nauru RPG Gaming Market (2026-2032)
- Namibia RPG Gaming Market (2026-2032)
- Mozambique RPG Gaming Market (2026-2032)
- Montenegro RPG Gaming Market (2026-2032)
- Mongolia RPG Gaming Market (2026-2032)
- Monaco RPG Gaming Market (2026-2032)
- Micronesia RPG Gaming Market (2026-2032)
Industry Events and Analyst Meet

EV India Expo 2026

HIMTEX 2026

India Refining Summit 2026

India EV Show 2026

EV tech India Expo 2026
Whitepaper
- Middle East & Africa Commercial Security Market Click here to view more.
- Middle East & Africa Fire Safety Systems & Equipment Market Click here to view more.
- GCC Drone Market Click here to view more.
- Middle East Lighting Fixture Market Click here to view more.
- GCC Physical & Perimeter Security Market Click here to view more.