Indonesia Water Repellant Agent Market (2026-2032) Outlook | Analysis, Share, Industry, Revenue, Size, Growth, Forecast, Value, Companies & Trends
Market Forecast By Product Type (Polyurethane, Teflon, Silicones), By Technology (Water-Based, Solvent-Based, Others), By End Use (Textiles, Construction, Automotive, Medical, Others) And Competitive Landscape
| Product Code: ETC352528 | Publication Date: Aug 2022 | Updated Date: Mar 2026 | Product Type: Market Research Report | |
| Publisher: 6Wresearch | Author: Ravi Bhandari | No. of Pages: 75 | No. of Figures: 35 | No. of Tables: 20 |
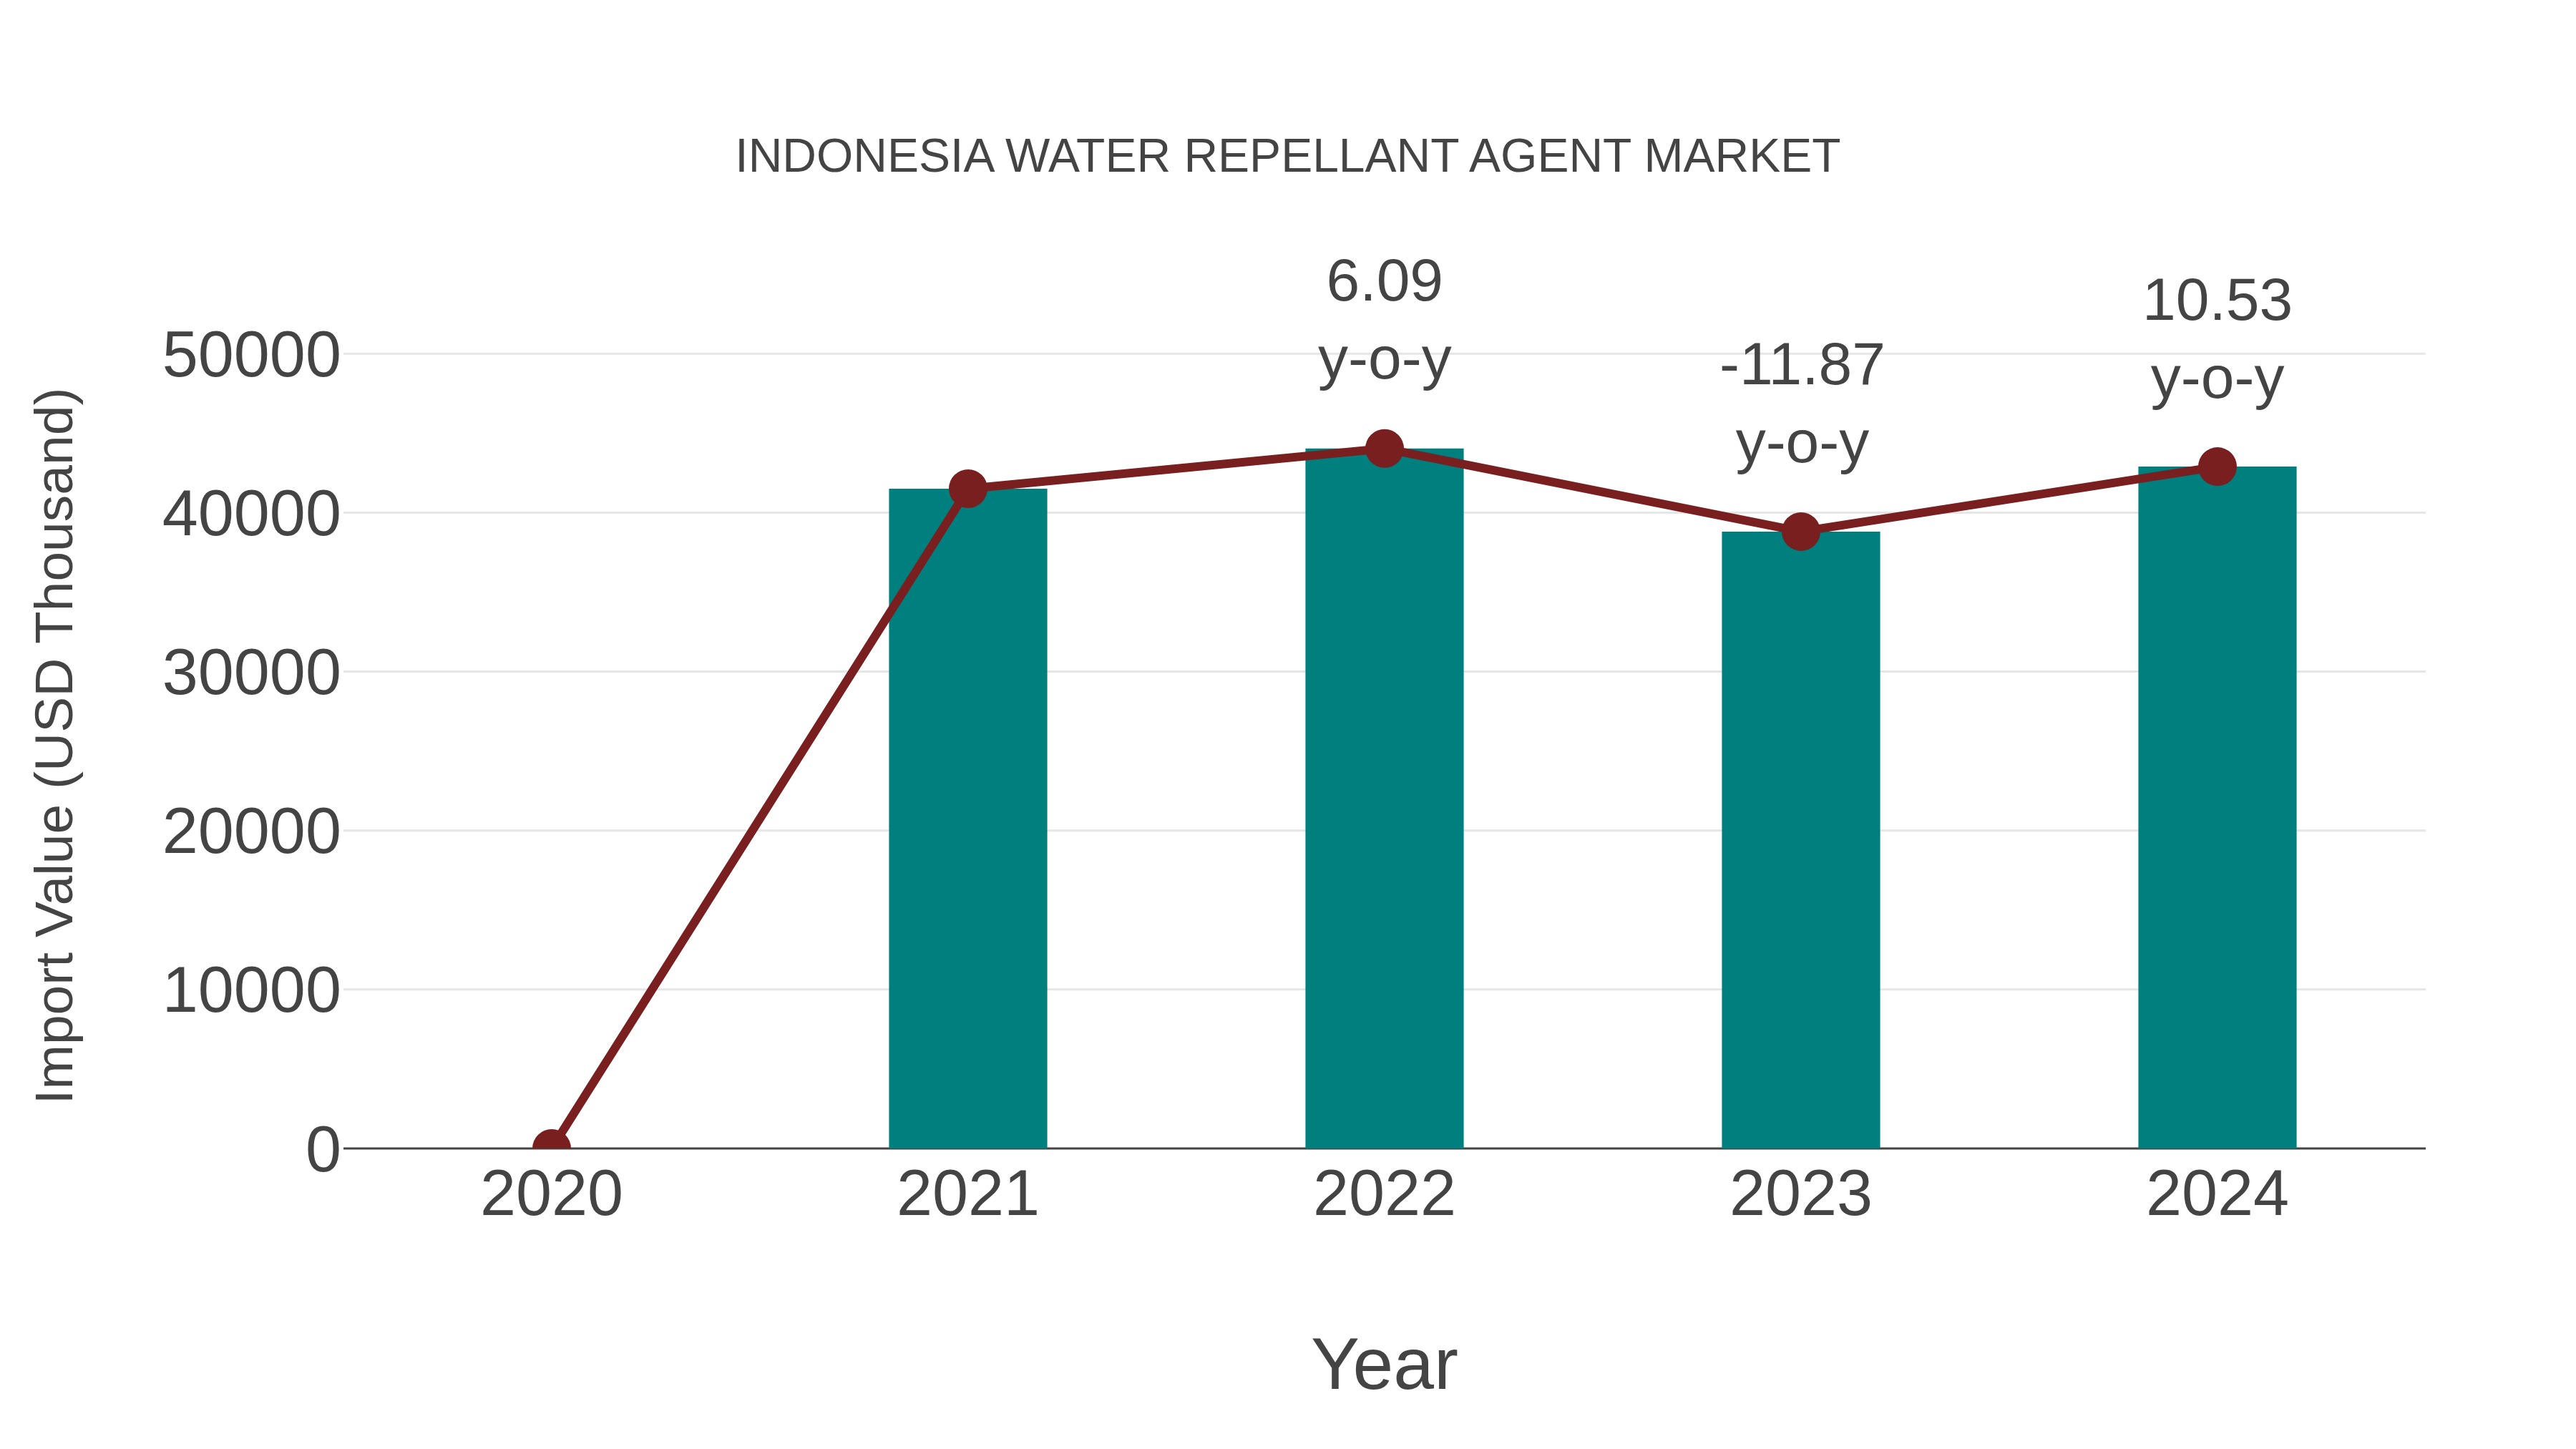
Indonesia Water Repellant Agent Market: Import Trend Analysis
In the Indonesia water repellant agent market, the import trend showed a growth rate of 10.53% from 2023 to 2024, with a compound annual growth rate (CAGR) of 1.1% from 2020 to 2024. This import momentum can be attributed to a gradual demand shift towards more advanced water repellant solutions, reflecting market stability and evolving consumer preferences for higher-quality products.
Indonesia Water Repellant Agent Market Synopsis
The market for water repellent agents in Indonesia is witnessing significant growth due to the country`s tropical climate and the need for waterproofing solutions. These agents are widely used in the construction industry to protect buildings, roads, and other structures from water damage. With the ongoing infrastructure development projects in Indonesia, the demand for water repellent agents is expected to remain strong. Additionally, the increasing awareness of the importance of waterproofing in the construction sector is driving market growth. Manufacturers are focusing on developing advanced and environmentally friendly repellent agents to cater to the evolving needs of the construction industry.
Drivers of the Market
The Indonesia Water Repellant Agent market is on the rise, driven by several key factors. Firstly, the construction industry`s growth and the need for effective waterproofing solutions in buildings and infrastructure projects have significantly boosted the demand for water repellent agents. These agents play a crucial role in preventing water damage and increasing the longevity of structures. Moreover, the tropical climate in Indonesia, characterized by heavy rainfall, emphasizes the importance of water repellent agents in protecting buildings from moisture-related issues. Additionally, the increasing awareness of the benefits of waterproofing for reducing maintenance costs and enhancing property value contributes to market growth. Furthermore, the market benefits from the use of water repellent agents in the textile and automotive industries. In summary, the market`s growth is driven by the construction sector`s expansion and the need for water protection solutions in a climate-prone to heavy rains.
Challenges of the Market
One of the primary challenges for the water repellent agent market in Indonesia is the need for products that can withstand the country`s tropical climate, including heavy rainfall. Manufacturers must continually innovate to develop water repellent agents that provide long-lasting protection. Regulatory compliance and environmental concerns also impact product formulation and marketing.
COVID-19 Impact on the Market
The Water Repellant Agent market was impacted by the COVID-19 pandemic as construction and manufacturing activities slowed down. This reduced the immediate need for such agents. However, with increased emphasis on hygiene and waterproofing in various industries, the market regained momentum as businesses adapted to new health and safety requirements.
Key Players in the Market
Leading players in the Indonesia Water Repellant Agent market include XYZ Chemicals, AquaShield Coatings, and HydroGuard Technologies. These companies offer a range of advanced water-repellent solutions designed to meet the specific requirements of Indonesian customers.
Key Highlights of the Report:
- Indonesia Water Repellant Agent Market Outlook
- Market Size of Indonesia Water Repellant Agent Market, 2025
- Forecast of Indonesia Water Repellant Agent Market, 2032
- Historical Data and Forecast of Indonesia Water Repellant Agent Revenues & Volume for the Period 2022-2032F
- Indonesia Water Repellant Agent Market Trend Evolution
- Indonesia Water Repellant Agent Market Drivers and Challenges
- Indonesia Water Repellant Agent Price Trends
- Indonesia Water Repellant Agent Porter's Five Forces
- Indonesia Water Repellant Agent Industry Life Cycle
- Historical Data and Forecast of Indonesia Water Repellant Agent Market Revenues & Volume By Product Type for the Period 2022-2032F
- Historical Data and Forecast of Indonesia Water Repellant Agent Market Revenues & Volume By Polyurethane for the Period 2022-2032F
- Historical Data and Forecast of Indonesia Water Repellant Agent Market Revenues & Volume By Teflon for the Period 2022-2032F
- Historical Data and Forecast of Indonesia Water Repellant Agent Market Revenues & Volume By Silicones for the Period 2022-2032F
- Historical Data and Forecast of Indonesia Water Repellant Agent Market Revenues & Volume By Technology for the Period 2022-2032F
- Historical Data and Forecast of Indonesia Water Repellant Agent Market Revenues & Volume By Water-Based for the Period 2022-2032F
- Historical Data and Forecast of Indonesia Water Repellant Agent Market Revenues & Volume By Solvent-Based for the Period 2022-2032F
- Historical Data and Forecast of Indonesia Water Repellant Agent Market Revenues & Volume By Others for the Period 2022-2032F
- Historical Data and Forecast of Indonesia Water Repellant Agent Market Revenues & Volume By End Use for the Period 2022-2032F
- Historical Data and Forecast of Indonesia Water Repellant Agent Market Revenues & Volume By Textiles for the Period 2022-2032F
- Historical Data and Forecast of Indonesia Water Repellant Agent Market Revenues & Volume By Construction for the Period 2022-2032F
- Historical Data and Forecast of Indonesia Water Repellant Agent Market Revenues & Volume By Automotive for the Period 2022-2032F
- Historical Data and Forecast of Indonesia Water Repellant Agent Market Revenues & Volume By Medical for the Period 2022-2032F
- Historical Data and Forecast of Indonesia Water Repellant Agent Market Revenues & Volume By Others for the Period 2022-2032F
- Indonesia Water Repellant Agent Import Export Trade Statistics
- Market Opportunity Assessment By Product Type
- Market Opportunity Assessment By Technology
- Market Opportunity Assessment By End Use
- Indonesia Water Repellant Agent Top Companies Market Share
- Indonesia Water Repellant Agent Competitive Benchmarking By Technical and Operational Parameters
- Indonesia Water Repellant Agent Company Profiles
- Indonesia Water Repellant Agent Key Strategic Recommendations
Indonesia Water Repellant Agent Market (2026-2032): FAQs
6Wresearch actively monitors the Indonesia Water Repellant Agent Market and publishes its comprehensive annual report, highlighting emerging trends, growth drivers, revenue analysis, and forecast outlook. Our insights help businesses to make data-backed strategic decisions with ongoing market dynamics. Our analysts track relevent industries related to the Indonesia Water Repellant Agent Market, allowing our clients with actionable intelligence and reliable forecasts tailored to emerging regional needs.
Yes, we provide customisation as per your requirements. To learn more, feel free to contact us on sales@6wresearch.com
1 Executive Summary |
2 Introduction |
2.1 Key Highlights of the Report |
2.2 Report Description |
2.3 Market Scope & Segmentation |
2.4 Research Methodology |
2.5 Assumptions |
3 Indonesia Water Repellant Agent Market Overview |
3.1 Indonesia Country Macro Economic Indicators |
3.2 Indonesia Water Repellant Agent Market Revenues & Volume, 2022 & 2032F |
3.3 Indonesia Water Repellant Agent Market - Industry Life Cycle |
3.4 Indonesia Water Repellant Agent Market - Porter's Five Forces |
3.5 Indonesia Water Repellant Agent Market Revenues & Volume Share, By Product Type, 2022 & 2032F |
3.6 Indonesia Water Repellant Agent Market Revenues & Volume Share, By Technology, 2022 & 2032F |
3.7 Indonesia Water Repellant Agent Market Revenues & Volume Share, By End Use, 2022 & 2032F |
4 Indonesia Water Repellant Agent Market Dynamics |
4.1 Impact Analysis |
4.2 Market Drivers |
4.2.1 Increasing awareness about the benefits of using water repellent agents in Indonesia. |
4.2.2 Growing construction and infrastructure development activities in the country. |
4.2.3 Rising demand for high-quality water repellent agents due to changing weather patterns. |
4.3 Market Restraints |
4.3.1 Lack of standardized regulations for the use of water repellent agents in Indonesia. |
4.3.2 Presence of low-cost alternatives affecting the market for premium water repellent agents. |
4.3.3 Limited availability of skilled labor for the application of water repellent agents. |
5 Indonesia Water Repellant Agent Market Trends |
6 Indonesia Water Repellant Agent Market, By Types |
6.1 Indonesia Water Repellant Agent Market, By Product Type |
6.1.1 Overview and Analysis |
6.1.2 Indonesia Water Repellant Agent Market Revenues & Volume, By Product Type, 2022-2032F |
6.1.3 Indonesia Water Repellant Agent Market Revenues & Volume, By Polyurethane, 2022-2032F |
6.1.4 Indonesia Water Repellant Agent Market Revenues & Volume, By Teflon, 2022-2032F |
6.1.5 Indonesia Water Repellant Agent Market Revenues & Volume, By Silicones, 2022-2032F |
6.2 Indonesia Water Repellant Agent Market, By Technology |
6.2.1 Overview and Analysis |
6.2.2 Indonesia Water Repellant Agent Market Revenues & Volume, By Water-Based, 2022-2032F |
6.2.3 Indonesia Water Repellant Agent Market Revenues & Volume, By Solvent-Based, 2022-2032F |
6.2.4 Indonesia Water Repellant Agent Market Revenues & Volume, By Others, 2022-2032F |
6.3 Indonesia Water Repellant Agent Market, By End Use |
6.3.1 Overview and Analysis |
6.3.2 Indonesia Water Repellant Agent Market Revenues & Volume, By Textiles, 2022-2032F |
6.3.3 Indonesia Water Repellant Agent Market Revenues & Volume, By Construction, 2022-2032F |
6.3.4 Indonesia Water Repellant Agent Market Revenues & Volume, By Automotive, 2022-2032F |
6.3.5 Indonesia Water Repellant Agent Market Revenues & Volume, By Medical, 2022-2032F |
6.3.6 Indonesia Water Repellant Agent Market Revenues & Volume, By Others, 2022-2032F |
7 Indonesia Water Repellant Agent Market Import-Export Trade Statistics |
7.1 Indonesia Water Repellant Agent Market Export to Major Countries |
7.2 Indonesia Water Repellant Agent Market Imports from Major Countries |
8 Indonesia Water Repellant Agent Market Key Performance Indicators |
8.1 Number of research studies or articles published on the benefits of water repellent agents in Indonesia. |
8.2 Percentage increase in construction permits issued in the country. |
8.3 Adoption rate of eco-friendly water repellent agents in the market. |
8.4 Number of training programs conducted for enhancing application skills of water repellent agents. |
8.5 Growth in the number of partnerships or collaborations between manufacturers and construction companies for promoting water repellent agents. |
9 Indonesia Water Repellant Agent Market - Opportunity Assessment |
9.1 Indonesia Water Repellant Agent Market Opportunity Assessment, By Product Type, 2022 & 2032F |
9.2 Indonesia Water Repellant Agent Market Opportunity Assessment, By Technology, 2022 & 2032F |
9.3 Indonesia Water Repellant Agent Market Opportunity Assessment, By End Use, 2022 & 2032F |
10 Indonesia Water Repellant Agent Market - Competitive Landscape |
10.1 Indonesia Water Repellant Agent Market Revenue Share, By Companies, 2025 |
10.2 Indonesia Water Repellant Agent Market Competitive Benchmarking, By Operating and Technical Parameters |
11 Company Profiles |
12 Recommendations |
13 Disclaimer |
Global Go To Market Strategy - 2030
Export potential enables firms to identify high-growth global markets with greater confidence by combining advanced trade intelligence with a structured quantitative methodology. The framework analyzes emerging demand trends and country-level import patterns while integrating macroeconomic and trade datasets such as GDP and population forecasts, bilateral import–export flows, tariff structures, elasticity differentials between developed and developing economies, geographic distance, and import demand projections. Using weighted trade values from 2020–2024 as the base period to project country-to-country export potential for 2030, these inputs are operationalized through calculated drivers such as gravity model parameters, tariff impact factors, and projected GDP per-capita growth. Through an analysis of hidden potentials, demand hotspots, and market conditions that are most favorable to success, this method enables firms to focus on target countries, maximize returns, and global expansion with data, backed by accuracy.
By factoring in the projected importer demand gap that is currently unmet and could be potential opportunity, it identifies the potential for the Exporter (Country) among 190 countries, against the general trade analysis, which identifies the biggest importer or exporter.
To discover high-growth global markets and optimize your business strategy:
Click Here
Pricing
- Single User License$ 1,995
- Department License$ 2,400
- Site License$ 3,120
- Global License$ 3,795

Leadership Perspectives from Industry Events
Search
Thought Leadership and Analyst Meet


Our Clients
6WResearch In News
- India Air Conditioner Market Set for Strong Rebound in 2026 After Weather-Led Correction and GST-Driven Recovery: 6Wresearch
- ADAS in India: How Automatic Emergency Braking, Blind Spot Detection & Driver Monitoring are Transforming Road Safety
- Doha a strategic location for EV manufacturing hub: IPA Qatar
- Demand for luxury TVs surging in the GCC, says Samsung
- Empowering Growth: The Thriving Journey of Bangladesh’s Cable Industry
- Demand for luxury TVs surging in the GCC, says Samsung
Latest Reports
- Nicaragua RPG Gaming Market (2026-2032)
- New Zealand RPG Gaming Market (2026-2032)
- Netherlands RPG Gaming Market (2026-2032)
- Nauru RPG Gaming Market (2026-2032)
- Namibia RPG Gaming Market (2026-2032)
- Mozambique RPG Gaming Market (2026-2032)
- Montenegro RPG Gaming Market (2026-2032)
- Mongolia RPG Gaming Market (2026-2032)
- Monaco RPG Gaming Market (2026-2032)
- Micronesia RPG Gaming Market (2026-2032)
Industry Events and Analyst Meet

HIMTEX 2026

India Refining Summit 2026

India EV Show 2026

EV tech India Expo 2026

Auto Tech Asia 2026
Whitepaper
- Middle East & Africa Commercial Security Market Click here to view more.
- Middle East & Africa Fire Safety Systems & Equipment Market Click here to view more.
- GCC Drone Market Click here to view more.
- Middle East Lighting Fixture Market Click here to view more.
- GCC Physical & Perimeter Security Market Click here to view more.