Indonesia Wire and Spring Products Market (2026-2032) | Forecast, Growth, Revenue, Industry, Share, Companies, Trends, Outlook, Analysis, Size & Value
Market Forecast By Type (Fabricated wire, Light gauge, Heavy gauge springs), By Metal Derivative (Aluminum based, Barbed, Copper based, Coated electrodes), By Applications (Automotive, Aerospace, Government, Medical & healthcare, Commercial & industrial sectors) And Competitive Landscape
| Product Code: ETC053648 | Publication Date: Jul 2023 | Updated Date: Jun 2026 | Product Type: Report | |
| Publisher: 6Wresearch | Author: Ravi Bhandari | No. of Pages: 70 | No. of Figures: 35 | No. of Tables: 5 |
Indonesia Wire and Spring Products Market Size, Share & Growth Rate
The Indonesia Wire and Spring Products Market was estimated at USD 389 Million in 2025 and is projected to reach USD 516 Million by 2032, growing at a CAGR of 4.1% from 2026 to 2032. This robust growth trajectory is driven by escalating investments in Indonesia’s infrastructure sector, which includes extensive projects in transportation and energy. Additionally, the rising demand for automotive parts, both in original equipment manufacturing and aftermarket segments, significantly fuels the market as consumers increasingly seek high-quality wire and spring components.
Indonesia Wire and Spring Products Market Growth Rate Analysis (2021-2032)
The Indonesia Wire and Spring Products Market experienced a notable rebound following a decline of 0.9% in 2021, spurred by several key factors. A robust 4.4% growth in 2022 transitioned into an impressive 5.9% increase in 2023, driven by escalating consumer demand across construction and automotive sectors, alongside significant investments in infrastructure development. This upward trend is expected to continue, stabilizing around 5.6% in both 2024 and 2025. The energy transition and advancements in manufacturing technology further enhance production efficiency, contributing to an anticipated growth of 5.7% by 2032. Such dynamics underscore the market’s resilience amidst evolving industrial landscapes, positioning it favorably within the region.
Indonesia Wire and Spring Products Market Year-wise Growth Rate and Key Drivers
This graph highlights how the Indonesia Wire and Spring Products Market has steadily grown over the past five years, supported by major growth factors.
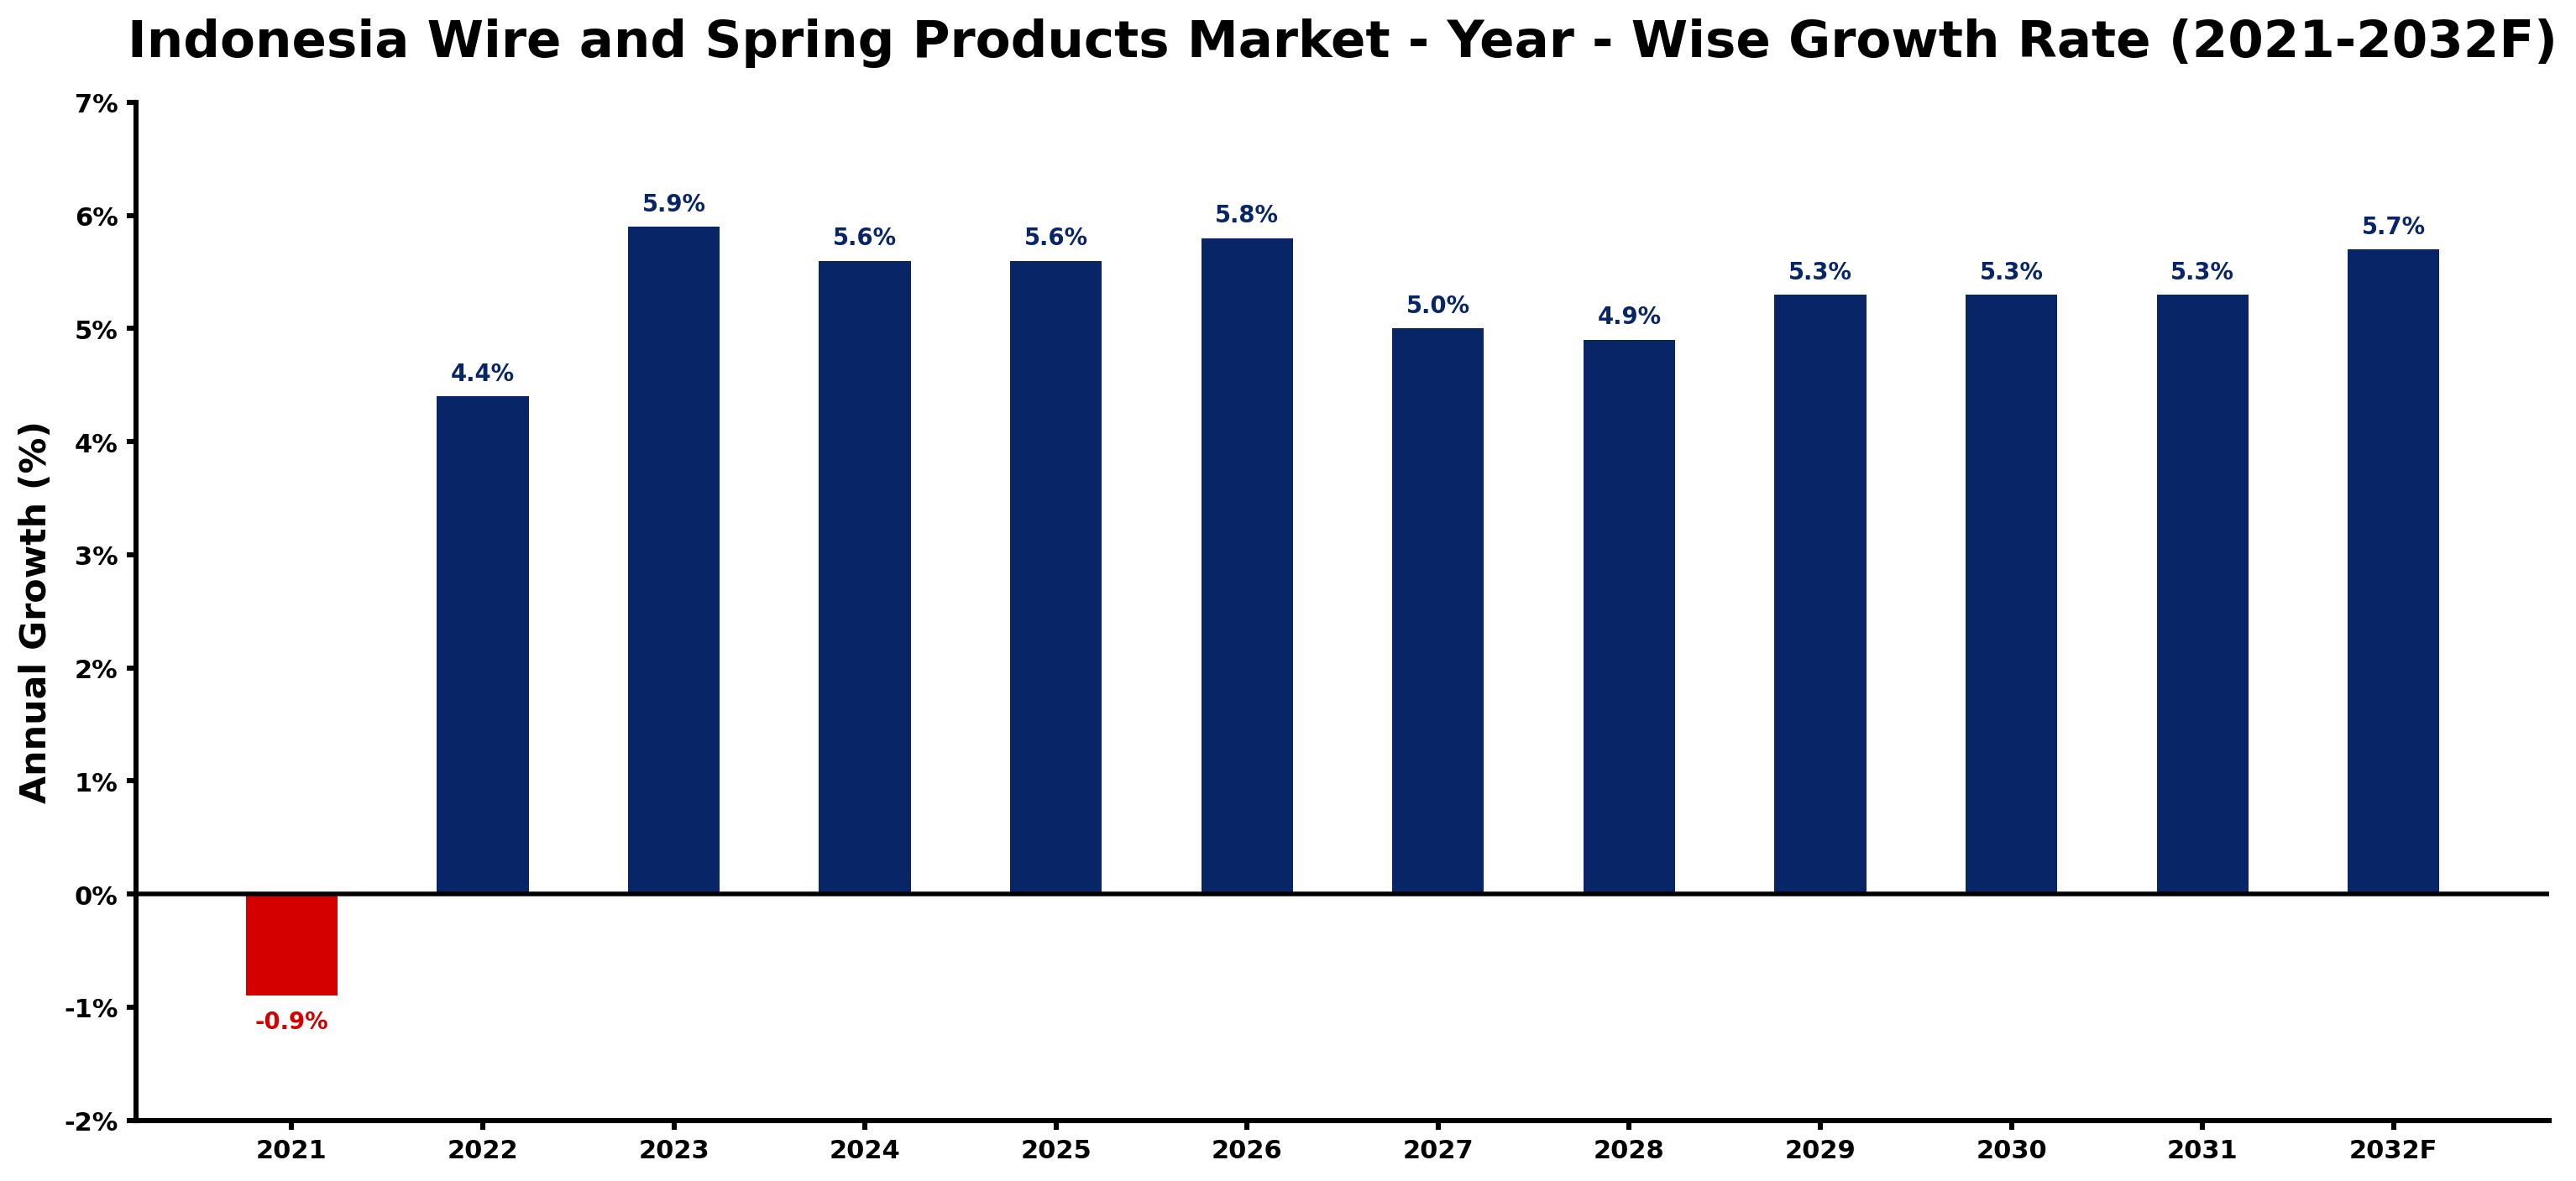
The table below presents the year‑wise growth rates along with the key drivers influencing the market
| Year | Growth Rate | Major Drivers |
| 2021 | -0.9% | Increasing industrial automation investments |
| 2022 | 4.4% | Increasing adoption of advanced technologies |
| 2023 | 5.9% | Rising electricity demand across industries |
| 2024 | 5.6% | Increasing smart city development projects |
| 2025 | 5.6% | Government infrastructure modernization initiatives |
| 2026 | 5.8% | Increasing adoption of advanced technologies |
| 2027 | 5.0% | Increasing adoption of advanced technologies |
| 2028 | 4.9% | Growing renewable energy integration projects |
| 2029 | 5.3% | Growing renewable energy integration projects |
| 2030 | 5.3% | Increasing adoption of advanced technologies |
| 2031 | 5.3% | Expansion of manufacturing activities |
| 2032 | 5.7% | Rapid growth in telecom and data center sectors |
Note - Market size estimations and growth projections presented in this report are based on 6Wresearch’s advanced forecasting approach, validated with industry datasets as of June 2026.
Indonesia Wire and Spring Products Market Synopsis
A surge in infrastructure development projects, backed by significant government investment, is the most potent force shaping the Indonesia Wire and Spring Products Market. The drive to transform Indonesia into one of the world’s ten largest economies by 2030 has resulted in increased demand for construction materials, including wires and springs.
Moreover, rapid industrialization across various sectors is intensifying the demand for high-precision wire and spring products. These components are critical in industries ranging from automotive to aerospace, where their applications vary extensively, further propelling market expansion.
Indonesia Wire and Spring Products Market Key Takeaways
- Infrastructure development projects are a primary driver of market growth, with a focus on transportation and energy sectors.
- The increasing automotive aftermarket contributes significantly to the rising demand for wire and spring products.
- High-quality and precision-engineered components are becoming the standard due to industrialization.
- The government’s economic initiatives promote substantial investments in construction and public facilities.
- Emerging technologies are enhancing production efficiencies, offering further potential for market growth.
Evaluation of Restraints in Indonesia Wire and Spring Products Market
Despite the positive outlook for the Indonesia Wire and Spring Products Market, several restraints exist. Fluctuations in raw material prices, primarily steel, can adversely affect manufacturing costs and, subsequently, product pricing. Additionally, while infrastructure investments are increasing, the execution of projects can be hampered by bureaucratic inefficiencies and regulatory hurdles, which may delay market growth. Lastly, the competitive landscape, featuring numerous local and international players, puts pressure on profit margins and necessitates continuous innovation to maintain market position.
Indonesia Wire and Spring Products Market Trends
Current trends in the Indonesia Wire and Spring Products Market indicate a strong shift towards sustainability and eco-friendly manufacturing practices. Companies are increasingly adopting materials and processes that minimize environmental impact. Additionally, advancements in technology such as automation and 3D printing are revolutionizing production methods, enabling manufacturers to enhance efficiency and precision while reducing lead times. The rising trend of electric vehicles also presents new applications for spring and wire products, further diversifying demand sources.
Indonesia Wire and Spring Products Market Opportunities
The market presents significant opportunities for growth, particularly in niche segments such as custom wire forms and specialized springs for advanced applications. As industries strive for greater efficiency and performance, the demand for tailored solutions is expected to rise. Additionally, the growing trend towards electric and hybrid vehicles creates avenues for innovation, as these technologies require lightweight and high-performance spring systems. Investments in research and development could yield new products that meet the evolving needs of various sectors.
Government Initiatives in the Indonesia Wire and Spring Products Market
The Indonesian government has undertaken various initiatives aimed at bolstering the wire and spring products market. Substantial investments in infrastructure and energy projects are part of a broader strategy to stimulate economic growth. Additionally, policies promoting local manufacturing and reducing import barriers provide a favorable environment for domestic producers. Efforts to streamline regulatory processes further encourage investment in the sector, enhancing the competitiveness of local manufacturers in both domestic and export markets.
Future Insights of the Indonesia Wire and Spring Products Market
Looking ahead to 2026-2032, the Indonesia Wire and Spring Products Market is poised for continued growth driven by ongoing infrastructure projects and rising consumer demand. The emphasis on high-quality, precision-engineered components will likely shape the competitive landscape. Furthermore, as the global shift towards sustainability accelerates, manufacturers will need to innovate to align with environmental standards, providing a dual opportunity for growth and differentiation. This evolving landscape promises exciting opportunities for stakeholders in the wire and spring products sector.
Indonesia Wire and Spring Products Market Latest Developments (May 2025 - June 2026)
In recent months, the Indonesia Wire and Spring Products Market has witnessed several notable trends. Increasing collaborations between manufacturers and technology firms are fostering innovation in product development and production efficiency. Additionally, advancements in manufacturing technologies such as automation and AI have begun to reshape operational approaches. The heightened focus on sustainability is prompting companies to explore eco-friendly materials and processes, signaling a shift in market dynamics as stakeholders adapt to new consumer preferences and regulatory requirements.
Indonesia Wire and Spring Products Market - Key Attractiveness of the Report
- 10 Years of Market Numbers
- Historical Data Starting from 2022 to 2025
- Base Year: 2025
- Forecast Data until 2032
- Key Performance Indicators Impacting the Market
- Major Upcoming Developments and Projects
Key Highlights of the Report:
- Indonesia Wire and Spring Products Market Outlook
- Market Size of Indonesia Wire and Spring Products Market, 2025
- Forecast of Indonesia Wire and Spring Products Market, 2032F
- Historical Data and Forecast of Indonesia Wire and Spring Products Revenues & Volume for the Period 2022-2032F
- Indonesia Wire and Spring Products Market Trend Evolution
- Indonesia Wire and Spring Products Market Drivers and Challenges
- Indonesia Wire and Spring Products Price Trends
- Indonesia Wire and Spring Products Porter's Five Forces
- Indonesia Wire and Spring Products Industry Life Cycle
- Historical Data and Forecast of Indonesia Wire and Spring Products Market Revenues & Volume By Type for the Period 2022-2032F
- Historical Data and Forecast of Indonesia Wire and Spring Products Market Revenues & Volume By Fabricated wire for the Period 2022-2032F
- Historical Data and Forecast of Indonesia Wire and Spring Products Market Revenues & Volume By Light gauge for the Period 2022-2032F
- Historical Data and Forecast of Indonesia Wire and Spring Products Market Revenues & Volume By Heavy gauge springs for the Period 2022-2032F
- Historical Data and Forecast of Indonesia Wire and Spring Products Market Revenues & Volume By Metal Derivative for the Period 2022-2032F
- Historical Data and Forecast of Indonesia Wire and Spring Products Market Revenues & Volume By Aluminum based for the Period 2022-2032F
- Historical Data and Forecast of Indonesia Wire and Spring Products Market Revenues & Volume By Barbed for the Period 2022-2032F
- Historical Data and Forecast of Indonesia Wire and Spring Products Market Revenues & Volume By Copper based for the Period 2022-2032F
- Historical Data and Forecast of Indonesia Wire and Spring Products Market Revenues & Volume By Coated electrodes for the Period 2022-2032F
- Historical Data and Forecast of Indonesia Wire and Spring Products Market Revenues & Volume By Applications for the Period 2022-2032F
- Historical Data and Forecast of Indonesia Wire and Spring Products Market Revenues & Volume By Automotive for the Period 2022-2032F
- Historical Data and Forecast of Indonesia Wire and Spring Products Market Revenues & Volume By Aerospace for the Period 2022-2032F
- Historical Data and Forecast of Indonesia Wire and Spring Products Market Revenues & Volume By Government for the Period 2022-2032F
- Historical Data and Forecast of Indonesia Wire and Spring Products Market Revenues & Volume By Medical & healthcare for the Period 2022-2032F
- Historical Data and Forecast of Indonesia Wire and Spring Products Market Revenues & Volume By Commercial & industrial sectors for the Period 2022-2032F
- Indonesia Wire and Spring Products Import Export Trade Statistics
- Market Opportunity Assessment By Type
- Market Opportunity Assessment By Metal Derivative
- Market Opportunity Assessment By Applications
- Indonesia Wire and Spring Products Top Companies Market Share
- Indonesia Wire and Spring Products Competitive Benchmarking By Technical and Operational Parameters
- Indonesia Wire and Spring Products Company Profiles
- Indonesia Wire and Spring Products Key Strategic Recommendations
Indonesia Wire and Spring Products Market - Frequently Asked Questions
The growth is primarily driven by government investments in infrastructure, rising automotive aftermarket demands, and the need for precision-engineered products due to industrialization.
The market was estimated at USD 389 Million in 2025 and is projected to reach USD 516 Million by 2032, reflecting a CAGR of 4.1% from 2026 to 2032.
Wire and spring products find applications across various sectors, including automotive, aerospace, construction, and furniture, showcasing their versatility.
Sustainability is increasingly becoming a priority, with manufacturers exploring eco-friendly materials and practices in response to consumer demand and regulatory pressures.
Government initiatives and investments in infrastructure significantly boost the demand for wire and spring products, while policies favoring local manufacturing enhance competitiveness.
6Wresearch actively monitors the Indonesia Wire and Spring Products Market and publishes its comprehensive annual report, highlighting emerging trends, growth drivers, revenue analysis, and forecast outlook. Our insights help businesses to make data-backed strategic decisions with ongoing market dynamics. Our analysts track relevent industries related to the Indonesia Wire and Spring Products Market, allowing our clients with actionable intelligence and reliable forecasts tailored to emerging regional needs.
Yes, we provide customisation as per your requirements. To learn more, feel free to contact us on sales@6wresearch.com
1 Executive Summary |
2 Introduction |
2.1 Key Highlights of the Report |
2.2 Report Description |
2.3 Market Scope & Segmentation |
2.4 Research Methodology |
2.5 Assumptions |
3 Indonesia Wire and Spring Products Market Overview |
3.1 Indonesia Country Macro Economic Indicators |
3.2 Indonesia Wire and Spring Products Market Revenues & Volume, 2022 & 2032F |
3.3 Indonesia Wire and Spring Products Market - Industry Life Cycle |
3.4 Indonesia Wire and Spring Products Market - Porter's Five Forces |
3.5 Indonesia Wire and Spring Products Market Revenues & Volume Share, By Type, 2022 & 2032F |
3.6 Indonesia Wire and Spring Products Market Revenues & Volume Share, By Metal Derivative, 2022 & 2032F |
3.7 Indonesia Wire and Spring Products Market Revenues & Volume Share, By Applications, 2022 & 2032F |
4 Indonesia Wire and Spring Products Market Dynamics |
4.1 Impact Analysis |
4.2 Market Drivers |
4.3 Market Restraints |
5 Indonesia Wire and Spring Products Market Trends |
6 Indonesia Wire and Spring Products Market, By Types |
6.1 Indonesia Wire and Spring Products Market, By Type |
6.1.1 Overview and Analysis |
6.1.2 Indonesia Wire and Spring Products Market Revenues & Volume, By Type, 2022-2032F |
6.1.3 Indonesia Wire and Spring Products Market Revenues & Volume, By Fabricated wire, 2022-2032F |
6.1.4 Indonesia Wire and Spring Products Market Revenues & Volume, By Light gauge, 2022-2032F |
6.1.5 Indonesia Wire and Spring Products Market Revenues & Volume, By Heavy gauge springs, 2022-2032F |
6.2 Indonesia Wire and Spring Products Market, By Metal Derivative |
6.2.1 Overview and Analysis |
6.2.2 Indonesia Wire and Spring Products Market Revenues & Volume, By Aluminum based, 2022-2032F |
6.2.3 Indonesia Wire and Spring Products Market Revenues & Volume, By Barbed, 2022-2032F |
6.2.4 Indonesia Wire and Spring Products Market Revenues & Volume, By Copper based, 2022-2032F |
6.2.5 Indonesia Wire and Spring Products Market Revenues & Volume, By Coated electrodes, 2022-2032F |
6.3 Indonesia Wire and Spring Products Market, By Applications |
6.3.1 Overview and Analysis |
6.3.2 Indonesia Wire and Spring Products Market Revenues & Volume, By Automotive, 2022-2032F |
6.3.3 Indonesia Wire and Spring Products Market Revenues & Volume, By Aerospace, 2022-2032F |
6.3.4 Indonesia Wire and Spring Products Market Revenues & Volume, By Government, 2022-2032F |
6.3.5 Indonesia Wire and Spring Products Market Revenues & Volume, By Medical & healthcare, 2022-2032F |
6.3.6 Indonesia Wire and Spring Products Market Revenues & Volume, By Commercial & industrial sectors, 2022-2032F |
7 Indonesia Wire and Spring Products Market Import-Export Trade Statistics |
7.1 Indonesia Wire and Spring Products Market Export to Major Countries |
7.2 Indonesia Wire and Spring Products Market Imports from Major Countries |
8 Indonesia Wire and Spring Products Market Key Performance Indicators |
9 Indonesia Wire and Spring Products Market - Opportunity Assessment |
9.1 Indonesia Wire and Spring Products Market Opportunity Assessment, By Type, 2022 & 2032F |
9.2 Indonesia Wire and Spring Products Market Opportunity Assessment, By Metal Derivative, 2022 & 2032F |
9.3 Indonesia Wire and Spring Products Market Opportunity Assessment, By Applications, 2022 & 2032F |
10 Indonesia Wire and Spring Products Market - Competitive Landscape |
10.1 Indonesia Wire and Spring Products Market Revenue Share, By Companies, 2025 |
10.2 Indonesia Wire and Spring Products Market Competitive Benchmarking, By Operating and Technical Parameters |
11 Company Profiles |
12 Recommendations |
13 Disclaimer |
Global Go To Market Strategy - 2030
Export potential enables firms to identify high-growth global markets with greater confidence by combining advanced trade intelligence with a structured quantitative methodology. The framework analyzes emerging demand trends and country-level import patterns while integrating macroeconomic and trade datasets such as GDP and population forecasts, bilateral import–export flows, tariff structures, elasticity differentials between developed and developing economies, geographic distance, and import demand projections. Using weighted trade values from 2020–2024 as the base period to project country-to-country export potential for 2030, these inputs are operationalized through calculated drivers such as gravity model parameters, tariff impact factors, and projected GDP per-capita growth. Through an analysis of hidden potentials, demand hotspots, and market conditions that are most favorable to success, this method enables firms to focus on target countries, maximize returns, and global expansion with data, backed by accuracy.
By factoring in the projected importer demand gap that is currently unmet and could be potential opportunity, it identifies the potential for the Exporter (Country) among 190 countries, against the general trade analysis, which identifies the biggest importer or exporter.
To discover high-growth global markets and optimize your business strategy:
Click Here
Pricing
- Single User License$ 1,995
- Department License$ 2,400
- Site License$ 3,120
- Global License$ 3,795

Leadership Perspectives from Industry Events
Search
Thought Leadership and Analyst Meet


Our Clients
6WResearch In News
- India Air Conditioner Market Set for Strong Rebound in 2026 After Weather-Led Correction and GST-Driven Recovery: 6Wresearch
- ADAS in India: How Automatic Emergency Braking, Blind Spot Detection & Driver Monitoring are Transforming Road Safety
- Doha a strategic location for EV manufacturing hub: IPA Qatar
- Demand for luxury TVs surging in the GCC, says Samsung
- Empowering Growth: The Thriving Journey of Bangladesh’s Cable Industry
- Demand for luxury TVs surging in the GCC, says Samsung
Latest Reports
- Nicaragua RPG Gaming Market (2026-2032)
- New Zealand RPG Gaming Market (2026-2032)
- Netherlands RPG Gaming Market (2026-2032)
- Nauru RPG Gaming Market (2026-2032)
- Namibia RPG Gaming Market (2026-2032)
- Mozambique RPG Gaming Market (2026-2032)
- Montenegro RPG Gaming Market (2026-2032)
- Mongolia RPG Gaming Market (2026-2032)
- Monaco RPG Gaming Market (2026-2032)
- Micronesia RPG Gaming Market (2026-2032)
Industry Events and Analyst Meet

HIMTEX 2026

India Refining Summit 2026

India EV Show 2026

EV tech India Expo 2026

Auto Tech Asia 2026
Whitepaper
- Middle East & Africa Commercial Security Market Click here to view more.
- Middle East & Africa Fire Safety Systems & Equipment Market Click here to view more.
- GCC Drone Market Click here to view more.
- Middle East Lighting Fixture Market Click here to view more.
- GCC Physical & Perimeter Security Market Click here to view more.