Iraq Tartaric acid Market (2026-2032) Outlook | Size, Analysis, Value, Forecast, Share, Trends, Growth, Revenue, Companies & Industry
Market Forecast By Source (Grapes & sun-dried raisins, Maleic anhydride, Others), By Application (Food & beverages, Pharmaceuticals, Cosmetics & personal care products, Others), By Type (Naturals, Synthetic) And Competitive Landscape
| Product Code: ETC085444 | Publication Date: Jun 2021 | Updated Date: Jun 2026 | Product Type: Report | |
| Publisher: 6Wresearch | Author: Dhaval Chaurasia | No. of Pages: 70 | No. of Figures: 35 | No. of Tables: 5 |
Iraq Tartaric acid Market Size, Share & Growth Rate
The Iraq Tartaric acid Market was estimated at USD 244 Million in 2025 and is projected to reach USD 342 Million by 2032, growing at a CAGR of 4.9% from 2026 to 2032. This trajectory is fueled by the increasing consumption of processed food, particularly in the burgeoning food and beverage industry. Additionally, the growth of the pharmaceutical sector and a rising consumer preference for natural additives are solidifying tartaric acid's role as a versatile ingredient across multiple applications.
Iraq Tartaric acid Market Year-wise Growth Rate and Key Drivers
This graph highlights how the Iraq Tartaric acid Market has steadily grown over the years, supported by major growth factors.
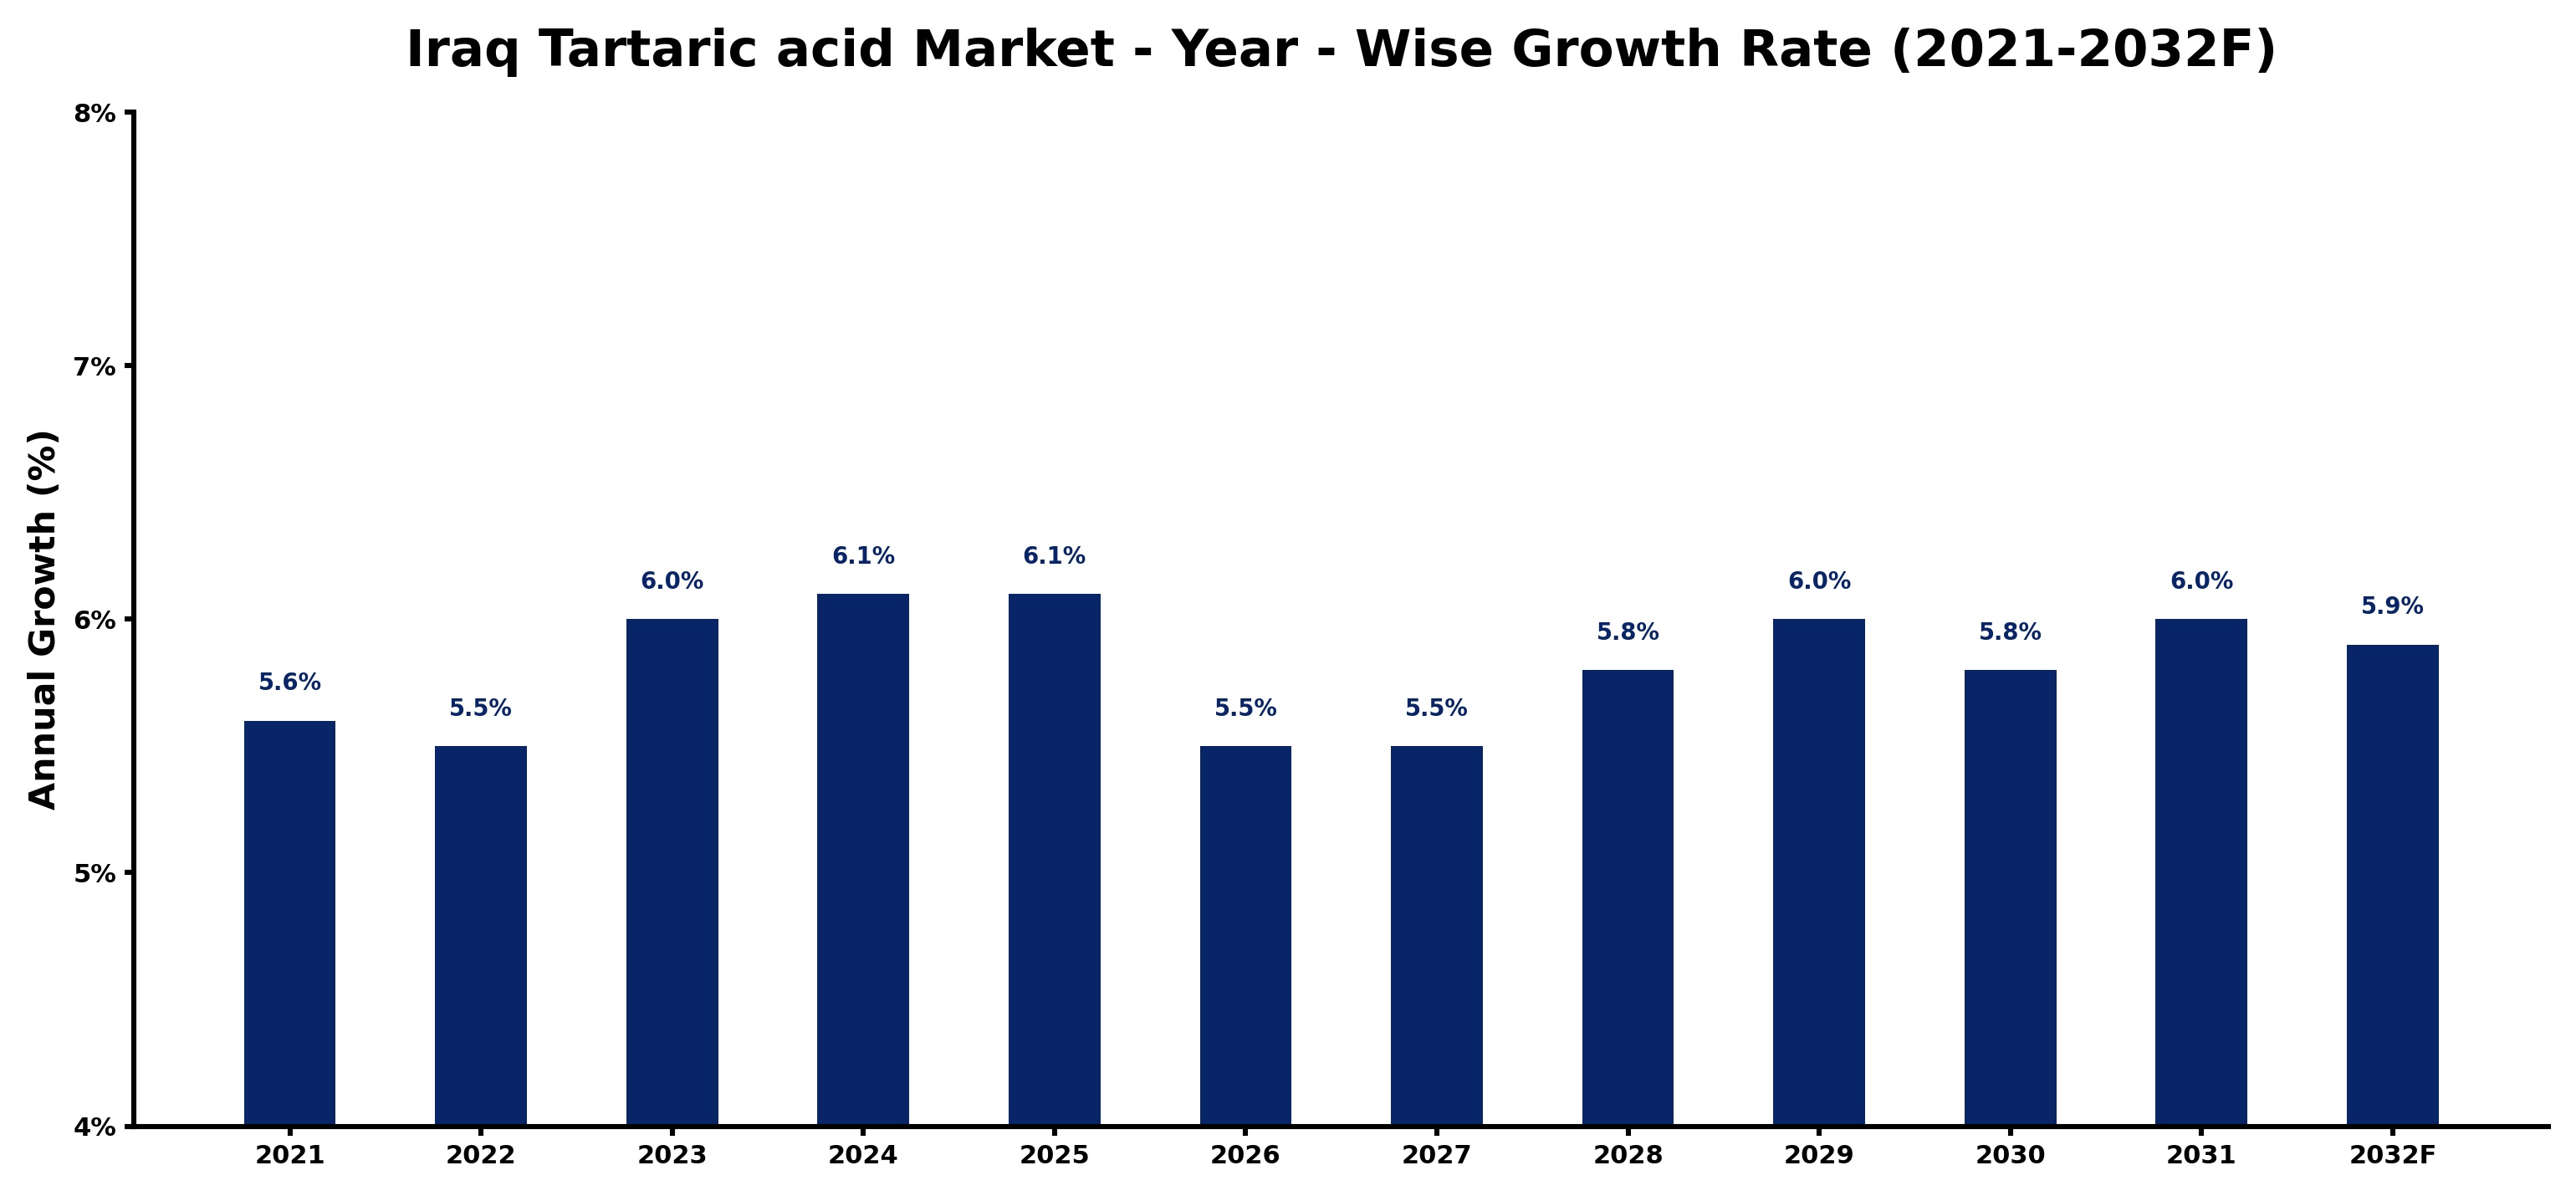
The table below presents the year‑wise growth rates along with the key drivers influencing the market
| Year | Growth Rate | Major Drivers |
| 2021 | 5.6% | Increasing smart city development projects |
| 2022 | 5.5% | Expansion of commercial construction activities |
| 2023 | 6.0% | Expansion of transportation and logistics networks |
| 2024 | 6.1% | Increasing industrial infrastructure investments |
| 2025 | 6.1% | Growing urbanization and commercial development |
| 2026 | 5.5% | Growing urbanization and commercial development |
| 2027 | 5.5% | Expansion of commercial construction activities |
| 2028 | 5.8% | Expansion of transportation and logistics networks |
| 2029 | 6.0% | Increasing industrial automation investments |
| 2030 | 5.8% | Rising electricity demand across industries |
| 2031 | 6.0% | Expansion of manufacturing activities |
| 2032 | 5.9% | Expansion of manufacturing activities |
Note - Market size estimations and growth projections presented in this report are based on 6Wresearch’s advanced forecasting approach, validated with industry datasets as of June 2026.
Iraq Tartaric acid Market Synopsis
The recent momentum in the Iraq Tartaric acid market reflects a vibrant landscape, with strong demand across food and beverage, pharmaceuticals, and cosmetics. As manufacturers innovate to meet consumer preferences, the market is set to expand even further. However, economic and political complexities continue to create a challenging backdrop.
Looking ahead, the market is poised for growth, driven by an increasing inclination toward health-conscious food choices and natural ingredients. With the local production efforts supported by governmental policies, there is an opportunity to establish a robust supply chain that aligns with international standards.
Iraq Tartaric acid Market Key Takeaways
- Steady growth anticipated, with a projected market size of USD 342 Million by 2032.
- Increasing demand from food and beverage, pharmaceutical, and cosmetic sectors.
- Rising consumer awareness about the benefits of natural additives driving market dynamics.
- Strategic government policies are designed to bolster local production and competitiveness.
- Investment opportunities highlighted by advancements in technology and infrastructure development.
Evaluation of Restraints in Iraq Tartaric acid Market
Despite the favorable growth trajectory, the Iraq Tartaric acid market faces significant restraints stemming from political instability and economic fluctuations. These factors can disrupt supply chains, making it difficult for manufacturers to maintain consistent production levels. The reliance on imported raw materials further exacerbates vulnerability, leaving the market susceptible to global pricing pressures. Additionally, the lack of a cohesive regulatory framework complicates operations for both local and foreign producers, hindering overall market fluidity.
Iraq Tartaric acid Market Trends
Several key trends are shaping the Iraq Tartaric acid market. Firstly, a growing emphasis on natural ingredients in food products is pushing manufacturers to incorporate tartaric acid due to its beneficial properties. The pharmaceutical industry's shift towards more sustainable and bio-based materials is also fostering innovation in applications involving tartaric acid. Moreover, the cosmetic sector is increasingly utilizing this compound for its natural exfoliating properties, which further enhances its appeal.
Iraq Tartaric acid Market Opportunities
The Iraq Tartaric acid market presents a multitude of investment opportunities for those looking to capitalize on emerging trends. The expansion of the food and beverage industry, combined with a surge in health-conscious consumer behavior, creates a robust environment for tartaric acid production. Additionally, advancements in agricultural technology and eco-friendly practices present avenues for innovation in its application, particularly in agrochemicals. Investors can benefit from strategic positioning within the market to tap into neighboring regions seeking quality tartaric acid.
Government Initiatives in the Iraq Tartaric acid Market
The Iraqi government has implemented several initiatives aimed at promoting the domestic tartaric acid market. This includes the establishment of tariffs to support local manufacturers and efforts to ensure compliance with international quality standards. Additionally, the government is facilitating a streamlined licensing process for manufacturers, aiming to improve production efficiency and sustainability. Through these efforts, policymakers are creating a more favorable landscape for domestic producers while addressing the need for quality assurance in both local and export markets.
Future Insights of the Iraq Tartaric acid Market
The future of the Iraq Tartaric acid market appears promising, with sustained growth anticipated through 2032. Factors such as increasing health awareness and a strong focus on natural ingredients are likely to drive demand across various sectors. Moreover, the continual evolution of consumer preferences toward sustainability could open new avenues for product innovation. As manufacturers adapt and align with these trends, the market is expected to achieve higher levels of resilience and profitability.
Iraq Tartaric acid Market Latest Developments (May 2025 - June 2026)
Recent developments in the Iraq Tartaric acid market highlight a concerted effort by local manufacturers to increase production capacity and enhance quality standards. Innovations in processing techniques have been introduced, aiming to improve yield efficiency while reducing costs. Furthermore, increased collaborations between government and private sector players are fostering a more robust research environment, paving the way for product enhancements and new applications in health and wellness sectors.
Iraq Tartaric acid Market - Key Attractiveness of the Report
- 10 Years of Market Numbers
- Historical Data Starting from 2022 to 2025
- Base Year: 2025
- Forecast Data until 2032
- Key Performance Indicators Impacting the Market
- Major Upcoming Developments and Projects
Key Highlights of the Report:
- Iraq Tartaric acid Market Outlook
- Market Size of Iraq Tartaric acid Market, 2025
- Forecast of Iraq Tartaric acid Market, 2032
- Historical Data and Forecast of Iraq Tartaric acid Revenues & Volume for the Period 2022-2032F
- Iraq Tartaric acid Market Trend Evolution
- Iraq Tartaric acid Market Drivers and Challenges
- Iraq Tartaric acid Price Trends
- Iraq Tartaric acid Porter's Five Forces
- Iraq Tartaric acid Industry Life Cycle
- Historical Data and Forecast of Iraq Tartaric acid Market Revenues & Volume By Source for the Period 2022-2032F
- Historical Data and Forecast of Iraq Tartaric acid Market Revenues & Volume By Grapes & sun-dried raisins for the Period 2022-2032F
- Historical Data and Forecast of Iraq Tartaric acid Market Revenues & Volume By Maleic anhydride for the Period 2022-2032F
- Historical Data and Forecast of Iraq Tartaric acid Market Revenues & Volume By Others for the Period 2022-2032F
- Historical Data and Forecast of Iraq Tartaric acid Market Revenues & Volume By Application for the Period 2022-2032F
- Historical Data and Forecast of Iraq Tartaric acid Market Revenues & Volume By Food & beverages for the Period 2022-2032F
- Historical Data and Forecast of Iraq Tartaric acid Market Revenues & Volume By Pharmaceuticals for the Period 2022-2032F
- Historical Data and Forecast of Iraq Tartaric acid Market Revenues & Volume By Cosmetics & personal care products for the Period 2022-2032F
- Historical Data and Forecast of Iraq Tartaric acid Market Revenues & Volume By Others for the Period 2022-2032F
- Historical Data and Forecast of Iraq Tartaric acid Market Revenues & Volume By Type for the Period 2022-2032F
- Historical Data and Forecast of Iraq Tartaric acid Market Revenues & Volume By Naturals for the Period 2022-2032F
- Historical Data and Forecast of Iraq Tartaric acid Market Revenues & Volume By Synthetic for the Period 2022-2032F
- Iraq Tartaric acid Import Export Trade Statistics
- Market Opportunity Assessment By Source
- Market Opportunity Assessment By Application
- Market Opportunity Assessment By Type
- Iraq Tartaric acid Top Companies Market Share
- Iraq Tartaric acid Competitive Benchmarking By Technical and Operational Parameters
- Iraq Tartaric acid Company Profiles
- Iraq Tartaric acid Key Strategic Recommendations
Iraq Tartaric acid Market - Frequently Asked Questions
The growth is mainly driven by increasing demand from food and beverage sectors, heightened awareness of natural ingredients, and expanding applications in pharmaceuticals and cosmetics.
The market is estimated at USD 244 Million in 2025 and is projected to reach USD 342 Million by 2032, growing at a CAGR of 4.9% from 2026 to 2032.
The government is focused on promoting local production through tariffs and quality regulations, while also streamlining the licensing process to enhance competitiveness.
Trends include a growing consumer preference for natural additives in food products and innovations in the cosmetic industry that leverage the beneficial properties of tartaric acid.
Manufacturers face challenges such as political instability, economic fluctuations, and a lack of cohesive regulatory frameworks that hinder production and supply chain efficiency.
6Wresearch actively monitors the Iraq Tartaric acid Market and publishes its comprehensive annual report, highlighting emerging trends, growth drivers, revenue analysis, and forecast outlook. Our insights help businesses to make data-backed strategic decisions with ongoing market dynamics. Our analysts track relevent industries related to the Iraq Tartaric acid Market, allowing our clients with actionable intelligence and reliable forecasts tailored to emerging regional needs.
Yes, we provide customisation as per your requirements. To learn more, feel free to contact us on sales@6wresearch.com
1 Executive Summary |
2 Introduction |
2.1 Key Highlights of the Report |
2.2 Report Description |
2.3 Market Scope & Segmentation |
2.4 Research Methodology |
2.5 Assumptions |
3 Iraq Tartaric acid Market Overview |
3.1 Iraq Country Macro Economic Indicators |
3.2 Iraq Tartaric acid Market Revenues & Volume, 2022 & 2032F |
3.3 Iraq Tartaric acid Market - Industry Life Cycle |
3.4 Iraq Tartaric acid Market - Porter's Five Forces |
3.5 Iraq Tartaric acid Market Revenues & Volume Share, By Source, 2022 & 2032F |
3.6 Iraq Tartaric acid Market Revenues & Volume Share, By Form, 2022 & 2032F |
3.7 Iraq Tartaric acid Market Revenues & Volume Share, By Type, 2022 & 2032F |
4 Iraq Tartaric acid Market Dynamics |
4.1 Impact Analysis |
4.2 Market Drivers |
4.3 Market Restraints |
5 Iraq Tartaric acid Market Trends |
6 Iraq Tartaric acid Market, By Types |
6.1 Iraq Tartaric acid Market, By Source |
6.1.1 Overview and Analysis |
6.1.2 Iraq Tartaric acid Market Revenues & Volume, By Source, 2022-2032F |
6.1.3 Iraq Tartaric acid Market Revenues & Volume, By Grapes & sun-dried raisins, 2022-2032F |
6.1.4 Iraq Tartaric acid Market Revenues & Volume, By Maleic anhydride, 2022-2032F |
6.1.5 Iraq Tartaric acid Market Revenues & Volume, By Others, 2022-2032F |
6.2 Iraq Tartaric acid Market, By Application |
6.2.1 Overview and Analysis |
6.2.2 Iraq Tartaric acid Market Revenues & Volume, By Food & beverages, 2022-2032F |
6.2.3 Iraq Tartaric acid Market Revenues & Volume, By Pharmaceuticals, 2022-2032F |
6.2.4 Iraq Tartaric acid Market Revenues & Volume, By Cosmetics & personal care products, 2022-2032F |
6.2.5 Iraq Tartaric acid Market Revenues & Volume, By Others, 2022-2032F |
6.3 Iraq Tartaric acid Market, By Type |
6.3.1 Overview and Analysis |
6.3.2 Iraq Tartaric acid Market Revenues & Volume, By Naturals, 2022-2032F |
6.3.3 Iraq Tartaric acid Market Revenues & Volume, By Synthetic, 2022-2032F |
7 Iraq Tartaric acid Market Import-Export Trade Statistics |
7.1 Iraq Tartaric acid Market Export to Major Countries |
7.2 Iraq Tartaric acid Market Imports from Major Countries |
8 Iraq Tartaric acid Market Key Performance Indicators |
9 Iraq Tartaric acid Market - Opportunity Assessment |
9.1 Iraq Tartaric acid Market Opportunity Assessment, By Source, 2022 & 2032F |
9.2 Iraq Tartaric acid Market Opportunity Assessment, By Application, 2022 & 2032F |
9.3 Iraq Tartaric acid Market Opportunity Assessment, By Type, 2022 & 2032F |
10 Iraq Tartaric acid Market - Competitive Landscape |
10.1 Iraq Tartaric acid Market Revenue Share, By Companies, 2025 |
10.2 Iraq Tartaric acid Market Competitive Benchmarking, By Operating and Technical Parameters |
11 Company Profiles |
12 Recommendations |
13 Disclaimer |
Global Go To Market Strategy - 2030
Export potential enables firms to identify high-growth global markets with greater confidence by combining advanced trade intelligence with a structured quantitative methodology. The framework analyzes emerging demand trends and country-level import patterns while integrating macroeconomic and trade datasets such as GDP and population forecasts, bilateral import–export flows, tariff structures, elasticity differentials between developed and developing economies, geographic distance, and import demand projections. Using weighted trade values from 2020–2024 as the base period to project country-to-country export potential for 2030, these inputs are operationalized through calculated drivers such as gravity model parameters, tariff impact factors, and projected GDP per-capita growth. Through an analysis of hidden potentials, demand hotspots, and market conditions that are most favorable to success, this method enables firms to focus on target countries, maximize returns, and global expansion with data, backed by accuracy.
By factoring in the projected importer demand gap that is currently unmet and could be potential opportunity, it identifies the potential for the Exporter (Country) among 190 countries, against the general trade analysis, which identifies the biggest importer or exporter.
To discover high-growth global markets and optimize your business strategy:
Click Here
Pricing
- Single User License$ 1,995
- Department License$ 2,400
- Site License$ 3,120
- Global License$ 3,795

Leadership Perspectives from Industry Events
Search
Thought Leadership and Analyst Meet


Our Clients
6WResearch In News
- India Air Conditioner Market Set for Strong Rebound in 2026 After Weather-Led Correction and GST-Driven Recovery: 6Wresearch
- ADAS in India: How Automatic Emergency Braking, Blind Spot Detection & Driver Monitoring are Transforming Road Safety
- Doha a strategic location for EV manufacturing hub: IPA Qatar
- Demand for luxury TVs surging in the GCC, says Samsung
- Empowering Growth: The Thriving Journey of Bangladesh’s Cable Industry
- Demand for luxury TVs surging in the GCC, says Samsung
Latest Reports
- Nicaragua RPG Gaming Market (2026-2032)
- New Zealand RPG Gaming Market (2026-2032)
- Netherlands RPG Gaming Market (2026-2032)
- Nauru RPG Gaming Market (2026-2032)
- Namibia RPG Gaming Market (2026-2032)
- Mozambique RPG Gaming Market (2026-2032)
- Montenegro RPG Gaming Market (2026-2032)
- Mongolia RPG Gaming Market (2026-2032)
- Monaco RPG Gaming Market (2026-2032)
- Micronesia RPG Gaming Market (2026-2032)
Industry Events and Analyst Meet

EV India Expo 2026

HIMTEX 2026

India Refining Summit 2026

India EV Show 2026

EV tech India Expo 2026
Whitepaper
- Middle East & Africa Commercial Security Market Click here to view more.
- Middle East & Africa Fire Safety Systems & Equipment Market Click here to view more.
- GCC Drone Market Click here to view more.
- Middle East Lighting Fixture Market Click here to view more.
- GCC Physical & Perimeter Security Market Click here to view more.