Israel Polymer Filler Market (2025-2031) | Size, Analysis, Segmentation, Share, Trends, Value, Forecast, Growth, Outlook, Companies, Revenue & Industry
Market Forecast By Type (Organic, Inorganic Oxides), By End User (Automotive, Building & Construction, Industrial, Packaging, Others) And Competitive Landscape
| Product Code: ETC5689104 | Publication Date: Nov 2023 | Updated Date: Nov 2025 | Product Type: Market Research Report | |
| Publisher: 6Wresearch | Author: Ravi Bhandari | No. of Pages: 60 | No. of Figures: 30 | No. of Tables: 5 |
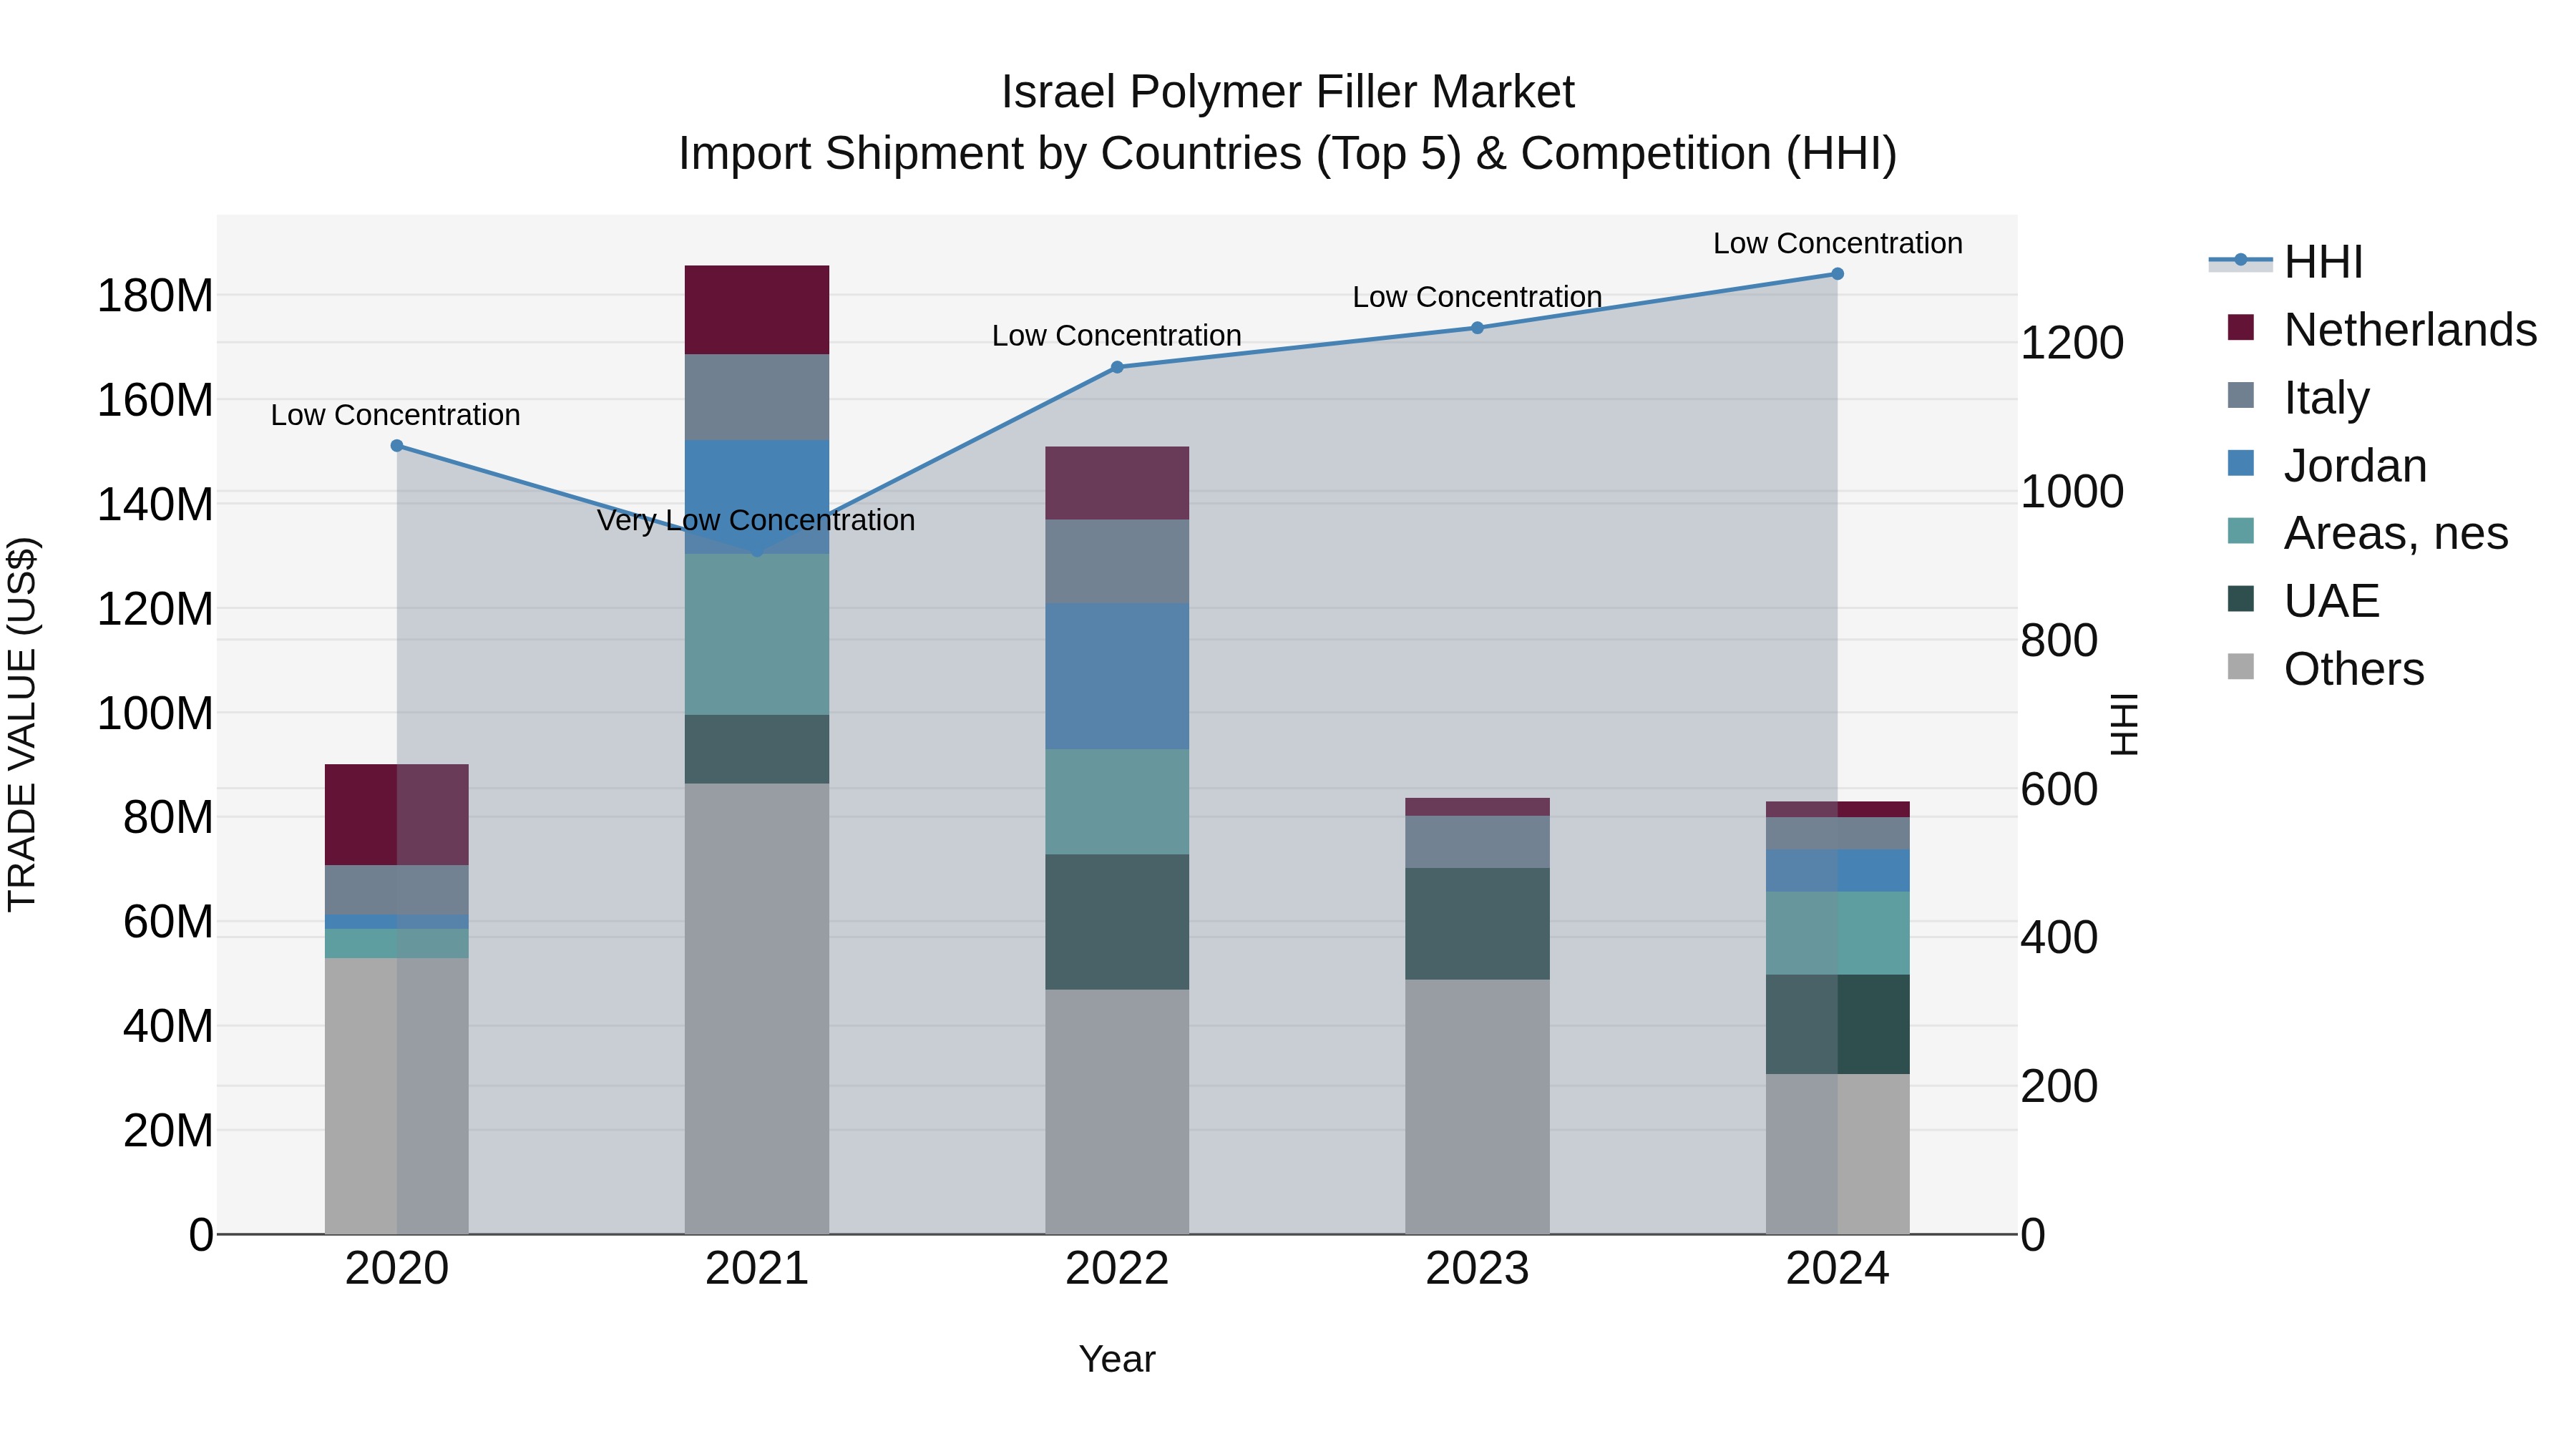
Israel Polymer Filler Market Top 5 Importing Countries and Market Competition (HHI) Analysis
Israel`s polymer filler import market in 2024 saw significant contributions from top exporting countries such as the UAE, Areas, nes, Spain, Jordan, and Italy. Despite the diversity of sources, the market exhibited low concentration with a Herfindahl-Hirschman Index (HHI) remaining at low levels. The compound annual growth rate (CAGR) from 2020 to 2024 was -2.05%, indicating a slight decline, with a marginal decrease in growth rate from 2023 to 2024 at -0.83%. This data suggests a stable but slightly shrinking market for polymer fillers in Israel.
Israel Polymer Filler Market Synopsis
Polymer fillers are inorganic or organic materials added to polymers to improve mechanical properties, reduce cost, and modify processing behavior. This market involves the production and sale of polymer fillers such as talc, calcium carbonate, and glass fibers for plastics, rubber, and composite materials.
Drivers of the market
The Israel Polymer Filler market is witnessing steady growth propelled by the increasing demand from plastics, rubber, and construction industries. Polymer fillers, such as calcium carbonate, talc, and glass microspheres, are used to improve mechanical properties, reduce costs, and enhance processing efficiency. Additionally, the growing focus on lightweight materials and the development of advanced filler technologies contribute to market growth in Israel.
Challenges of the market
The polymer filler market in Israel faces challenges related to material sourcing, filler dispersion, and product performance. Ensuring that polymer fillers meet performance requirements while offering advantages such as strength enhancement, cost reduction, and weight reduction poses significant hurdles. Moreover, addressing concerns regarding filler compatibility, processing conditions, and environmental impact adds complexity to the market dynamics.
Government Policy of the market
Government policies in Israel polymer filler market focus on promoting innovation, ensuring product quality, and fostering competitiveness. Regulatory frameworks ensure compliance with safety standards and quality certifications for polymer fillers. The government may support initiatives to encourage research and development in material science and engineering to enhance the performance and versatility of polymer fillers. Additionally, policies may aim to facilitate collaboration between industry stakeholders and support investments in infrastructure to enhance the competitiveness of Israel polymer filler manufacturers.
Key Highlights of the Report:
- Israel Polymer Filler Market Outlook
- Market Size of Israel Polymer Filler Market, 2024
- Forecast of Israel Polymer Filler Market, 2031
- Historical Data and Forecast of Israel Polymer Filler Revenues & Volume for the Period 2021-2031
- Israel Polymer Filler Market Trend Evolution
- Israel Polymer Filler Market Drivers and Challenges
- Israel Polymer Filler Price Trends
- Israel Polymer Filler Porter`s Five Forces
- Israel Polymer Filler Industry Life Cycle
- Historical Data and Forecast of Israel Polymer Filler Market Revenues & Volume By Type for the Period 2021-2031
- Historical Data and Forecast of Israel Polymer Filler Market Revenues & Volume By Organic for the Period 2021-2031
- Historical Data and Forecast of Israel Polymer Filler Market Revenues & Volume By Inorganic Oxides for the Period 2021-2031
- Historical Data and Forecast of Israel Polymer Filler Market Revenues & Volume By End User for the Period 2021-2031
- Historical Data and Forecast of Israel Polymer Filler Market Revenues & Volume By Automotive for the Period 2021-2031
- Historical Data and Forecast of Israel Polymer Filler Market Revenues & Volume By Building & Construction for the Period 2021-2031
- Historical Data and Forecast of Israel Polymer Filler Market Revenues & Volume By Industrial for the Period 2021-2031
- Historical Data and Forecast of Israel Polymer Filler Market Revenues & Volume By Packaging for the Period 2021-2031
- Historical Data and Forecast of Israel Polymer Filler Market Revenues & Volume By Others for the Period 2021-2031
- Israel Polymer Filler Import Export Trade Statistics
- Market Opportunity Assessment By Type
- Market Opportunity Assessment By End User
- Israel Polymer Filler Top Companies Market Share
- Israel Polymer Filler Competitive Benchmarking By Technical and Operational Parameters
- Israel Polymer Filler Company Profiles
- Israel Polymer Filler Key Strategic Recommendations
Frequently Asked Questions About the Market Study (FAQs):
6Wresearch actively monitors the Israel Polymer Filler Market and publishes its comprehensive annual report, highlighting emerging trends, growth drivers, revenue analysis, and forecast outlook. Our insights help businesses to make data-backed strategic decisions with ongoing market dynamics. Our analysts track relevent industries related to the Israel Polymer Filler Market, allowing our clients with actionable intelligence and reliable forecasts tailored to emerging regional needs.
Yes, we provide customisation as per your requirements. To learn more, feel free to contact us on sales@6wresearch.com
1 Executive Summary |
2 Introduction |
2.1 Key Highlights of the Report |
2.2 Report Description |
2.3 Market Scope & Segmentation |
2.4 Research Methodology |
2.5 Assumptions |
3 Israel Polymer Filler Market Overview |
3.1 Israel Country Macro Economic Indicators |
3.2 Israel Polymer Filler Market Revenues & Volume, 2021 & 2031F |
3.3 Israel Polymer Filler Market - Industry Life Cycle |
3.4 Israel Polymer Filler Market - Porter's Five Forces |
3.5 Israel Polymer Filler Market Revenues & Volume Share, By Type, 2021 & 2031F |
3.6 Israel Polymer Filler Market Revenues & Volume Share, By End User, 2021 & 2031F |
4 Israel Polymer Filler Market Dynamics |
4.1 Impact Analysis |
4.2 Market Drivers |
4.2.1 Growing demand for lightweight materials in automotive and construction industries |
4.2.2 Increasing usage of polymer fillers in packaging and consumer goods |
4.2.3 Technological advancements leading to the development of innovative polymer fillers |
4.3 Market Restraints |
4.3.1 Fluctuating prices of raw materials impacting production costs |
4.3.2 Stringent environmental regulations on the use of certain types of polymer fillers |
4.3.3 Intense competition from substitute materials like glass and carbon fibers |
5 Israel Polymer Filler Market Trends |
6 Israel Polymer Filler Market Segmentations |
6.1 Israel Polymer Filler Market, By Type |
6.1.1 Overview and Analysis |
6.1.2 Israel Polymer Filler Market Revenues & Volume, By Organic, 2021-2031F |
6.1.3 Israel Polymer Filler Market Revenues & Volume, By Inorganic Oxides, 2021-2031F |
6.2 Israel Polymer Filler Market, By End User |
6.2.1 Overview and Analysis |
6.2.2 Israel Polymer Filler Market Revenues & Volume, By Automotive, 2021-2031F |
6.2.3 Israel Polymer Filler Market Revenues & Volume, By Building & Construction, 2021-2031F |
6.2.4 Israel Polymer Filler Market Revenues & Volume, By Industrial, 2021-2031F |
6.2.5 Israel Polymer Filler Market Revenues & Volume, By Packaging, 2021-2031F |
6.2.6 Israel Polymer Filler Market Revenues & Volume, By Others, 2021-2031F |
7 Israel Polymer Filler Market Import-Export Trade Statistics |
7.1 Israel Polymer Filler Market Export to Major Countries |
7.2 Israel Polymer Filler Market Imports from Major Countries |
8 Israel Polymer Filler Market Key Performance Indicators |
8.1 Percentage increase in research and development investment in polymer filler technology |
8.2 Adoption rate of eco-friendly polymer fillers in the market |
8.3 Number of collaborations and partnerships between polymer filler manufacturers and end-user industries |
9 Israel Polymer Filler Market - Opportunity Assessment |
9.1 Israel Polymer Filler Market Opportunity Assessment, By Type, 2021 & 2031F |
9.2 Israel Polymer Filler Market Opportunity Assessment, By End User, 2021 & 2031F |
10 Israel Polymer Filler Market - Competitive Landscape |
10.1 Israel Polymer Filler Market Revenue Share, By Companies, 2024 |
10.2 Israel Polymer Filler Market Competitive Benchmarking, By Operating and Technical Parameters |
11 Company Profiles |
12 Recommendations | 13 Disclaimer |
Export potential assessment - trade Analytics for 2030
Export potential enables firms to identify high-growth global markets with greater confidence by combining advanced trade intelligence with a structured quantitative methodology. The framework analyzes emerging demand trends and country-level import patterns while integrating macroeconomic and trade datasets such as GDP and population forecasts, bilateral import–export flows, tariff structures, elasticity differentials between developed and developing economies, geographic distance, and import demand projections. Using weighted trade values from 2020–2024 as the base period to project country-to-country export potential for 2030, these inputs are operationalized through calculated drivers such as gravity model parameters, tariff impact factors, and projected GDP per-capita growth. Through an analysis of hidden potentials, demand hotspots, and market conditions that are most favorable to success, this method enables firms to focus on target countries, maximize returns, and global expansion with data, backed by accuracy.
By factoring in the projected importer demand gap that is currently unmet and could be potential opportunity, it identifies the potential for the Exporter (Country) among 190 countries, against the general trade analysis, which identifies the biggest importer or exporter.
To discover high-growth global markets and optimize your business strategy:
Click Here
Pricing
- Single User License$ 1,995
- Department License$ 2,400
- Site License$ 3,120
- Global License$ 3,795

Search
Thought Leadership and Analyst Meet


Our Clients
Latest Reports
- Canada Cloud CFD Market (2026-2032) | Size & Revenue, Industry, Growth, Competitive Landscape, Forecast, Segmentation, Value, Outlook, Trends, Share, Analysis, Companies
- Taiwan Food Delivery Platform Market (2026-2032) | Companies, Outlook, Analysis, Trends, Value, Revenue, Segmentation, Share, Forecast, Competitive Landscape, Growth, Size & Forecast
- United Kingdom (UK) Long-term Care Insurance Market (2026-2032) | Growth, Share, Consumer Insights, Drivers, Opportunities, Competition, Pricing Analysis, Segments, Restraints, Companies, Competitive, Value, Outlook, Size, Demand, Analysis, Challenges, Strategic Insights, Investment Trends, Revenue, Trends, Supply, Forecast
- United Kingdom (UK) Long Term Care Market (2026-2032) | Companies, Outlook, Analysis, Trends, Value, Revenue, Segmentation, Share, Forecast, Competitive Landscape, Growth, Size & Forecast
- Iraq Insulation and Waterproofing Market (2026-2032) | Outlook, Drivers, Growth, Size, Share, Industry, Revenue, Trends, Demand, Competitive, Strategic Insights, Opportunities, Segments, Companies, Challenges, Strategy, Consumer Insights, Analysis, Investment Trends, Value, Segmentation, Forecast, Restraints
- India Switchgear Market Outlook (2026-2032) | Size, Share, Trends, Growth, Revenue, Forecast, Analysis, Value, Outlook
- Pakistan Contraceptive Implants Market (2025-2031) | Demand, Growth, Size, Share, Industry, Pricing Analysis, Competitive, Strategic Insights, Strategy, Consumer Insights, Analysis, Investment Trends, Opportunities, Revenue, Segments, Value, Segmentation, Supply, Forecast, Restraints, Outlook, Competition, Drivers, Trends, Companies, Challenges
- Sri Lanka Packaging Market (2026-2032) | Outlook, Competition, Drivers, Trends, Demand, Pricing Analysis, Competitive, Strategic Insights, Companies, Challenges, Strategy, Consumer Insights, Analysis, Investment Trends, Opportunities, Growth, Size, Share, Industry, Revenue, Segments, Value, Segmentation, Supply, Forecast, Restraints
- India Kids Watches Market (2026-2032) | Strategy, Consumer Insights, Analysis, Investment Trends, Opportunities, Growth, Size, Share, Industry, Revenue, Segments, Value, Segmentation, Supply, Forecast, Restraints, Outlook, Competition, Drivers, Trends, Demand, Pricing Analysis, Competitive, Strategic Insights, Companies, Challenges
- Saudi Arabia Core Assurance Service Market (2025-2031) | Strategy, Consumer Insights, Analysis, Investment Trends, Opportunities, Growth, Size, Share, Industry, Revenue, Segments, Value, Segmentation, Supply, Forecast, Restraints, Outlook, Competition, Drivers, Trends, Demand, Pricing Analysis, Competitive, Strategic Insights, Companies, Challenges
Industry Events and Analyst Meet

India EV Show 2026

EV tech India Expo 2026

Auto Tech Asia 2026

Battery Tech India 2026

Smart Production Solutions Guangzhou 2026
Whitepaper
- Middle East & Africa Commercial Security Market Click here to view more.
- Middle East & Africa Fire Safety Systems & Equipment Market Click here to view more.
- GCC Drone Market Click here to view more.
- Middle East Lighting Fixture Market Click here to view more.
- GCC Physical & Perimeter Security Market Click here to view more.
6WResearch In News
- Doha a strategic location for EV manufacturing hub: IPA Qatar
- Demand for luxury TVs surging in the GCC, says Samsung
- Empowering Growth: The Thriving Journey of Bangladesh’s Cable Industry
- Demand for luxury TVs surging in the GCC, says Samsung
- Video call with a traditional healer? Once unthinkable, it’s now common in South Africa
- Intelligent Buildings To Smooth GCC’s Path To Net Zero