Israel Therapeutic Lenses Market (2026-2032) | Strategy, Size, Supply, Forecast, Challenges, Opportunities, Share, Revenue, Competitive, Competition, Segmentation, Industry, Demand, Analysis, Companies, Restraints, Outlook, Consumer Insights, Investment Trends, Pricing Analysis, Strategic Insights, Trends, Growth, Segments, Drivers, Value
Market Forecast By Lens Type (Soft Lenses, Rigid Gas Permeable Lenses, Hybrid Lenses), By Application (Vision Correction, Orthokeratology, PostSurgical), By Material Type (Silicone Hydrogel, Polymethyl Methacrylate, Hybrid Polymer), By Coating Type (AntiReflective, UV Protection, Hydrophobic), By End User (Individuals, Optometry Clinics, Hospitals) And Competitive Landscape
| Product Code: ETC10927471 | Publication Date: Apr 2025 | Updated Date: Apr 2026 | Product Type: Market Research Report | |
| Publisher: 6Wresearch | No. of Pages: 65 | No. of Figures: 34 | No. of Tables: 19 | |
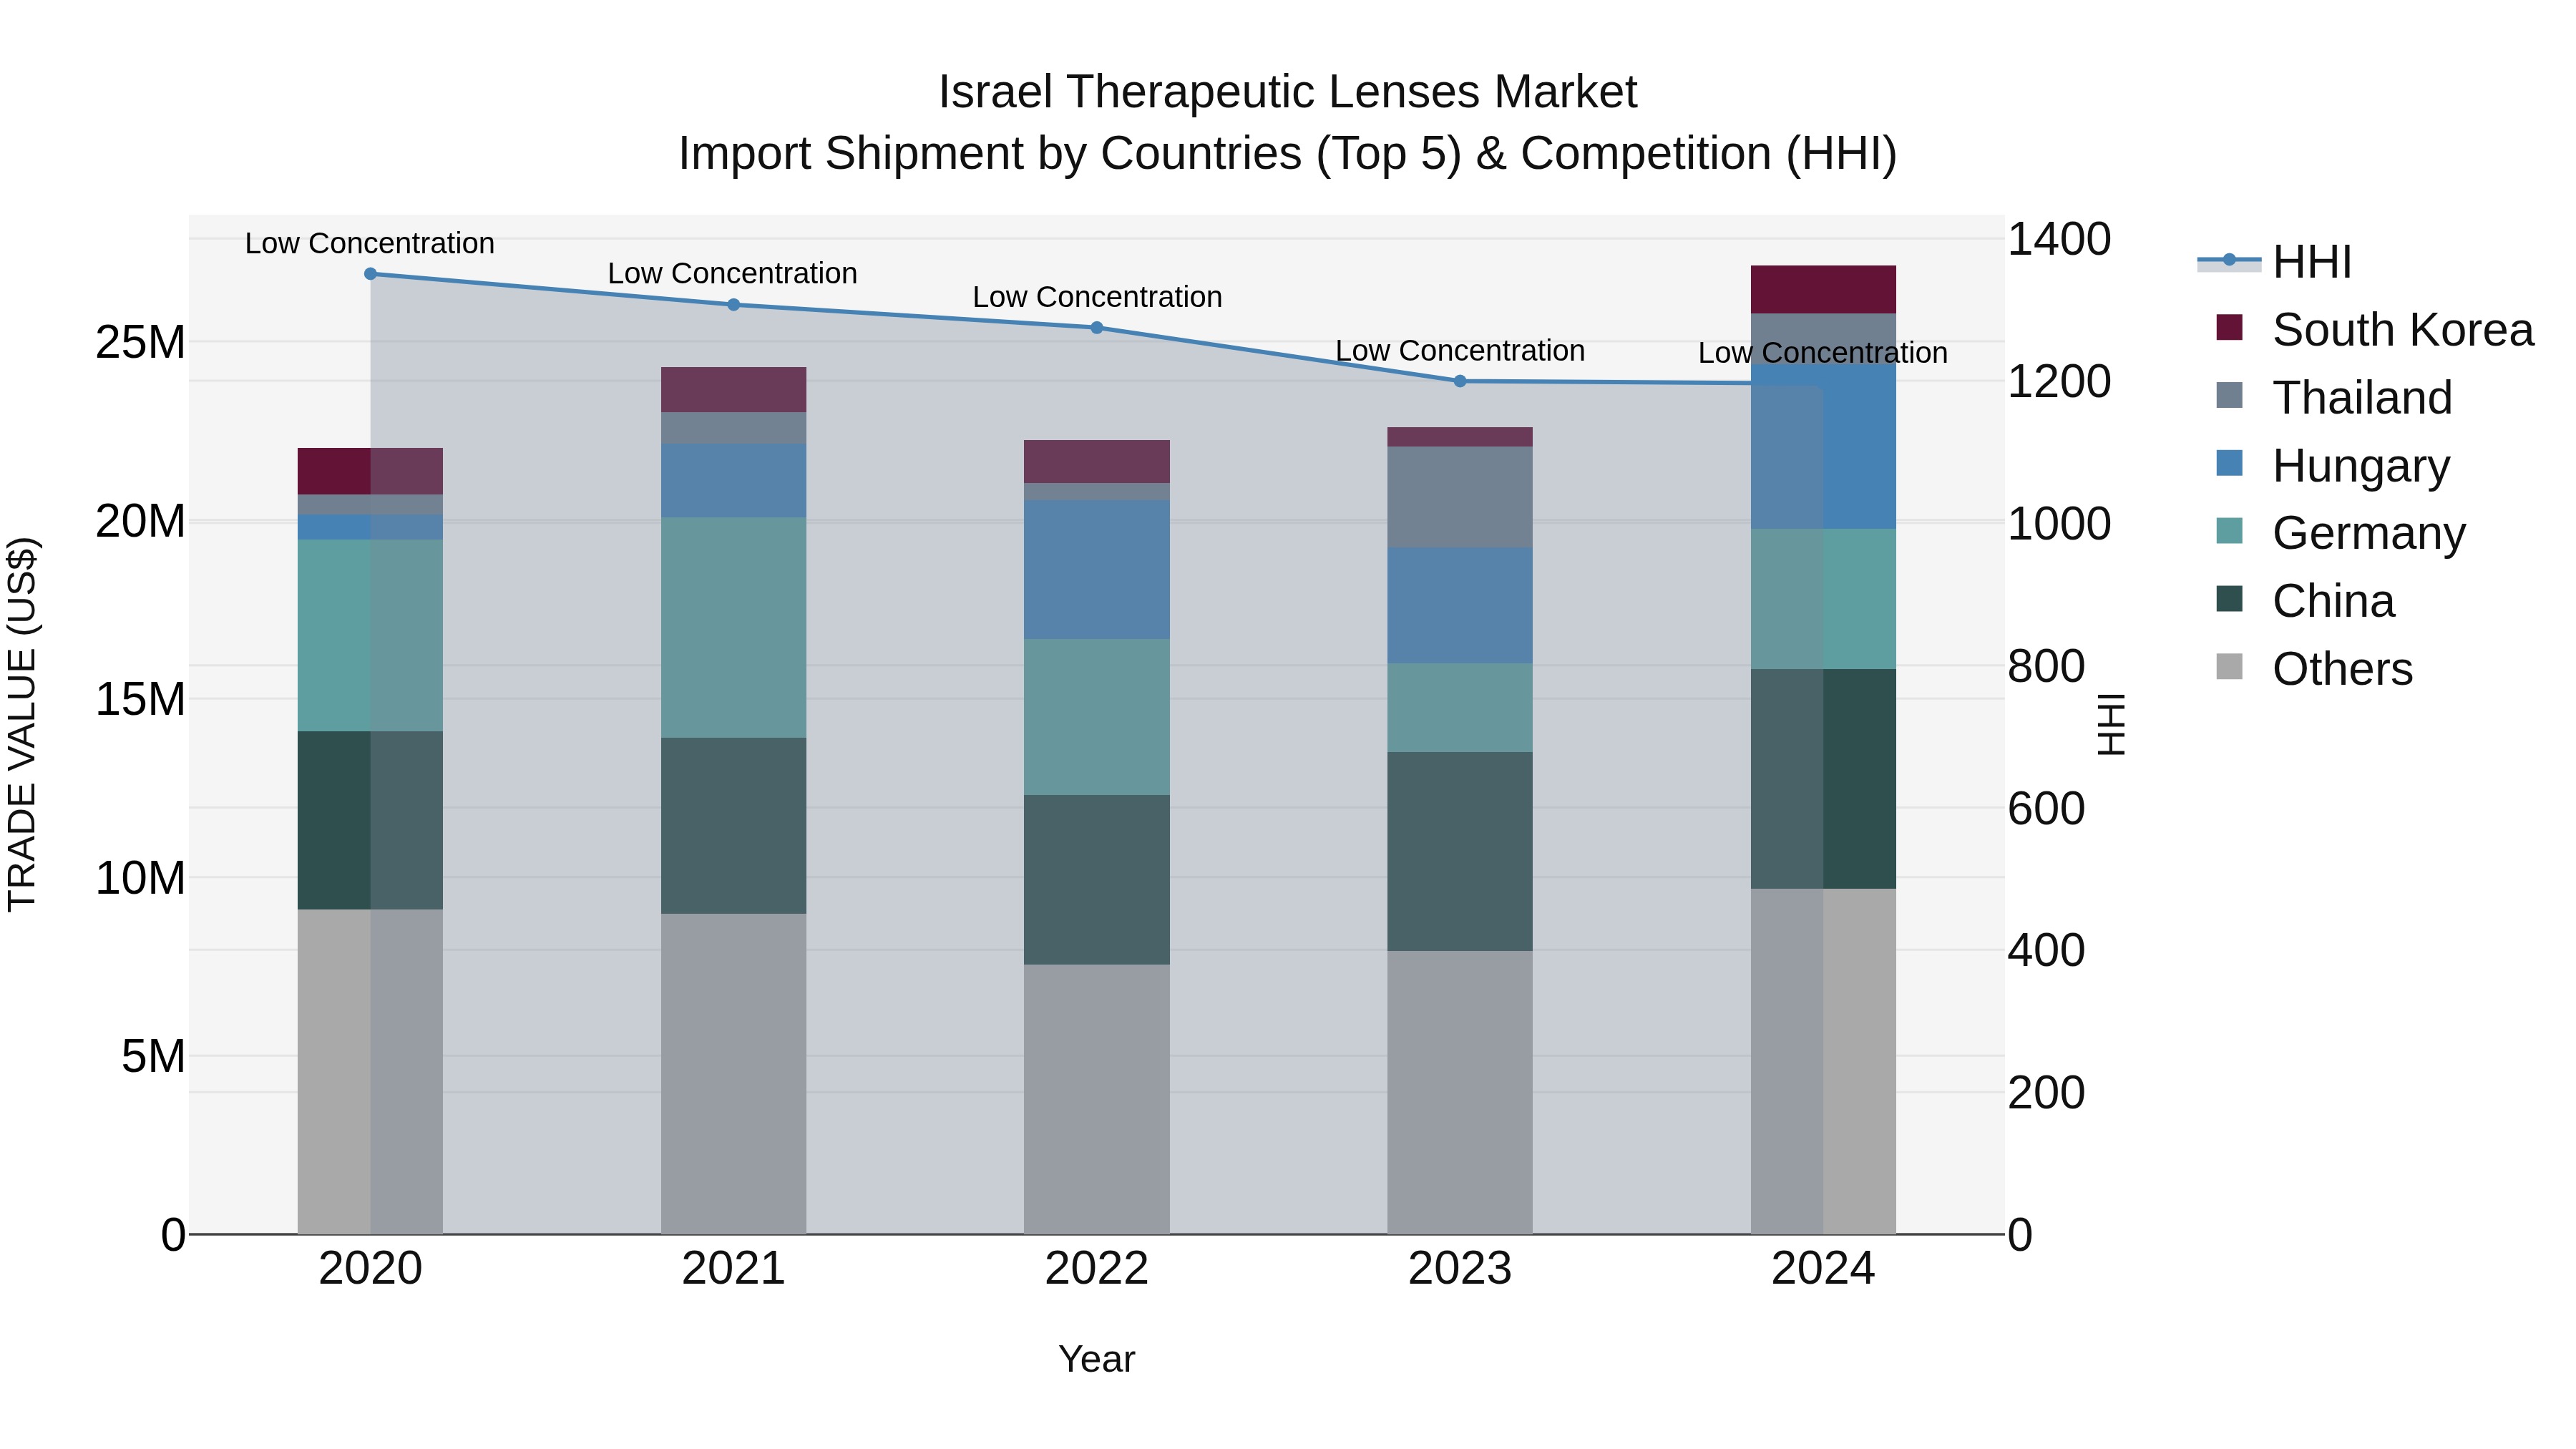
Israel Therapeutic Lenses Market Top 5 Importing Countries and Market Competition (HHI) Analysis
The import shipments of therapeutic lenses to Israel in 2024 saw significant growth, with top exporting countries being China, Hungary, Germany, Portugal, and Czechia. The market concentration, measured by HHI, remained low, indicating a diverse range of sources. The compound annual growth rate (CAGR) from 2020 to 2024 stood at a healthy 5.35%, with a notable growth rate of 19.97% from 2023 to 2024. This data suggests a positive outlook for the therapeutic lenses market in Israel, driven by a variety of international suppliers and strong growth momentum.
Key Highlights of the Report:
- Israel Therapeutic Lenses Market Outlook
- Market Size of Israel Therapeutic Lenses Market, 2025
- Forecast of Israel Therapeutic Lenses Market, 2032
- Historical Data and Forecast of Israel Therapeutic Lenses Revenues & Volume for the Period 2022 - 2032F
- Israel Therapeutic Lenses Market Trend Evolution
- Israel Therapeutic Lenses Market Drivers and Challenges
- Israel Therapeutic Lenses Price Trends
- Israel Therapeutic Lenses Porter's Five Forces
- Israel Therapeutic Lenses Industry Life Cycle
- Historical Data and Forecast of Israel Therapeutic Lenses Market Revenues & Volume By Lens Type for the Period 2022 - 2032F
- Historical Data and Forecast of Israel Therapeutic Lenses Market Revenues & Volume By Soft Lenses for the Period 2022 - 2032F
- Historical Data and Forecast of Israel Therapeutic Lenses Market Revenues & Volume By Rigid Gas Permeable Lenses for the Period 2022 - 2032F
- Historical Data and Forecast of Israel Therapeutic Lenses Market Revenues & Volume By Hybrid Lenses for the Period 2022 - 2032F
- Historical Data and Forecast of Israel Therapeutic Lenses Market Revenues & Volume By Application for the Period 2022 - 2032F
- Historical Data and Forecast of Israel Therapeutic Lenses Market Revenues & Volume By Vision Correction for the Period 2022 - 2032F
- Historical Data and Forecast of Israel Therapeutic Lenses Market Revenues & Volume By Orthokeratology for the Period 2022 - 2032F
- Historical Data and Forecast of Israel Therapeutic Lenses Market Revenues & Volume By PostSurgical for the Period 2022 - 2032F
- Historical Data and Forecast of Israel Therapeutic Lenses Market Revenues & Volume By Material Type for the Period 2022 - 2032F
- Historical Data and Forecast of Israel Therapeutic Lenses Market Revenues & Volume By Silicone Hydrogel for the Period 2022 - 2032F
- Historical Data and Forecast of Israel Therapeutic Lenses Market Revenues & Volume By Polymethyl Methacrylate for the Period 2022 - 2032F
- Historical Data and Forecast of Israel Therapeutic Lenses Market Revenues & Volume By Hybrid Polymer for the Period 2022 - 2032F
- Historical Data and Forecast of Israel Therapeutic Lenses Market Revenues & Volume By Coating Type for the Period 2022 - 2032F
- Historical Data and Forecast of Israel Therapeutic Lenses Market Revenues & Volume By AntiReflective for the Period 2022 - 2032F
- Historical Data and Forecast of Israel Therapeutic Lenses Market Revenues & Volume By UV Protection for the Period 2022 - 2032F
- Historical Data and Forecast of Israel Therapeutic Lenses Market Revenues & Volume By Hydrophobic for the Period 2022 - 2032F
- Historical Data and Forecast of Israel Therapeutic Lenses Market Revenues & Volume By End User for the Period 2022 - 2032F
- Historical Data and Forecast of Israel Therapeutic Lenses Market Revenues & Volume By Individuals for the Period 2022 - 2032F
- Historical Data and Forecast of Israel Therapeutic Lenses Market Revenues & Volume By Optometry Clinics for the Period 2022 - 2032F
- Historical Data and Forecast of Israel Therapeutic Lenses Market Revenues & Volume By Hospitals for the Period 2022 - 2032F
- Israel Therapeutic Lenses Import Export Trade Statistics
- Market Opportunity Assessment By Lens Type
- Market Opportunity Assessment By Application
- Market Opportunity Assessment By Material Type
- Market Opportunity Assessment By Coating Type
- Market Opportunity Assessment By End User
- Israel Therapeutic Lenses Top Companies Market Share
- Israel Therapeutic Lenses Competitive Benchmarking By Technical and Operational Parameters
- Israel Therapeutic Lenses Company Profiles
- Israel Therapeutic Lenses Key Strategic Recommendations
Frequently Asked Questions About the Market Study (FAQs):
6Wresearch actively monitors the Israel Therapeutic Lenses Market and publishes its comprehensive annual report, highlighting emerging trends, growth drivers, revenue analysis, and forecast outlook. Our insights help businesses to make data-backed strategic decisions with ongoing market dynamics. Our analysts track relevent industries related to the Israel Therapeutic Lenses Market, allowing our clients with actionable intelligence and reliable forecasts tailored to emerging regional needs.
Yes, we provide customisation as per your requirements. To learn more, feel free to contact us on sales@6wresearch.com
1 Executive Summary |
2 Introduction |
2.1 Key Highlights of the Report |
2.2 Report Description |
2.3 Market Scope & Segmentation |
2.4 Research Methodology |
2.5 Assumptions |
3 Israel Therapeutic Lenses Market Overview |
3.1 Israel Country Macro Economic Indicators |
3.2 Israel Therapeutic Lenses Market Revenues & Volume, 2022 & 2032F |
3.3 Israel Therapeutic Lenses Market - Industry Life Cycle |
3.4 Israel Therapeutic Lenses Market - Porter's Five Forces |
3.5 Israel Therapeutic Lenses Market Revenues & Volume Share, By Lens Type, 2022 & 2032F |
3.6 Israel Therapeutic Lenses Market Revenues & Volume Share, By Application, 2022 & 2032F |
3.7 Israel Therapeutic Lenses Market Revenues & Volume Share, By Material Type, 2022 & 2032F |
3.8 Israel Therapeutic Lenses Market Revenues & Volume Share, By Coating Type, 2022 & 2032F |
3.9 Israel Therapeutic Lenses Market Revenues & Volume Share, By End User, 2022 & 2032F |
4 Israel Therapeutic Lenses Market Dynamics |
4.1 Impact Analysis |
4.2 Market Drivers |
4.2.1 Increasing prevalence of eye-related disorders and diseases in Israel |
4.2.2 Growing awareness about the benefits of therapeutic lenses for various eye conditions |
4.2.3 Technological advancements leading to the development of innovative therapeutic lens products |
4.3 Market Restraints |
4.3.1 High cost associated with therapeutic lenses leading to affordability issues for some consumers |
4.3.2 Limited availability of specialized eye care professionals for fitting and prescribing therapeutic lenses |
4.3.3 Stringent regulations and approval processes for therapeutic lens products in Israel |
5 Israel Therapeutic Lenses Market Trends |
6 Israel Therapeutic Lenses Market, By Types |
6.1 Israel Therapeutic Lenses Market, By Lens Type |
6.1.1 Overview and Analysis |
6.1.2 Israel Therapeutic Lenses Market Revenues & Volume, By Lens Type, 2022 - 2032F |
6.1.3 Israel Therapeutic Lenses Market Revenues & Volume, By Soft Lenses, 2022 - 2032F |
6.1.4 Israel Therapeutic Lenses Market Revenues & Volume, By Rigid Gas Permeable Lenses, 2022 - 2032F |
6.1.5 Israel Therapeutic Lenses Market Revenues & Volume, By Hybrid Lenses, 2022 - 2032F |
6.2 Israel Therapeutic Lenses Market, By Application |
6.2.1 Overview and Analysis |
6.2.2 Israel Therapeutic Lenses Market Revenues & Volume, By Vision Correction, 2022 - 2032F |
6.2.3 Israel Therapeutic Lenses Market Revenues & Volume, By Orthokeratology, 2022 - 2032F |
6.2.4 Israel Therapeutic Lenses Market Revenues & Volume, By PostSurgical, 2022 - 2032F |
6.3 Israel Therapeutic Lenses Market, By Material Type |
6.3.1 Overview and Analysis |
6.3.2 Israel Therapeutic Lenses Market Revenues & Volume, By Silicone Hydrogel, 2022 - 2032F |
6.3.3 Israel Therapeutic Lenses Market Revenues & Volume, By Polymethyl Methacrylate, 2022 - 2032F |
6.3.4 Israel Therapeutic Lenses Market Revenues & Volume, By Hybrid Polymer, 2022 - 2032F |
6.4 Israel Therapeutic Lenses Market, By Coating Type |
6.4.1 Overview and Analysis |
6.4.2 Israel Therapeutic Lenses Market Revenues & Volume, By AntiReflective, 2022 - 2032F |
6.4.3 Israel Therapeutic Lenses Market Revenues & Volume, By UV Protection, 2022 - 2032F |
6.4.4 Israel Therapeutic Lenses Market Revenues & Volume, By Hydrophobic, 2022 - 2032F |
6.5 Israel Therapeutic Lenses Market, By End User |
6.5.1 Overview and Analysis |
6.5.2 Israel Therapeutic Lenses Market Revenues & Volume, By Individuals, 2022 - 2032F |
6.5.3 Israel Therapeutic Lenses Market Revenues & Volume, By Optometry Clinics, 2022 - 2032F |
6.5.4 Israel Therapeutic Lenses Market Revenues & Volume, By Hospitals, 2022 - 2032F |
7 Israel Therapeutic Lenses Market Import-Export Trade Statistics |
7.1 Israel Therapeutic Lenses Market Export to Major Countries |
7.2 Israel Therapeutic Lenses Market Imports from Major Countries |
8 Israel Therapeutic Lenses Market Key Performance Indicators |
8.1 Average waiting time for obtaining therapeutic lenses in Israel |
8.2 Number of new product launches in the therapeutic lenses market |
8.3 Adoption rate of therapeutic lenses among different age groups in Israel |
9 Israel Therapeutic Lenses Market - Opportunity Assessment |
9.1 Israel Therapeutic Lenses Market Opportunity Assessment, By Lens Type, 2022 & 2032F |
9.2 Israel Therapeutic Lenses Market Opportunity Assessment, By Application, 2022 & 2032F |
9.3 Israel Therapeutic Lenses Market Opportunity Assessment, By Material Type, 2022 & 2032F |
9.4 Israel Therapeutic Lenses Market Opportunity Assessment, By Coating Type, 2022 & 2032F |
9.5 Israel Therapeutic Lenses Market Opportunity Assessment, By End User, 2022 & 2032F |
10 Israel Therapeutic Lenses Market - Competitive Landscape |
10.1 Israel Therapeutic Lenses Market Revenue Share, By Companies, 2025 |
10.2 Israel Therapeutic Lenses Market Competitive Benchmarking, By Operating and Technical Parameters |
11 Company Profiles |
12 Recommendations |
13 Disclaimer |
Export potential assessment - trade Analytics for 2030
Export potential enables firms to identify high-growth global markets with greater confidence by combining advanced trade intelligence with a structured quantitative methodology. The framework analyzes emerging demand trends and country-level import patterns while integrating macroeconomic and trade datasets such as GDP and population forecasts, bilateral import–export flows, tariff structures, elasticity differentials between developed and developing economies, geographic distance, and import demand projections. Using weighted trade values from 2020–2024 as the base period to project country-to-country export potential for 2030, these inputs are operationalized through calculated drivers such as gravity model parameters, tariff impact factors, and projected GDP per-capita growth. Through an analysis of hidden potentials, demand hotspots, and market conditions that are most favorable to success, this method enables firms to focus on target countries, maximize returns, and global expansion with data, backed by accuracy.
By factoring in the projected importer demand gap that is currently unmet and could be potential opportunity, it identifies the potential for the Exporter (Country) among 190 countries, against the general trade analysis, which identifies the biggest importer or exporter.
To discover high-growth global markets and optimize your business strategy:
Click Here
Pricing
- Single User License$ 1,995
- Department License$ 2,400
- Site License$ 3,120
- Global License$ 3,795

Search
Thought Leadership and Analyst Meet


Our Clients
Latest Reports
- United Kingdom (UK) Outdoor Cooking Equipment Market (2026-2032) | Investment Opportunities, Outlook, Growth, Competition, Trends, Pricing, Demand, Insights, Challenges, Drivers, Size, Restraints, segmentation, Value, Share, Forecast, Companies, Analysis, Revenue, Strategy
- United Arab Emirates (UAE) Outdoor Cooking Equipment Market (2026-2032) | Challenges, Value, Restraints, Growth, Competition, Revenue, Trends, Outlook, Analysis, Drivers, Share, Investment Opportunities, Strategy, Demand, Companies, Forecast, Pricing, segmentation, Size, Insights
- Vietnam Outdoor Cooking Equipment Market (2026-2032) | Demand, Investment Opportunities, Growth, Pricing, Trends, Restraints, Competition, Outlook, Drivers, Strategy, Challenges, Revenue, Analysis, segmentation, Value, Size, Share, Insights, Companies, Forecast
- Venezuela Outdoor Cooking Equipment Market (2026-2032) | Challenges, Revenue, Demand, Value, Pricing, Strategy, Competition, Analysis, Companies, Insights, Growth, Outlook, Forecast, Size, Restraints, segmentation, Drivers, Trends, Investment Opportunities, Share
- Uganda Outdoor Cooking Equipment Market (2026-2032) | Drivers, Pricing, Challenges, Value, Growth, Companies, segmentation, Strategy, Analysis, Demand, Outlook, Size, Competition, Restraints, Revenue, Forecast, Investment Opportunities, Insights, Trends, Share
- Turkey Outdoor Cooking Equipment Market (2026-2032) | Size, Competition, Outlook, Strategy, Forecast, Drivers, Trends, Companies, Revenue, Growth, Analysis, segmentation, Insights, Pricing, Restraints, Demand, Investment Opportunities, Value, Share, Challenges
- Tunisia Outdoor Cooking Equipment Market (2026-2032) | Analysis, Share, Pricing, Trends, Size, Outlook, Revenue, segmentation, Demand, Insights, Investment Opportunities, Restraints, Growth, Forecast, Competition, Drivers, Challenges, Companies, Strategy, Value
- Thailand Outdoor Cooking Equipment Market (2026-2032) | Growth, Revenue, Insights, Companies, Drivers, Strategy, Forecast, Size, Analysis, segmentation, Trends, Challenges, Competition, Share, Investment Opportunities, Demand, Pricing, Value, Restraints, Outlook
- Tanzania Outdoor Cooking Equipment Market (2026-2032) | Share, Drivers, Forecast, Revenue, Growth, Outlook, Analysis, Investment Opportunities, Restraints, segmentation, Demand, Pricing, Size, Insights, Challenges, Competition, Companies, Value, Trends, Strategy
- Tajikistan Outdoor Cooking Equipment Market (2026-2032) | Value, Pricing, Companies, Share, Strategy, Revenue, Investment Opportunities, Demand, Forecast, Size, Competition, Challenges, Growth, Insights, Restraints, segmentation, Analysis, Trends, Drivers, Outlook
Industry Events and Analyst Meet

HIMTEX 2026

India Refining Summit 2026

India EV Show 2026

EV tech India Expo 2026

Auto Tech Asia 2026
Whitepaper
- Middle East & Africa Commercial Security Market Click here to view more.
- Middle East & Africa Fire Safety Systems & Equipment Market Click here to view more.
- GCC Drone Market Click here to view more.
- Middle East Lighting Fixture Market Click here to view more.
- GCC Physical & Perimeter Security Market Click here to view more.
6WResearch In News
- Doha a strategic location for EV manufacturing hub: IPA Qatar
- Demand for luxury TVs surging in the GCC, says Samsung
- Empowering Growth: The Thriving Journey of Bangladesh’s Cable Industry
- Demand for luxury TVs surging in the GCC, says Samsung
- Video call with a traditional healer? Once unthinkable, it’s now common in South Africa
- Intelligent Buildings To Smooth GCC’s Path To Net Zero