Italy AMI Metering Market (2026-2032) | Outlook, Pricing Analysis, Share, Strategy, Companies, Competition, Segmentation, Drivers, Value, Investment Trends, Competitive, Segments, Growth, Trends, Size, Strategic Insights, Demand, Opportunities, Forecast, Industry, Restraints, Analysis, Revenue, Consumer Insights, Challenges, Supply
Market Forecast By Meter Type (Electric AMI Meters, Water AMI Meters, Gas AMI Meters, Multi-Utility AMI Meters), By Application (Smart Grid, Water Consumption Tracking, Gas Usage Monitoring, Multi-utility Monitoring), By End-Use (Utility Providers, Municipalities, Energy Providers, Commercial Buildings) And Competitive Landscape
| Product Code: ETC11911185 | Publication Date: Apr 2025 | Updated Date: Apr 2026 | Product Type: Market Research Report | |
| Publisher: 6Wresearch | Author: Sachin Kumar Rai | No. of Pages: 65 | No. of Figures: 34 | No. of Tables: 19 |
Italy Ami Metering Market Size (2020-2030)
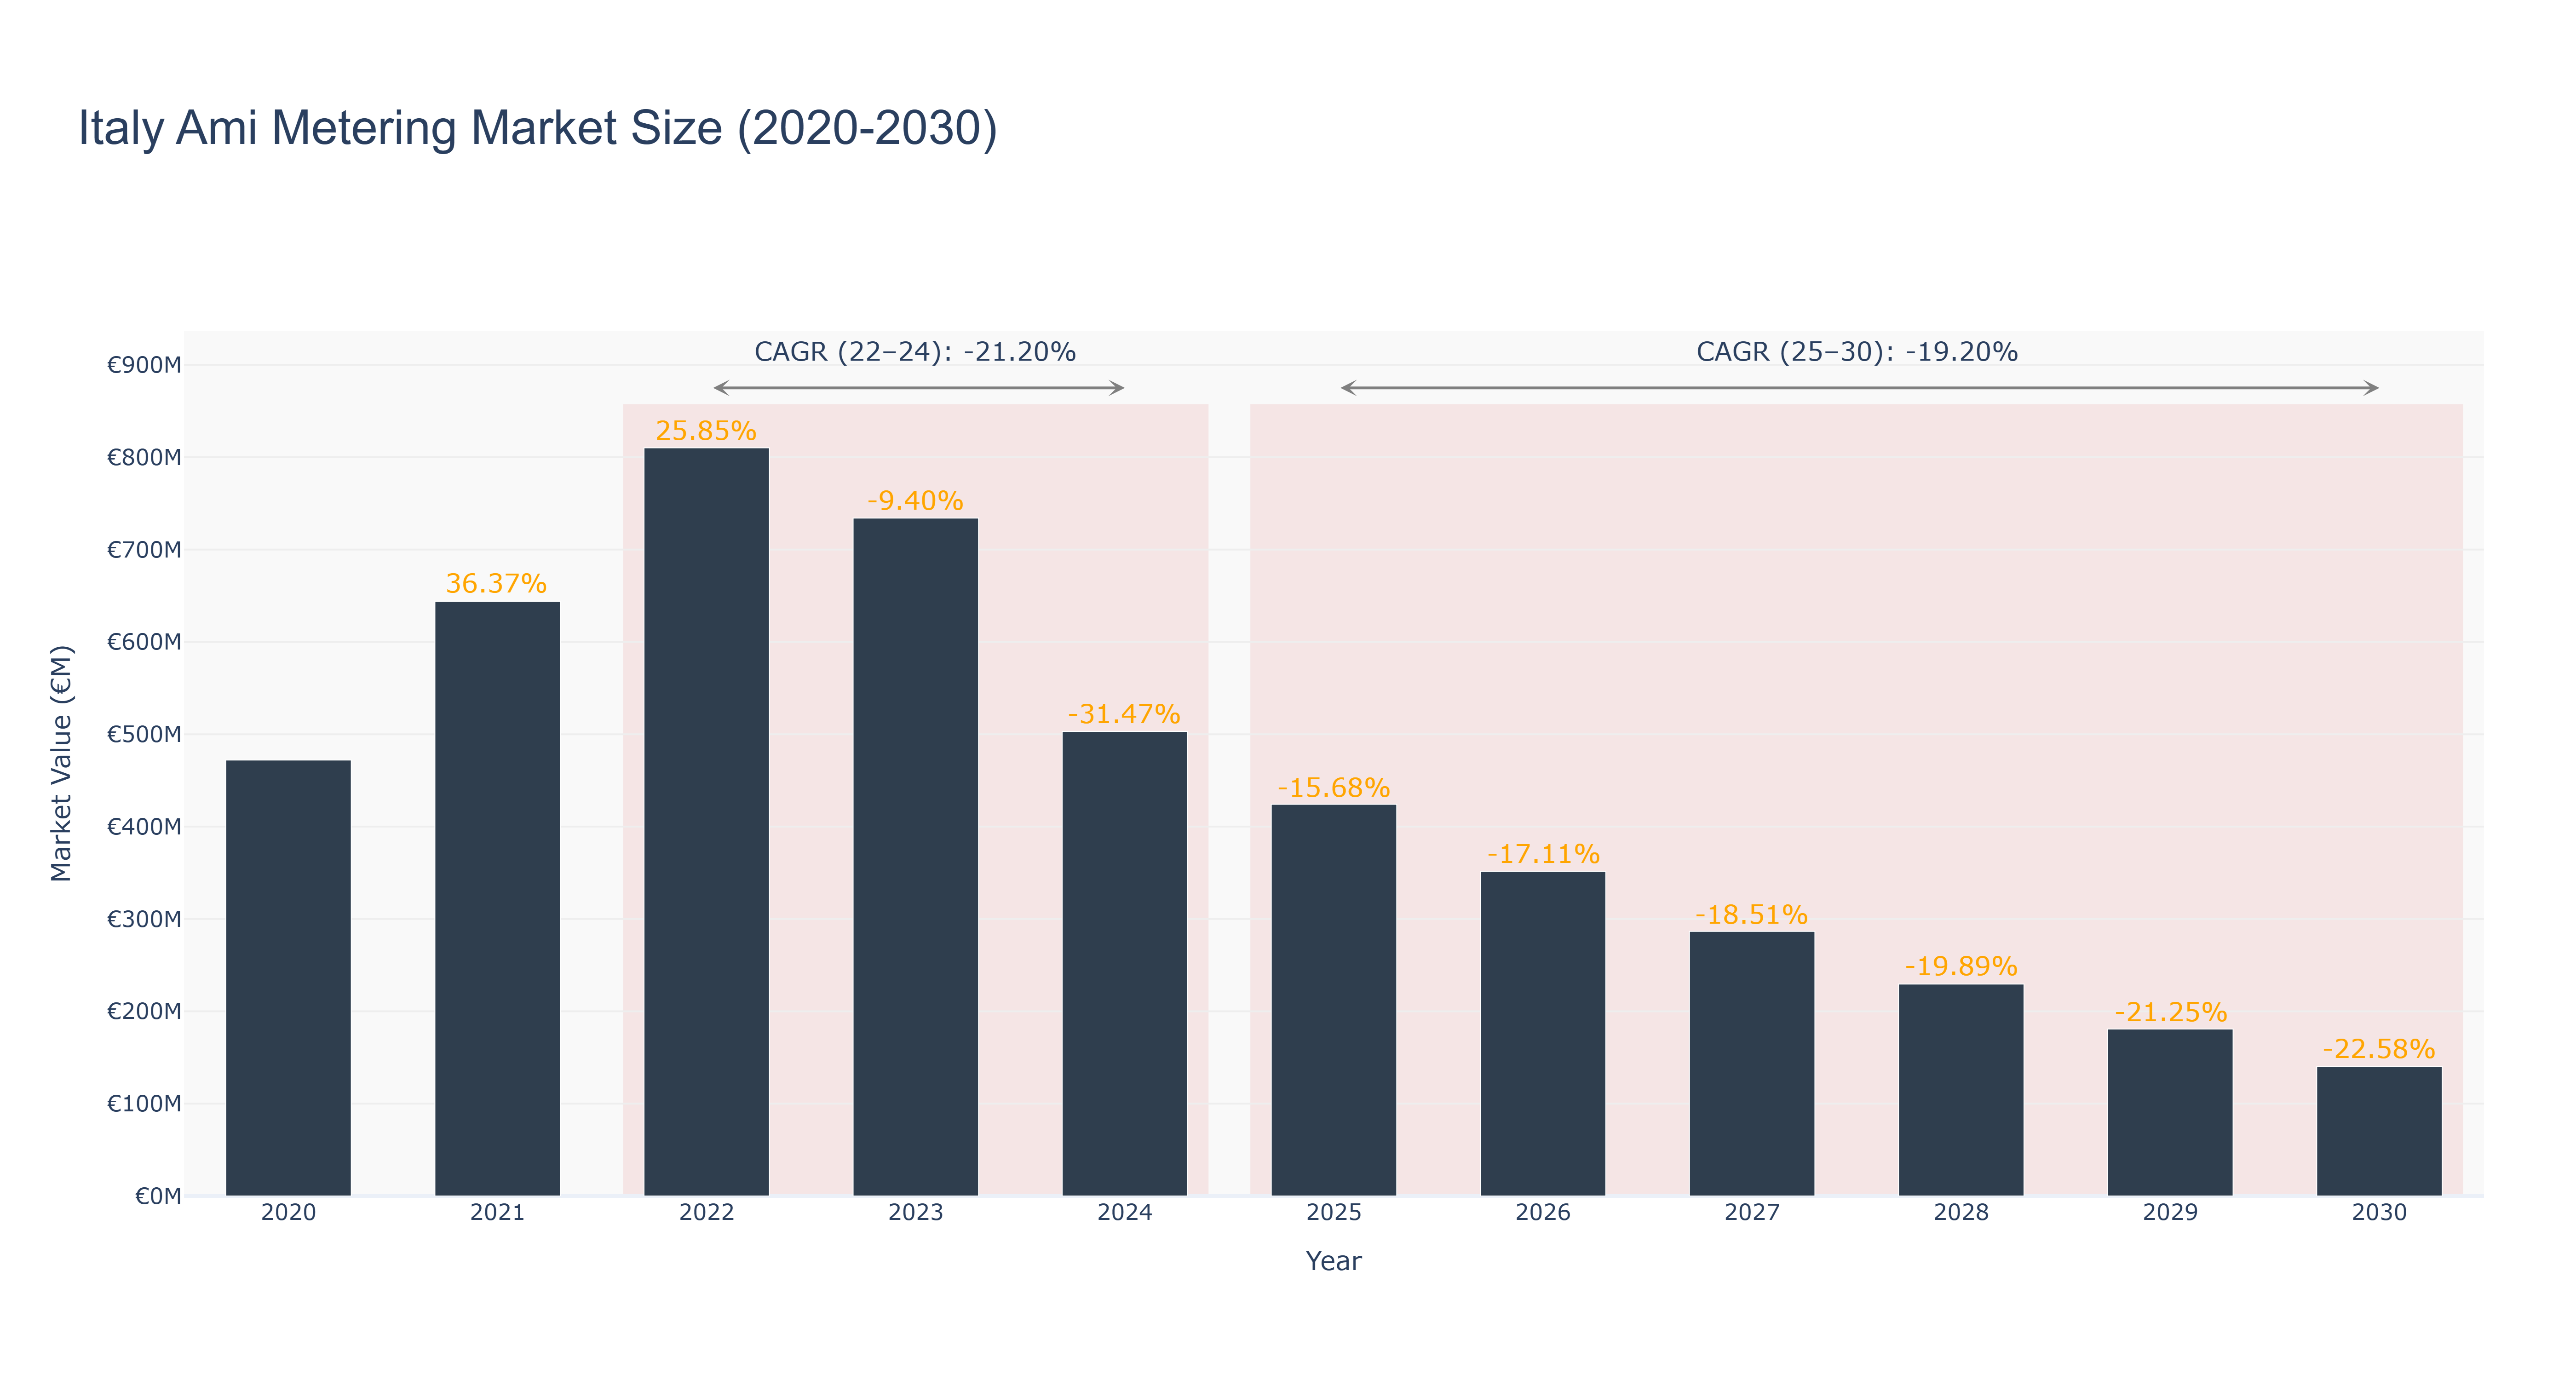
Italy Ami Metering Market has experienced a fluctuating trend in market size over the years. The peak market size of €810.23 million was recorded in 2022, followed by a decline to €139.95 million in 2030. The actual market size decreased steadily from 2020 to 2024, with a significant drop of -31.47% in 2024. Forecasted market size from 2025 to 2030 shows a continuing downward trend with a CAGR of -19.20%. The market's challenges include regulatory changes impacting investment in metering infrastructure and technological advancements leading to cost reductions. Despite the current downturn, upcoming projects in Italy's Ami Metering Market aim to enhance smart metering systems, promoting energy efficiency and sustainability. Industry drivers such as government initiatives for renewable energy integration and the need for accurate consumption data will influence future market dynamics.
Italy Ami Metering Market: Production & Trade Performance (2019-2025)
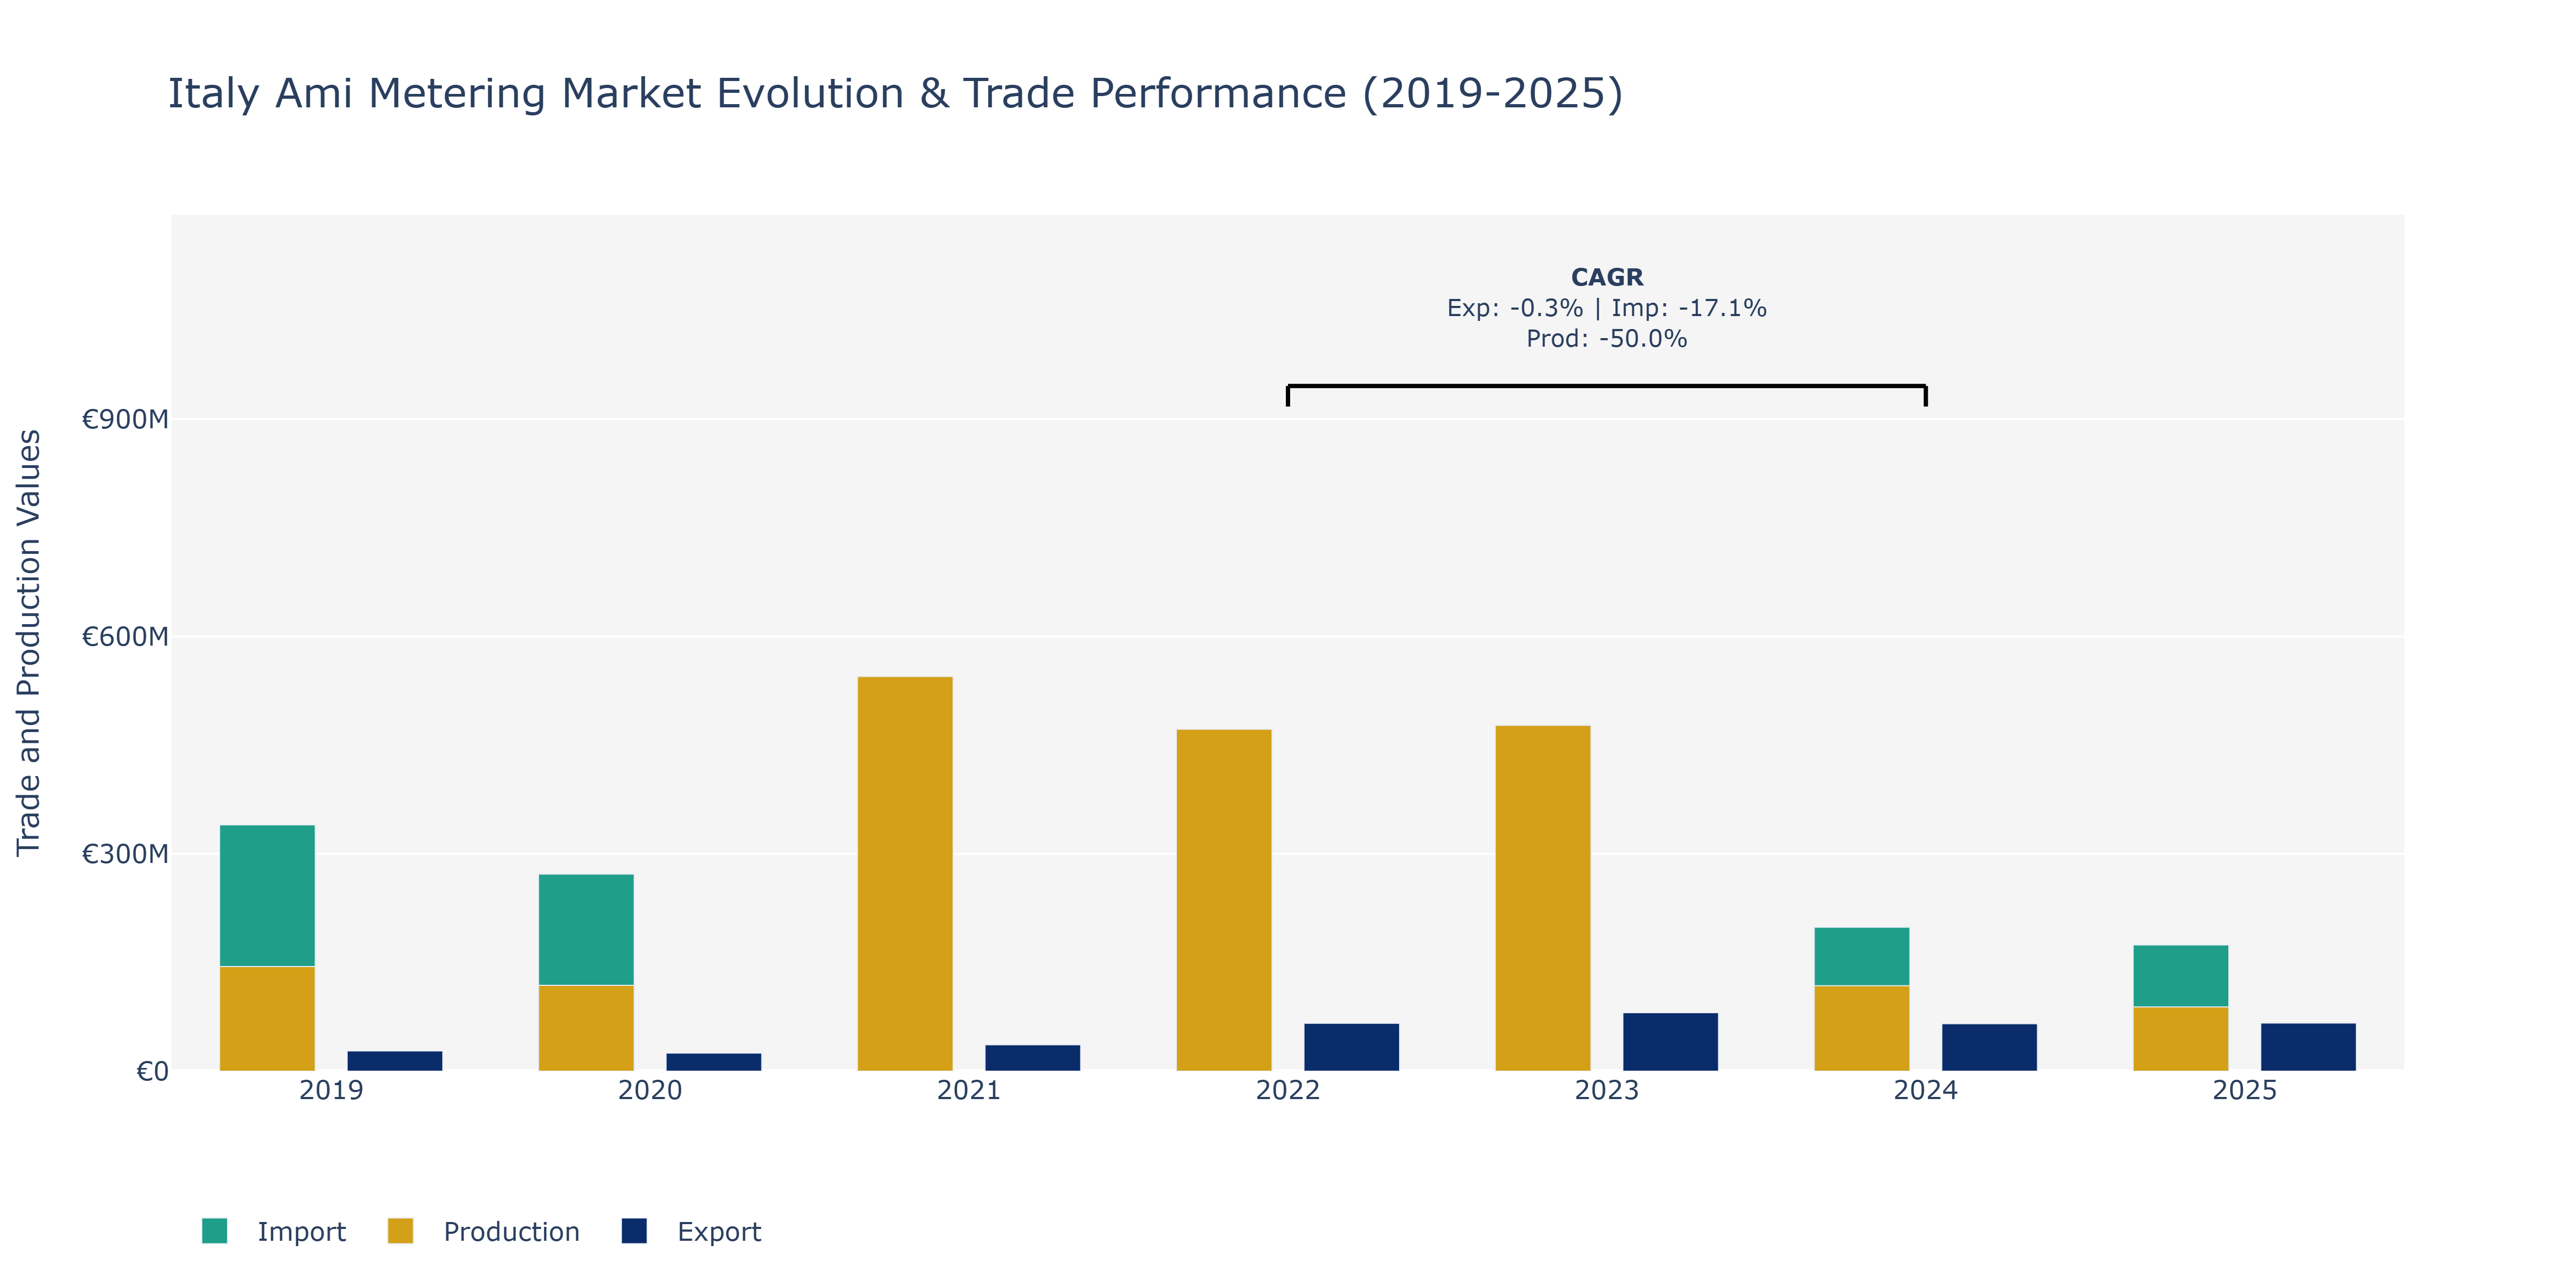
In the Italy Ami Metering Market, from 2019 to 2025, a mix of trends and fluctuations can be observed in Exports, Imports, and Production. Exports started at €27.9 million in 2019, dipped to €25.07 million in 2020, then saw a significant increase to €80.79 million in 2023 before slightly decreasing to €66.52 million in 2025. Imports followed a similar pattern, starting at €339.89 million in 2019, decreasing to €272.08 million in 2020, and further declining to €174.25 million in 2025. Production, on the other hand, varied greatly, peaking at €544.72 million in 2021 and then dropping to €88.69 million in 2025. These fluctuations could be attributed to changes in global demand for AMI metering technologies, shifts in regulatory frameworks impacting trade, and advancements in domestic production capabilities. The decrease in imports may signify increased self-sufficiency or changes in sourcing strategies within the market.
Key Highlights of the Report:
- Italy AMI Metering Market Outlook
- Market Size of Italy AMI Metering Market, 2025
- Forecast of Italy AMI Metering Market, 2032
- Historical Data and Forecast of Italy AMI Metering Revenues & Volume for the Period 2022-2032F
- Italy AMI Metering Market Trend Evolution
- Italy AMI Metering Market Drivers and Challenges
- Italy AMI Metering Price Trends
- Italy AMI Metering Porter's Five Forces
- Italy AMI Metering Industry Life Cycle
- Historical Data and Forecast of Italy AMI Metering Market Revenues & Volume By Meter Type for the Period 2022-2032F
- Historical Data and Forecast of Italy AMI Metering Market Revenues & Volume By Electric AMI Meters for the Period 2022-2032F
- Historical Data and Forecast of Italy AMI Metering Market Revenues & Volume By Water AMI Meters for the Period 2022-2032F
- Historical Data and Forecast of Italy AMI Metering Market Revenues & Volume By Gas AMI Meters for the Period 2022-2032F
- Historical Data and Forecast of Italy AMI Metering Market Revenues & Volume By Multi-Utility AMI Meters for the Period 2022-2032F
- Historical Data and Forecast of Italy AMI Metering Market Revenues & Volume By Application for the Period 2022-2032F
- Historical Data and Forecast of Italy AMI Metering Market Revenues & Volume By Smart Grid for the Period 2022-2032F
- Historical Data and Forecast of Italy AMI Metering Market Revenues & Volume By Water Consumption Tracking for the Period 2022-2032F
- Historical Data and Forecast of Italy AMI Metering Market Revenues & Volume By Gas Usage Monitoring for the Period 2022-2032F
- Historical Data and Forecast of Italy AMI Metering Market Revenues & Volume By Multi-utility Monitoring for the Period 2022-2032F
- Historical Data and Forecast of Italy AMI Metering Market Revenues & Volume By End-Use for the Period 2022-2032F
- Historical Data and Forecast of Italy AMI Metering Market Revenues & Volume By Utility Providers for the Period 2022-2032F
- Historical Data and Forecast of Italy AMI Metering Market Revenues & Volume By Municipalities for the Period 2022-2032F
- Historical Data and Forecast of Italy AMI Metering Market Revenues & Volume By Energy Providers for the Period 2022-2032F
- Historical Data and Forecast of Italy AMI Metering Market Revenues & Volume By Commercial Buildings for the Period 2022-2032F
- Italy AMI Metering Import Export Trade Statistics
- Market Opportunity Assessment By Meter Type
- Market Opportunity Assessment By Application
- Market Opportunity Assessment By End-Use
- Italy AMI Metering Top Companies Market Share
- Italy AMI Metering Competitive Benchmarking By Technical and Operational Parameters
- Italy AMI Metering Company Profiles
- Italy AMI Metering Key Strategic Recommendations
Frequently Asked Questions About the Market Study (FAQs):
6Wresearch actively monitors the Italy AMI Metering Market and publishes its comprehensive annual report, highlighting emerging trends, growth drivers, revenue analysis, and forecast outlook. Our insights help businesses to make data-backed strategic decisions with ongoing market dynamics. Our analysts track relevent industries related to the Italy AMI Metering Market, allowing our clients with actionable intelligence and reliable forecasts tailored to emerging regional needs.
Yes, we provide customisation as per your requirements. To learn more, feel free to contact us on sales@6wresearch.com
1 Executive Summary |
2 Introduction |
2.1 Key Highlights of the Report |
2.2 Report Description |
2.3 Market Scope & Segmentation |
2.4 Research Methodology |
2.5 Assumptions |
3 Italy AMI Metering Market Overview |
3.1 Italy Country Macro Economic Indicators |
3.2 Italy AMI Metering Market Revenues & Volume, 2022 & 2032F |
3.3 Italy AMI Metering Market - Industry Life Cycle |
3.4 Italy AMI Metering Market - Porter's Five Forces |
3.5 Italy AMI Metering Market Revenues & Volume Share, By Meter Type, 2022 & 2032F |
3.6 Italy AMI Metering Market Revenues & Volume Share, By Application, 2022 & 2032F |
3.7 Italy AMI Metering Market Revenues & Volume Share, By End-Use, 2022 & 2032F |
4 Italy AMI Metering Market Dynamics |
4.1 Impact Analysis |
4.2 Market Drivers |
4.2.1 Increasing government initiatives and regulations promoting the adoption of advanced metering infrastructure (AMI) in Italy |
4.2.2 Growing focus on energy efficiency and sustainability driving the demand for smart metering solutions |
4.2.3 Rise in investments in smart grid technologies to enhance grid reliability and efficiency |
4.3 Market Restraints |
4.3.1 High initial implementation costs associated with deploying AMI infrastructure |
4.3.2 Data privacy and security concerns hindering the adoption of smart metering solutions |
4.3.3 Resistance from traditional utility companies towards transitioning to AMI technologies |
5 Italy AMI Metering Market Trends |
6 Italy AMI Metering Market, By Types |
6.1 Italy AMI Metering Market, By Meter Type |
6.1.1 Overview and Analysis |
6.1.2 Italy AMI Metering Market Revenues & Volume, By Meter Type, 2022 - 2032F |
6.1.3 Italy AMI Metering Market Revenues & Volume, By Electric AMI Meters, 2022 - 2032F |
6.1.4 Italy AMI Metering Market Revenues & Volume, By Water AMI Meters, 2022 - 2032F |
6.1.5 Italy AMI Metering Market Revenues & Volume, By Gas AMI Meters, 2022 - 2032F |
6.1.6 Italy AMI Metering Market Revenues & Volume, By Multi-Utility AMI Meters, 2022 - 2032F |
6.2 Italy AMI Metering Market, By Application |
6.2.1 Overview and Analysis |
6.2.2 Italy AMI Metering Market Revenues & Volume, By Smart Grid, 2022 - 2032F |
6.2.3 Italy AMI Metering Market Revenues & Volume, By Water Consumption Tracking, 2022 - 2032F |
6.2.4 Italy AMI Metering Market Revenues & Volume, By Gas Usage Monitoring, 2022 - 2032F |
6.2.5 Italy AMI Metering Market Revenues & Volume, By Multi-utility Monitoring, 2022 - 2032F |
6.3 Italy AMI Metering Market, By End-Use |
6.3.1 Overview and Analysis |
6.3.2 Italy AMI Metering Market Revenues & Volume, By Utility Providers, 2022 - 2032F |
6.3.3 Italy AMI Metering Market Revenues & Volume, By Municipalities, 2022 - 2032F |
6.3.4 Italy AMI Metering Market Revenues & Volume, By Energy Providers, 2022 - 2032F |
6.3.5 Italy AMI Metering Market Revenues & Volume, By Commercial Buildings, 2022 - 2032F |
7 Italy AMI Metering Market Import-Export Trade Statistics |
7.1 Italy AMI Metering Market Export to Major Countries |
7.2 Italy AMI Metering Market Imports from Major Countries |
8 Italy AMI Metering Market Key Performance Indicators |
8.1 Percentage increase in the number of installed smart meters in Italy |
8.2 Average time taken for deployment of AMI solutions in various regions of Italy |
8.3 Reduction in energy consumption and carbon emissions attributed to the implementation of AMI technologies |
9 Italy AMI Metering Market - Opportunity Assessment |
9.1 Italy AMI Metering Market Opportunity Assessment, By Meter Type, 2022 & 2032F |
9.2 Italy AMI Metering Market Opportunity Assessment, By Application, 2022 & 2032F |
9.3 Italy AMI Metering Market Opportunity Assessment, By End-Use, 2022 & 2032F |
10 Italy AMI Metering Market - Competitive Landscape |
10.1 Italy AMI Metering Market Revenue Share, By Companies, 2025 |
10.2 Italy AMI Metering Market Competitive Benchmarking, By Operating and Technical Parameters |
11 Company Profiles |
12 Recommendations |
13 Disclaimer |
Export potential assessment - trade Analytics for 2030
Export potential enables firms to identify high-growth global markets with greater confidence by combining advanced trade intelligence with a structured quantitative methodology. The framework analyzes emerging demand trends and country-level import patterns while integrating macroeconomic and trade datasets such as GDP and population forecasts, bilateral import–export flows, tariff structures, elasticity differentials between developed and developing economies, geographic distance, and import demand projections. Using weighted trade values from 2020–2024 as the base period to project country-to-country export potential for 2030, these inputs are operationalized through calculated drivers such as gravity model parameters, tariff impact factors, and projected GDP per-capita growth. Through an analysis of hidden potentials, demand hotspots, and market conditions that are most favorable to success, this method enables firms to focus on target countries, maximize returns, and global expansion with data, backed by accuracy.
By factoring in the projected importer demand gap that is currently unmet and could be potential opportunity, it identifies the potential for the Exporter (Country) among 190 countries, against the general trade analysis, which identifies the biggest importer or exporter.
To discover high-growth global markets and optimize your business strategy:
Click Here
Pricing
- Single User License$ 1,995
- Department License$ 2,400
- Site License$ 3,120
- Global License$ 3,795

Search
Thought Leadership and Analyst Meet


Our Clients
Latest Reports
- Canada Cloud CFD Market (2026-2032) | Size & Revenue, Industry, Growth, Competitive Landscape, Forecast, Segmentation, Value, Outlook, Trends, Share, Analysis, Companies
- Taiwan Food Delivery Platform Market (2026-2032) | Companies, Outlook, Analysis, Trends, Value, Revenue, Segmentation, Share, Forecast, Competitive Landscape, Growth, Size & Forecast
- United Kingdom (UK) Long-term Care Insurance Market (2026-2032) | Growth, Share, Consumer Insights, Drivers, Opportunities, Competition, Pricing Analysis, Segments, Restraints, Companies, Competitive, Value, Outlook, Size, Demand, Analysis, Challenges, Strategic Insights, Investment Trends, Revenue, Trends, Supply, Forecast
- United Kingdom (UK) Long Term Care Market (2026-2032) | Companies, Outlook, Analysis, Trends, Value, Revenue, Segmentation, Share, Forecast, Competitive Landscape, Growth, Size & Forecast
- Iraq Insulation and Waterproofing Market (2026-2032) | Outlook, Drivers, Growth, Size, Share, Industry, Revenue, Trends, Demand, Competitive, Strategic Insights, Opportunities, Segments, Companies, Challenges, Strategy, Consumer Insights, Analysis, Investment Trends, Value, Segmentation, Forecast, Restraints
- India Switchgear Market Outlook (2026-2032) | Size, Share, Trends, Growth, Revenue, Forecast, Analysis, Value, Outlook
- Pakistan Contraceptive Implants Market (2025-2031) | Demand, Growth, Size, Share, Industry, Pricing Analysis, Competitive, Strategic Insights, Strategy, Consumer Insights, Analysis, Investment Trends, Opportunities, Revenue, Segments, Value, Segmentation, Supply, Forecast, Restraints, Outlook, Competition, Drivers, Trends, Companies, Challenges
- Sri Lanka Packaging Market (2026-2032) | Outlook, Competition, Drivers, Trends, Demand, Pricing Analysis, Competitive, Strategic Insights, Companies, Challenges, Strategy, Consumer Insights, Analysis, Investment Trends, Opportunities, Growth, Size, Share, Industry, Revenue, Segments, Value, Segmentation, Supply, Forecast, Restraints
- India Kids Watches Market (2026-2032) | Strategy, Consumer Insights, Analysis, Investment Trends, Opportunities, Growth, Size, Share, Industry, Revenue, Segments, Value, Segmentation, Supply, Forecast, Restraints, Outlook, Competition, Drivers, Trends, Demand, Pricing Analysis, Competitive, Strategic Insights, Companies, Challenges
- Saudi Arabia Core Assurance Service Market (2025-2031) | Strategy, Consumer Insights, Analysis, Investment Trends, Opportunities, Growth, Size, Share, Industry, Revenue, Segments, Value, Segmentation, Supply, Forecast, Restraints, Outlook, Competition, Drivers, Trends, Demand, Pricing Analysis, Competitive, Strategic Insights, Companies, Challenges
Industry Events and Analyst Meet

India EV Show 2026

EV tech India Expo 2026

Auto Tech Asia 2026

Battery Tech India 2026

Smart Production Solutions Guangzhou 2026
Whitepaper
- Middle East & Africa Commercial Security Market Click here to view more.
- Middle East & Africa Fire Safety Systems & Equipment Market Click here to view more.
- GCC Drone Market Click here to view more.
- Middle East Lighting Fixture Market Click here to view more.
- GCC Physical & Perimeter Security Market Click here to view more.
6WResearch In News
- Doha a strategic location for EV manufacturing hub: IPA Qatar
- Demand for luxury TVs surging in the GCC, says Samsung
- Empowering Growth: The Thriving Journey of Bangladesh’s Cable Industry
- Demand for luxury TVs surging in the GCC, says Samsung
- Video call with a traditional healer? Once unthinkable, it’s now common in South Africa
- Intelligent Buildings To Smooth GCC’s Path To Net Zero