Italy Nano Gold Market (2026-2032) | Segments, Consumer Insights, Drivers, Forecast, Supply, Restraints, Challenges, Industry, Size, Analysis, Strategy, Competitive, Competition, Segmentation, Share, Investment Trends, Opportunities, Trends, Outlook, Revenue, Demand, Companies, Value, Pricing Analysis, Growth, Strategic Insights
Market Forecast By Form (Nanoparticles, Colloidal Gold, Nano Gold Wires, Nano Gold Films, Hybrid Nano Gold), By Application (Drug Delivery, Diagnostics, Electronics, Catalysis, Cosmetics), By Particle Size (Below 10 nm, 10-50 nm, 50-100 nm, Above 100 nm, Custom Size), By Function (Targeted Therapy, Imaging Contrast, Conductivity, Catalytic Activity, Anti-Aging), By Technology (Biofunctionalization, Surface Plasmon Resonance, Nano-Interconnects, Thin-Film Deposition, Biocompatible Coatings) And Competitive Landscape
| Product Code: ETC12964881 | Publication Date: Apr 2025 | Updated Date: Apr 2026 | Product Type: Market Research Report | |
| Publisher: 6Wresearch | No. of Pages: 65 | No. of Figures: 34 | No. of Tables: 19 | |
Italy Nano Gold Market Size (2020-2030)
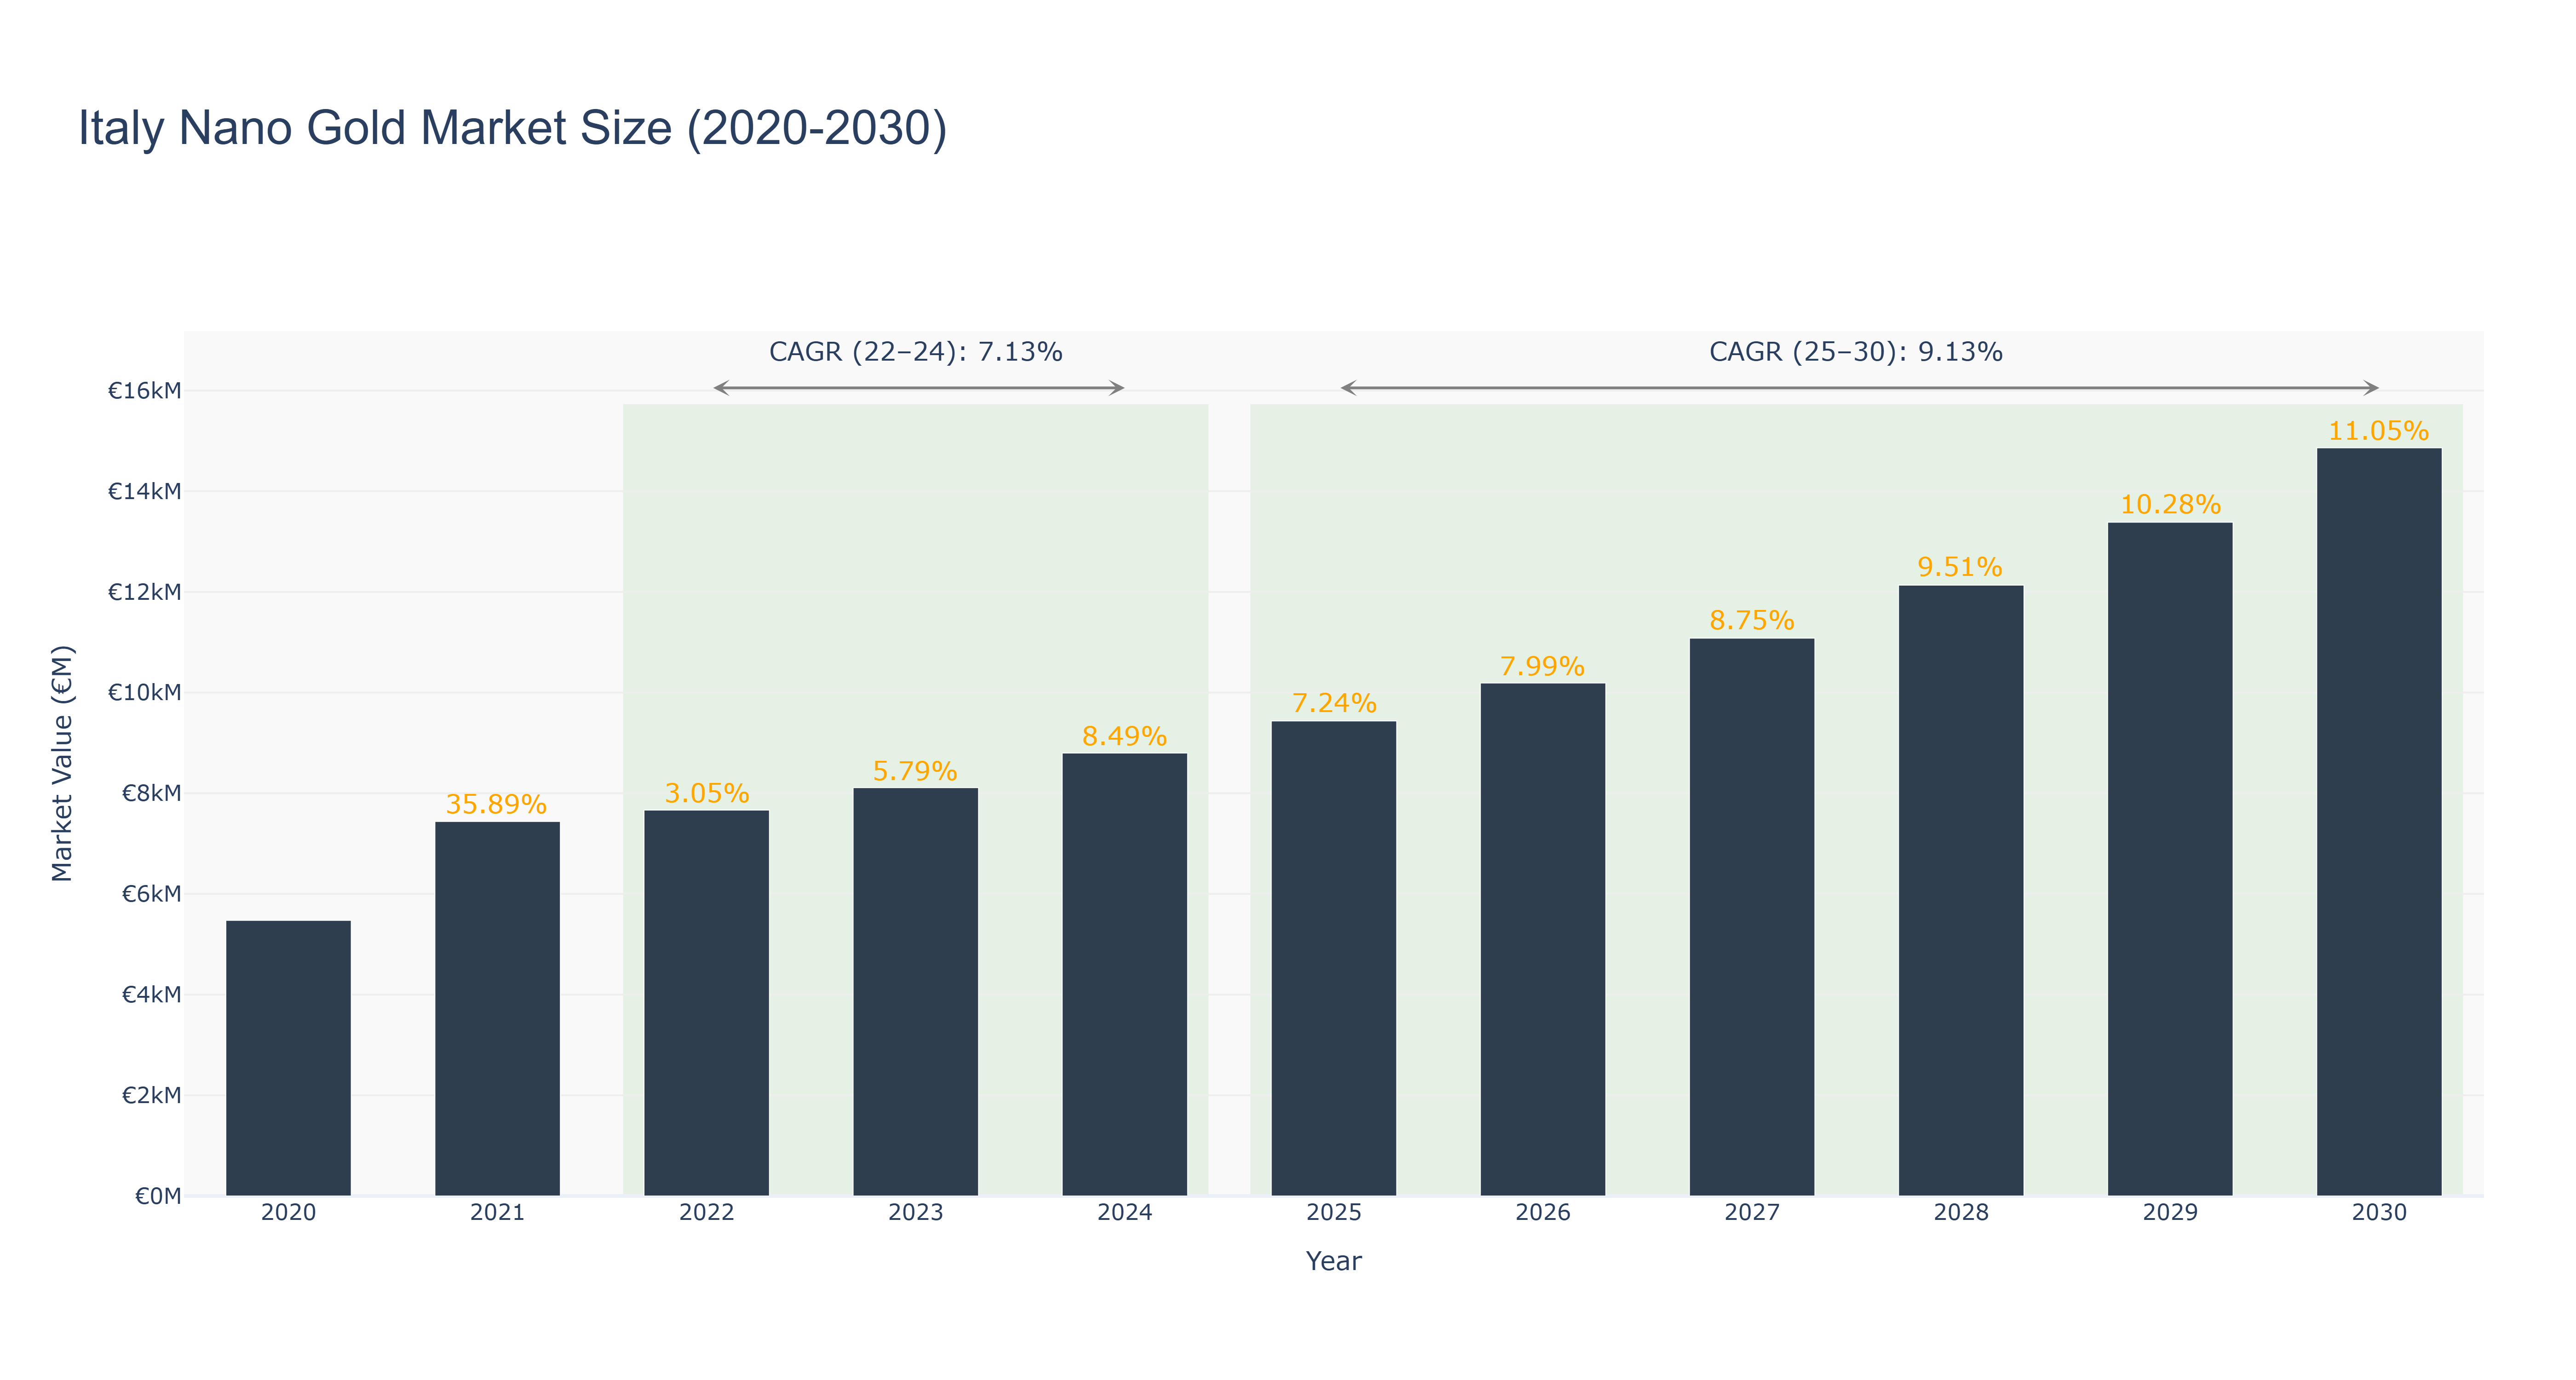
Italy Nano Gold Market has shown a promising growth trajectory. The peak market size of €14862.43 million is forecasted for 2030, with a steady increase from €5475.03 million in 2020. Notably, the market size is expected to reach €9436.10 million by 2025, reflecting a robust CAGR of 7.24% from 2020 to 2024. The forecasted CAGR from 2025 to 2030 stands at 9.13%. This growth can be attributed to increasing demand for nano gold in various industries such as healthcare, electronics, and cosmetics. To sustain this momentum, Italy is planning to invest in research and development initiatives to further enhance the application of nano gold in cutting-edge technologies, ensuring continued market expansion. The market's upward trend is expected to persist, driven by technological advancements and innovative product developments in the nano gold sector.
Italy Nano Gold Market: Production & Trade Performance (2019-2025)
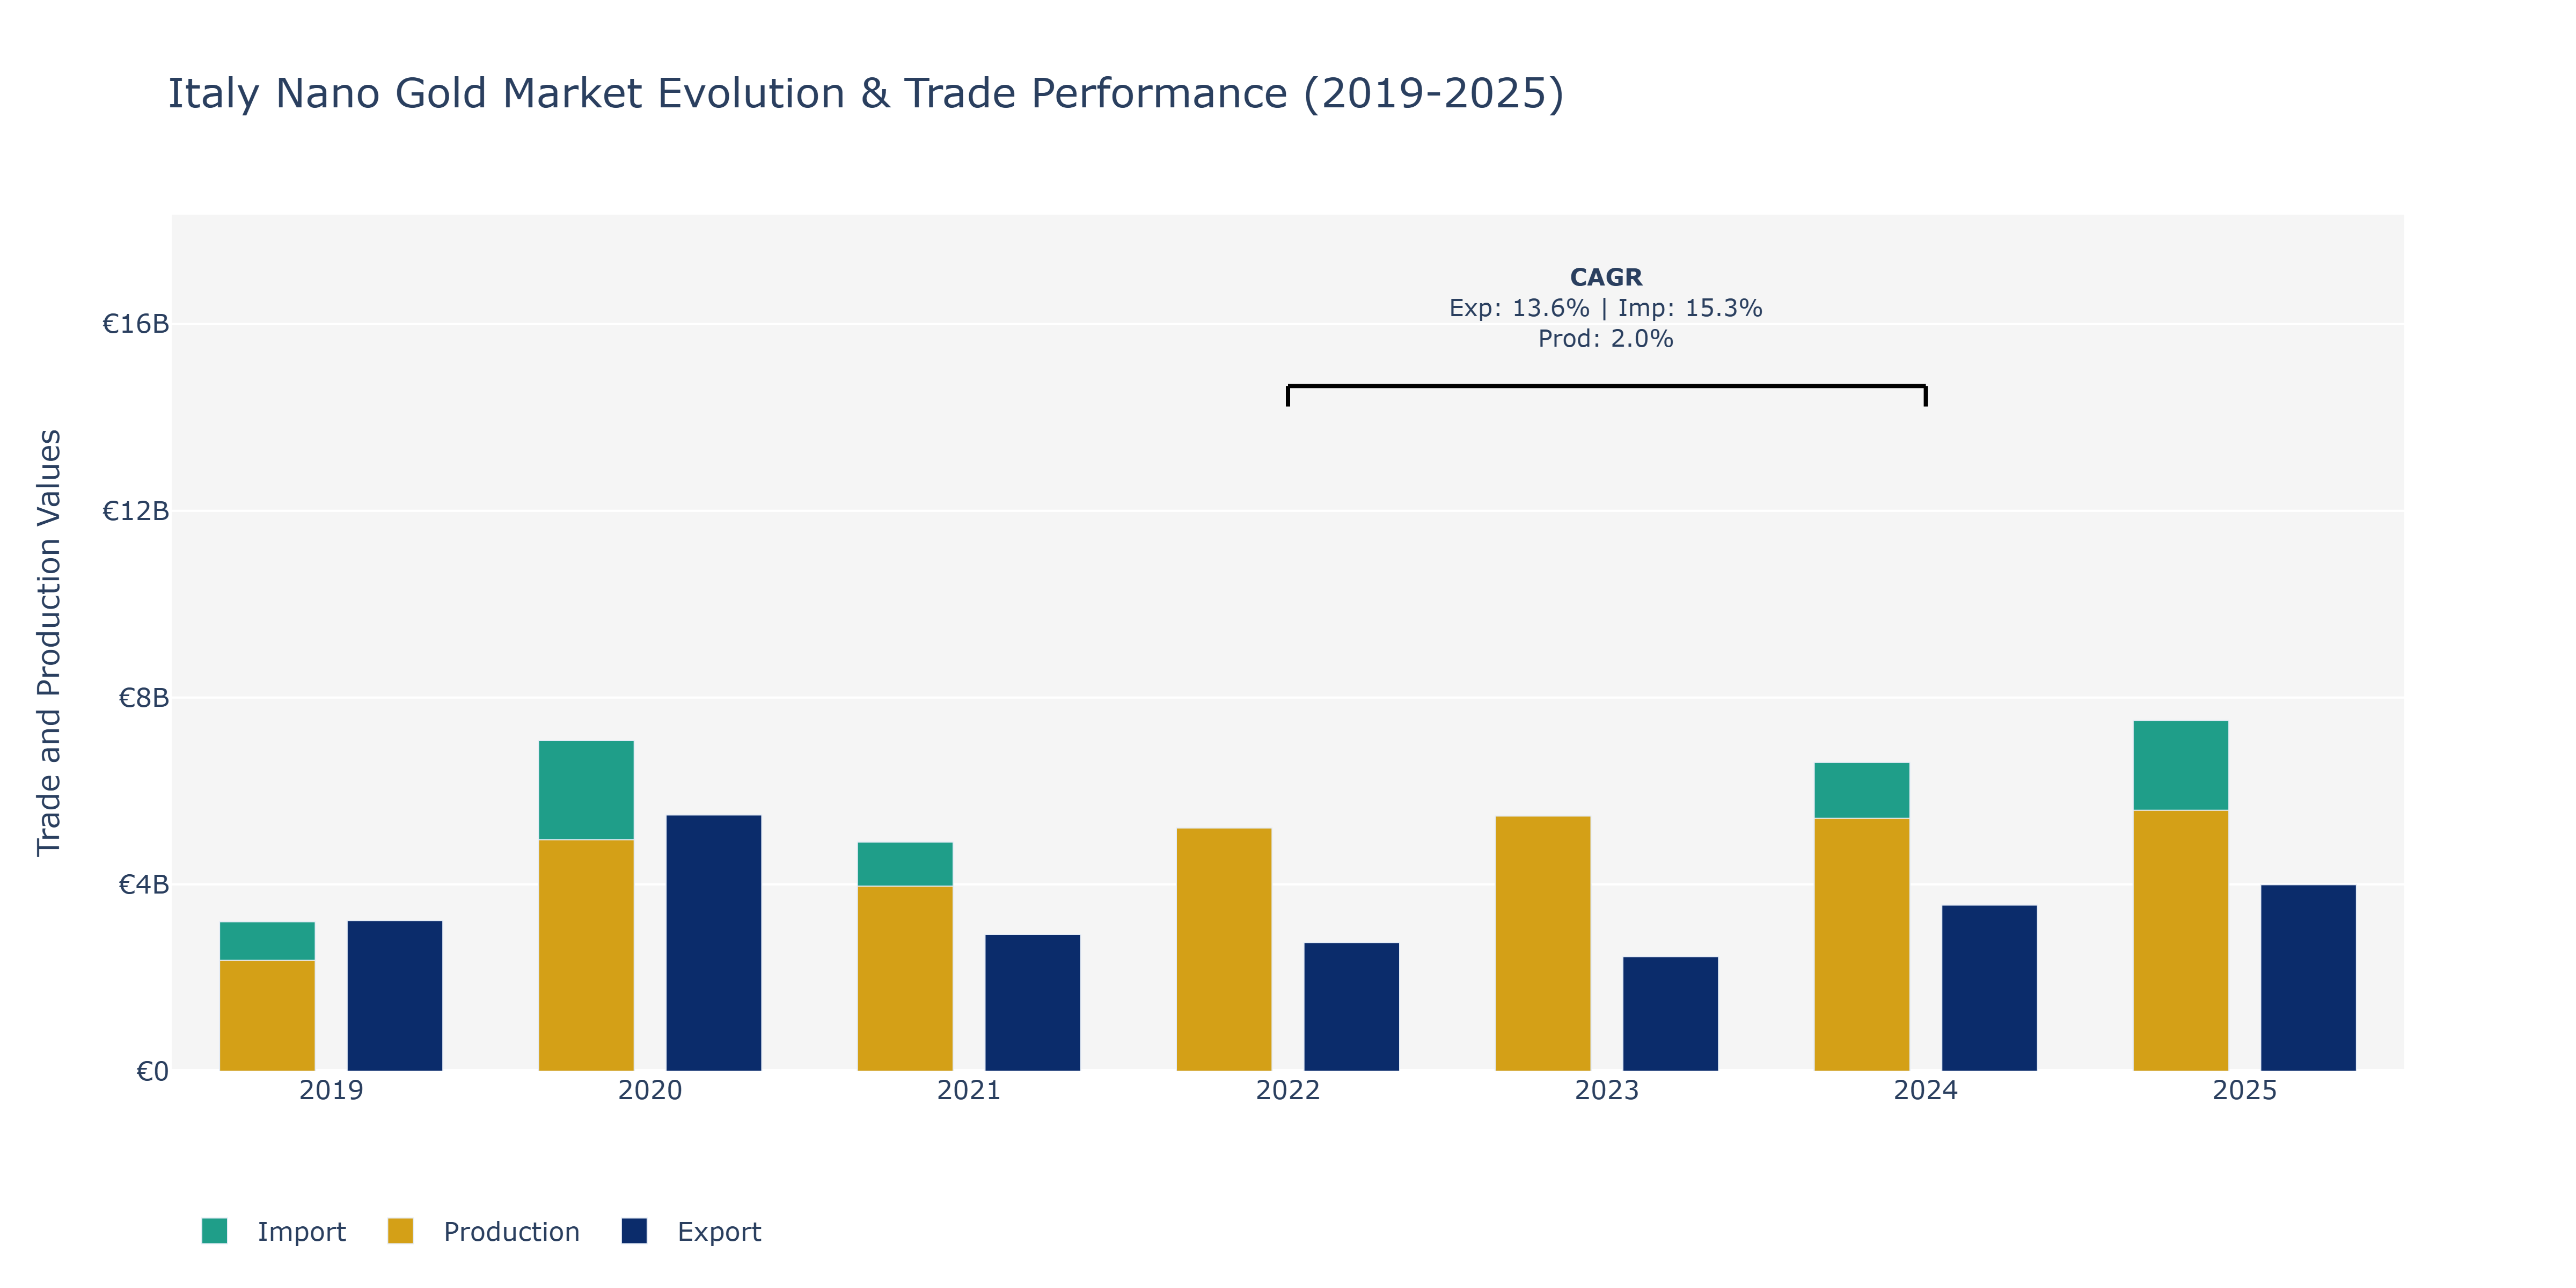
Between 2019 and 2025, the Italy Nano Gold Market experienced notable fluctuations in Exports, Imports, and Production. In 2020, Exports surged to over €5.49 billion, marking a significant peak compared to the previous and subsequent years. However, by 2023, Exports decreased to around €2.45 billion, reflecting a decline in international trade. Imports followed a similar pattern, peaking in 2020 at approximately €7.08 billion before decreasing to about €4.0 billion in 2023. Production, on the other hand, demonstrated a more consistent trend, with a slight increase from around €2.37 billion in 2019 to over €5.58 billion in 2025. The fluctuations in Exports and Imports could be attributed to global economic conditions impacting demand and supply chains. The steady growth in Production indicates a potentially growing domestic market and technological advancements in nano gold manufacturing processes, aligning with the increasing application of nano gold in healthcare and electronics, as reported by industry sources.
Key Highlights of the Report:
- Italy Nano Gold Market Outlook
- Market Size of Italy Nano Gold Market, 2025
- Forecast of Italy Nano Gold Market, 2032
- Historical Data and Forecast of Italy Nano Gold Revenues & Volume for the Period 2022-2032F
- Italy Nano Gold Market Trend Evolution
- Italy Nano Gold Market Drivers and Challenges
- Italy Nano Gold Price Trends
- Italy Nano Gold Porter's Five Forces
- Italy Nano Gold Industry Life Cycle
- Historical Data and Forecast of Italy Nano Gold Market Revenues & Volume By Form for the Period 2022-2032F
- Historical Data and Forecast of Italy Nano Gold Market Revenues & Volume By Nanoparticles for the Period 2022-2032F
- Historical Data and Forecast of Italy Nano Gold Market Revenues & Volume By Colloidal Gold for the Period 2022-2032F
- Historical Data and Forecast of Italy Nano Gold Market Revenues & Volume By Nano Gold Wires for the Period 2022-2032F
- Historical Data and Forecast of Italy Nano Gold Market Revenues & Volume By Nano Gold Films for the Period 2022-2032F
- Historical Data and Forecast of Italy Nano Gold Market Revenues & Volume By Hybrid Nano Gold for the Period 2022 - 2032F
- Historical Data and Forecast of Italy Nano Gold Market Revenues & Volume By Application for the Period 2022-2032F
- Historical Data and Forecast of Italy Nano Gold Market Revenues & Volume By Drug Delivery for the Period 2022-2032F
- Historical Data and Forecast of Italy Nano Gold Market Revenues & Volume By Diagnostics for the Period 2022-2032F
- Historical Data and Forecast of Italy Nano Gold Market Revenues & Volume By Electronics for the Period 2022-2032F
- Historical Data and Forecast of Italy Nano Gold Market Revenues & Volume By Catalysis for the Period 2022-2032F
- Historical Data and Forecast of Italy Nano Gold Market Revenues & Volume By Cosmetics for the Period 2022 - 2032F
- Historical Data and Forecast of Italy Nano Gold Market Revenues & Volume By Particle Size for the Period 2022-2032F
- Historical Data and Forecast of Italy Nano Gold Market Revenues & Volume By Below 10 nm for the Period 2022-2032F
- Historical Data and Forecast of Italy Nano Gold Market Revenues & Volume By 10-50 nm for the Period 2022-2032F
- Historical Data and Forecast of Italy Nano Gold Market Revenues & Volume By 50-100 nm for the Period 2022-2032F
- Historical Data and Forecast of Italy Nano Gold Market Revenues & Volume By Above 100 nm for the Period 2022-2032F
- Historical Data and Forecast of Italy Nano Gold Market Revenues & Volume By Custom Size for the Period 2022 - 2032F
- Historical Data and Forecast of Italy Nano Gold Market Revenues & Volume By Function for the Period 2022-2032F
- Historical Data and Forecast of Italy Nano Gold Market Revenues & Volume By Targeted Therapy for the Period 2022-2032F
- Historical Data and Forecast of Italy Nano Gold Market Revenues & Volume By Imaging Contrast for the Period 2022-2032F
- Historical Data and Forecast of Italy Nano Gold Market Revenues & Volume By Conductivity for the Period 2022-2032F
- Historical Data and Forecast of Italy Nano Gold Market Revenues & Volume By Catalytic Activity for the Period 2022-2032F
- Historical Data and Forecast of Italy Nano Gold Market Revenues & Volume By Anti-Aging for the Period 2022 - 2032F
- Historical Data and Forecast of Italy Nano Gold Market Revenues & Volume By Technology for the Period 2022-2032F
- Historical Data and Forecast of Italy Nano Gold Market Revenues & Volume By Biofunctionalization for the Period 2022-2032F
- Historical Data and Forecast of Italy Nano Gold Market Revenues & Volume By Surface Plasmon Resonance for the Period 2022-2032F
- Historical Data and Forecast of Italy Nano Gold Market Revenues & Volume By Nano-Interconnects for the Period 2022-2032F
- Historical Data and Forecast of Italy Nano Gold Market Revenues & Volume By Thin-Film Deposition for the Period 2022 - 2032F
- Historical Data and Forecast of Italy Nano Gold Market Revenues & Volume By Biocompatible Coatings for the Period 2022 - 2032F
- Italy Nano Gold Import Export Trade Statistics
- Market Opportunity Assessment By Form
- Market Opportunity Assessment By Application
- Market Opportunity Assessment By Particle Size
- Market Opportunity Assessment By Function
- Market Opportunity Assessment By Technology
- Italy Nano Gold Top Companies Market Share
- Italy Nano Gold Competitive Benchmarking By Technical and Operational Parameters
- Italy Nano Gold Company Profiles
- Italy Nano Gold Key Strategic Recommendations
Frequently Asked Questions About the Market Study (FAQs):
6Wresearch actively monitors the Italy Nano Gold Market and publishes its comprehensive annual report, highlighting emerging trends, growth drivers, revenue analysis, and forecast outlook. Our insights help businesses to make data-backed strategic decisions with ongoing market dynamics. Our analysts track relevent industries related to the Italy Nano Gold Market, allowing our clients with actionable intelligence and reliable forecasts tailored to emerging regional needs.
Yes, we provide customisation as per your requirements. To learn more, feel free to contact us on sales@6wresearch.com
1 Executive Summary |
2 Introduction |
2.1 Key Highlights of the Report |
2.2 Report Description |
2.3 Market Scope & Segmentation |
2.4 Research Methodology |
2.5 Assumptions |
3 Italy Nano Gold Market Overview |
3.1 Italy Country Macro Economic Indicators |
3.2 Italy Nano Gold Market Revenues & Volume, 2022 & 2032F |
3.3 Italy Nano Gold Market - Industry Life Cycle |
3.4 Italy Nano Gold Market - Porter's Five Forces |
3.5 Italy Nano Gold Market Revenues & Volume Share, By Form, 2022 & 2032F |
3.6 Italy Nano Gold Market Revenues & Volume Share, By Application, 2022 & 2032F |
3.7 Italy Nano Gold Market Revenues & Volume Share, By Particle Size, 2022 & 2032F |
3.8 Italy Nano Gold Market Revenues & Volume Share, By Function, 2022 & 2032F |
3.9 Italy Nano Gold Market Revenues & Volume Share, By Technology, 2022 & 2032F |
4 Italy Nano Gold Market Dynamics |
4.1 Impact Analysis |
4.2 Market Drivers |
4.2.1 Increasing demand for nano gold in medical and healthcare applications due to its unique properties and potential benefits. |
4.2.2 Growing adoption of nano gold in the electronics industry for improving conductivity and performance of electronic devices. |
4.2.3 Rising investments in research and development activities related to nano gold for exploring new applications and enhancing product performance. |
4.3 Market Restraints |
4.3.1 High production costs associated with nano gold synthesis and manufacturing processes. |
4.3.2 Regulatory challenges and environmental concerns regarding the use of nano gold in various industries. |
4.3.3 Limited awareness and understanding among end-users about the benefits and applications of nano gold products. |
5 Italy Nano Gold Market Trends |
6 Italy Nano Gold Market, By Types |
6.1 Italy Nano Gold Market, By Form |
6.1.1 Overview and Analysis |
6.1.2 Italy Nano Gold Market Revenues & Volume, By Form, 2022 - 2032F |
6.1.3 Italy Nano Gold Market Revenues & Volume, By Nanoparticles, 2022 - 2032F |
6.1.4 Italy Nano Gold Market Revenues & Volume, By Colloidal Gold, 2022 - 2032F |
6.1.5 Italy Nano Gold Market Revenues & Volume, By Nano Gold Wires, 2022 - 2032F |
6.1.6 Italy Nano Gold Market Revenues & Volume, By Nano Gold Films, 2022 - 2032F |
6.1.7 Italy Nano Gold Market Revenues & Volume, By Hybrid Nano Gold, 2022 - 2032F |
6.2 Italy Nano Gold Market, By Application |
6.2.1 Overview and Analysis |
6.2.2 Italy Nano Gold Market Revenues & Volume, By Drug Delivery, 2022 - 2032F |
6.2.3 Italy Nano Gold Market Revenues & Volume, By Diagnostics, 2022 - 2032F |
6.2.4 Italy Nano Gold Market Revenues & Volume, By Electronics, 2022 - 2032F |
6.2.5 Italy Nano Gold Market Revenues & Volume, By Catalysis, 2022 - 2032F |
6.2.6 Italy Nano Gold Market Revenues & Volume, By Cosmetics, 2022 - 2032F |
6.3 Italy Nano Gold Market, By Particle Size |
6.3.1 Overview and Analysis |
6.3.2 Italy Nano Gold Market Revenues & Volume, By Below 10 nm, 2022 - 2032F |
6.3.3 Italy Nano Gold Market Revenues & Volume, By 10-50 nm, 2022 - 2032F |
6.3.4 Italy Nano Gold Market Revenues & Volume, By 50-100 nm, 2022 - 2032F |
6.3.5 Italy Nano Gold Market Revenues & Volume, By Above 100 nm, 2022 - 2032F |
6.3.6 Italy Nano Gold Market Revenues & Volume, By Custom Size, 2022 - 2032F |
6.4 Italy Nano Gold Market, By Function |
6.4.1 Overview and Analysis |
6.4.2 Italy Nano Gold Market Revenues & Volume, By Targeted Therapy, 2022 - 2032F |
6.4.3 Italy Nano Gold Market Revenues & Volume, By Imaging Contrast, 2022 - 2032F |
6.4.4 Italy Nano Gold Market Revenues & Volume, By Conductivity, 2022 - 2032F |
6.4.5 Italy Nano Gold Market Revenues & Volume, By Catalytic Activity, 2022 - 2032F |
6.4.6 Italy Nano Gold Market Revenues & Volume, By Anti-Aging, 2022 - 2032F |
6.5 Italy Nano Gold Market, By Technology |
6.5.1 Overview and Analysis |
6.5.2 Italy Nano Gold Market Revenues & Volume, By Biofunctionalization, 2022 - 2032F |
6.5.3 Italy Nano Gold Market Revenues & Volume, By Surface Plasmon Resonance, 2022 - 2032F |
6.5.4 Italy Nano Gold Market Revenues & Volume, By Nano-Interconnects, 2022 - 2032F |
6.5.5 Italy Nano Gold Market Revenues & Volume, By Thin-Film Deposition, 2022 - 2032F |
6.5.6 Italy Nano Gold Market Revenues & Volume, By Biocompatible Coatings, 2022 - 2032F |
7 Italy Nano Gold Market Import-Export Trade Statistics |
7.1 Italy Nano Gold Market Export to Major Countries |
7.2 Italy Nano Gold Market Imports from Major Countries |
8 Italy Nano Gold Market Key Performance Indicators |
8.1 Research and development expenditure on nano gold technologies and applications. |
8.2 Number of patents filed for nano gold-based innovations and technologies. |
8.3 Adoption rate of nano gold in key industries such as healthcare, electronics, and cosmetics. |
9 Italy Nano Gold Market - Opportunity Assessment |
9.1 Italy Nano Gold Market Opportunity Assessment, By Form, 2022 & 2032F |
9.2 Italy Nano Gold Market Opportunity Assessment, By Application, 2022 & 2032F |
9.3 Italy Nano Gold Market Opportunity Assessment, By Particle Size, 2022 & 2032F |
9.4 Italy Nano Gold Market Opportunity Assessment, By Function, 2022 & 2032F |
9.5 Italy Nano Gold Market Opportunity Assessment, By Technology, 2022 & 2032F |
10 Italy Nano Gold Market - Competitive Landscape |
10.1 Italy Nano Gold Market Revenue Share, By Companies, 2025 |
10.2 Italy Nano Gold Market Competitive Benchmarking, By Operating and Technical Parameters |
11 Company Profiles |
12 Recommendations |
13 Disclaimer |
Global Go To Market Strategy - 2030
Export potential enables firms to identify high-growth global markets with greater confidence by combining advanced trade intelligence with a structured quantitative methodology. The framework analyzes emerging demand trends and country-level import patterns while integrating macroeconomic and trade datasets such as GDP and population forecasts, bilateral import–export flows, tariff structures, elasticity differentials between developed and developing economies, geographic distance, and import demand projections. Using weighted trade values from 2020–2024 as the base period to project country-to-country export potential for 2030, these inputs are operationalized through calculated drivers such as gravity model parameters, tariff impact factors, and projected GDP per-capita growth. Through an analysis of hidden potentials, demand hotspots, and market conditions that are most favorable to success, this method enables firms to focus on target countries, maximize returns, and global expansion with data, backed by accuracy.
By factoring in the projected importer demand gap that is currently unmet and could be potential opportunity, it identifies the potential for the Exporter (Country) among 190 countries, against the general trade analysis, which identifies the biggest importer or exporter.
To discover high-growth global markets and optimize your business strategy:
Click Here
Pricing
- Single User License$ 1,995
- Department License$ 2,400
- Site License$ 3,120
- Global License$ 3,795

Leadership Perspectives from Industry Events
Search
Thought Leadership and Analyst Meet


Our Clients
6WResearch In News
- Doha a strategic location for EV manufacturing hub: IPA Qatar
- Demand for luxury TVs surging in the GCC, says Samsung
- Empowering Growth: The Thriving Journey of Bangladesh’s Cable Industry
- Demand for luxury TVs surging in the GCC, says Samsung
- Video call with a traditional healer? Once unthinkable, it’s now common in South Africa
- Intelligent Buildings To Smooth GCC’s Path To Net Zero
Latest Reports
- Taiwan Airport Wireless Infrastructure Market (2026-2032)
- Vietnam Airport Wireless Infrastructure Market (2026-2032)
- Thailand Airport Wireless Infrastructure Market (2026-2032)
- South Korea Airport Wireless Infrastructure Market (2026-2032)
- Romania Airport Wireless Infrastructure Market (2026-2032)
- Qatar Airport Wireless Infrastructure Market (2026-2032)
- Philippines Airport Wireless Infrastructure Market (2026-2032)
- Japan Airport Wireless Infrastructure Market (2026-2032)
- Taiwan Airport Winter Services Market (2026-2032)
- Vietnam Airport Winter Services Market (2026-2032)
Industry Events and Analyst Meet

HIMTEX 2026

India Refining Summit 2026

India EV Show 2026

EV tech India Expo 2026

Auto Tech Asia 2026
Whitepaper
- Middle East & Africa Commercial Security Market Click here to view more.
- Middle East & Africa Fire Safety Systems & Equipment Market Click here to view more.
- GCC Drone Market Click here to view more.
- Middle East Lighting Fixture Market Click here to view more.
- GCC Physical & Perimeter Security Market Click here to view more.