Japan Ashwagandha Market (2025-2031) | Companies, Growth, Outlook, Competitive Landscape, Size & Revenue, Analysis, Segmentation, Forecast, Value, Industry, Share, Trends
Market Forecast By Type (KSM-66, Sensoril, Hydro-Alcoholic Ashwagandha, Crude Ashwagandha), By Product Type (Ashwagandha Root Products, Ashwagandha Leaf Products, Ashwagandha Leaf, Root Mix Products), By Category (Regular, Full Spectrum), By Function (Improved Stamina, Improved Immunity, Overall Wellbeing, Reduced Anxiety and Stress, Brain Health, Muscle Strength, Others), By Application (Food & Beverages, Pharmaceutical, Dietary Supplements, Sports Nutrition, Others) And Competitive Landscape
| Product Code: ETC7731747 | Publication Date: Sep 2024 | Updated Date: Oct 2025 | Product Type: Market Research Report | |
| Publisher: 6Wresearch | Author: Summon Dutta | No. of Pages: 75 | No. of Figures: 35 | No. of Tables: 20 |
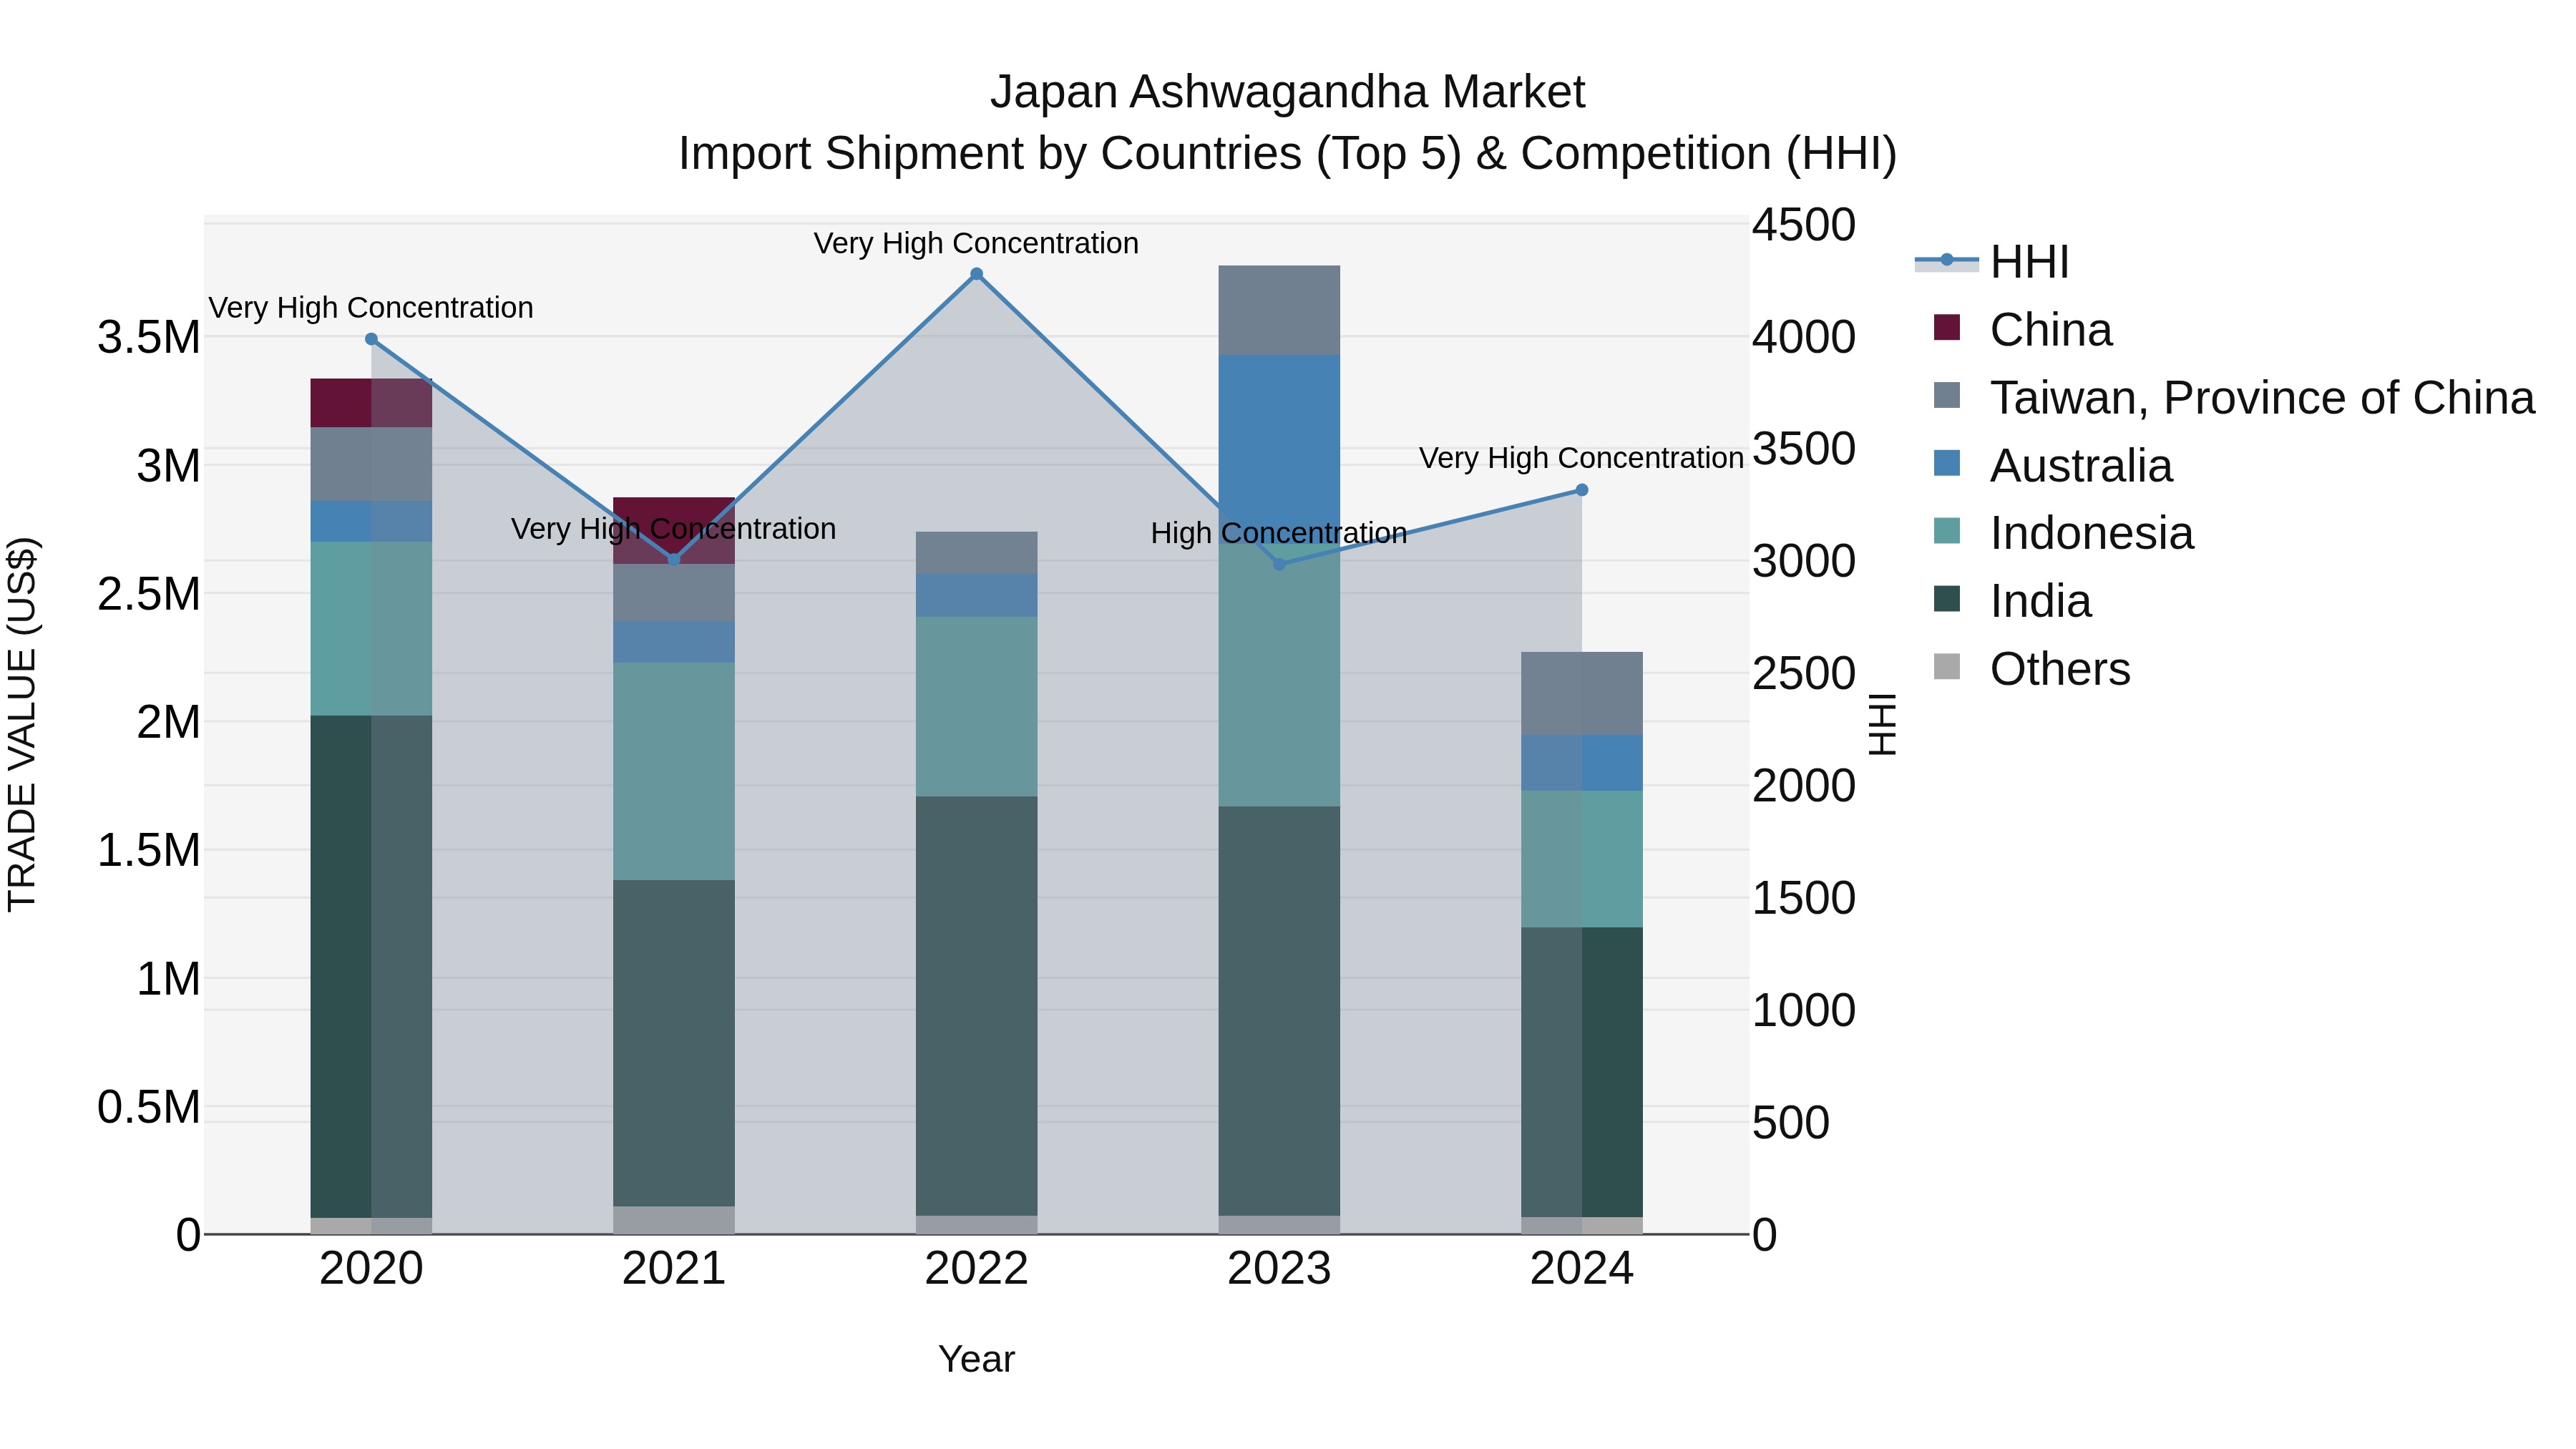
Japan Ashwagandha Market Import Shipment by Countries (Top 5) & Competition (HHI)
The Japan ashwagandha import market saw a significant increase in concentration levels in 2024, with top exporting countries being India, Indonesia, Taiwan, Australia, and Fiji. However, the market experienced a negative compound annual growth rate (CAGR) of -9.16% from 2020 to 2024, with a steep decline in growth rate of -39.84% from 2023 to 2024. This suggests a challenging environment for ashwagandha importers in Japan, potentially impacted by various factors such as changing consumer preferences or regulatory issues.
Key Highlights of the Report:
- Japan Ashwagandha Market Outlook
- Market Size of Japan Ashwagandha Market, 2024
- Forecast of Japan Ashwagandha Market, 2031
- Historical Data and Forecast of Japan Ashwagandha Revenues & Volume for the Period 2021- 2031
- Japan Ashwagandha Market Trend Evolution
- Japan Ashwagandha Market Drivers and Challenges
- Japan Ashwagandha Price Trends
- Japan Ashwagandha Porter's Five Forces
- Japan Ashwagandha Industry Life Cycle
- Historical Data and Forecast of Japan Ashwagandha Market Revenues & Volume By Type for the Period 2021- 2031
- Historical Data and Forecast of Japan Ashwagandha Market Revenues & Volume By KSM-66 for the Period 2021- 2031
- Historical Data and Forecast of Japan Ashwagandha Market Revenues & Volume By Sensoril for the Period 2021- 2031
- Historical Data and Forecast of Japan Ashwagandha Market Revenues & Volume By Hydro-Alcoholic Ashwagandha for the Period 2021- 2031
- Historical Data and Forecast of Japan Ashwagandha Market Revenues & Volume By Crude Ashwagandha for the Period 2021- 2031
- Historical Data and Forecast of Japan Ashwagandha Market Revenues & Volume By Product Type for the Period 2021- 2031
- Historical Data and Forecast of Japan Ashwagandha Market Revenues & Volume By Ashwagandha Root Products for the Period 2021- 2031
- Historical Data and Forecast of Japan Ashwagandha Market Revenues & Volume By Ashwagandha Leaf Products for the Period 2021- 2031
- Historical Data and Forecast of Japan Ashwagandha Market Revenues & Volume By Ashwagandha Leaf for the Period 2021- 2031
- Historical Data and Forecast of Japan Ashwagandha Market Revenues & Volume By Root Mix Products for the Period 2021- 2031
- Historical Data and Forecast of Japan Ashwagandha Market Revenues & Volume By Category for the Period 2021- 2031
- Historical Data and Forecast of Japan Ashwagandha Market Revenues & Volume By Regular for the Period 2021- 2031
- Historical Data and Forecast of Japan Ashwagandha Market Revenues & Volume By Full Spectrum for the Period 2021- 2031
- Historical Data and Forecast of Japan Ashwagandha Market Revenues & Volume By Function for the Period 2021- 2031
- Historical Data and Forecast of Japan Ashwagandha Market Revenues & Volume By Improved Stamina for the Period 2021- 2031
- Historical Data and Forecast of Japan Ashwagandha Market Revenues & Volume By Improved Immunity for the Period 2021- 2031
- Historical Data and Forecast of Japan Ashwagandha Market Revenues & Volume By Overall Wellbeing for the Period 2021- 2031
- Historical Data and Forecast of Japan Ashwagandha Market Revenues & Volume By Reduced Anxiety and Stress for the Period 2021- 2031
- Historical Data and Forecast of Japan Ashwagandha Market Revenues & Volume By Brain Health for the Period 2021- 2031
- Historical Data and Forecast of Japan Ashwagandha Market Revenues & Volume By Muscle Strength for the Period 2021- 2031
- Historical Data and Forecast of Japan Ashwagandha Market Revenues & Volume By Others for the Period 2021- 2031
- Historical Data and Forecast of Japan Ashwagandha Market Revenues & Volume By Application for the Period 2021- 2031
- Historical Data and Forecast of Japan Ashwagandha Market Revenues & Volume By Food & Beverages for the Period 2021- 2031
- Historical Data and Forecast of Japan Ashwagandha Market Revenues & Volume By Pharmaceutical for the Period 2021- 2031
- Historical Data and Forecast of Japan Ashwagandha Market Revenues & Volume By Dietary Supplements for the Period 2021- 2031
- Historical Data and Forecast of Japan Ashwagandha Market Revenues & Volume By Sports Nutrition for the Period 2021- 2031
- Historical Data and Forecast of Japan Ashwagandha Market Revenues & Volume By Others for the Period 2021- 2031
- Japan Ashwagandha Import Export Trade Statistics
- Market Opportunity Assessment By Type
- Market Opportunity Assessment By Product Type
- Market Opportunity Assessment By Category
- Market Opportunity Assessment By Function
- Market Opportunity Assessment By Application
- Japan Ashwagandha Top Companies Market Share
- Japan Ashwagandha Competitive Benchmarking By Technical and Operational Parameters
- Japan Ashwagandha Company Profiles
- Japan Ashwagandha Key Strategic Recommendations
Frequently Asked Questions About the Market Study (FAQs):
6Wresearch actively monitors the Japan Ashwagandha Market and publishes its comprehensive annual report, highlighting emerging trends, growth drivers, revenue analysis, and forecast outlook. Our insights help businesses to make data-backed strategic decisions with ongoing market dynamics. Our analysts track relevent industries related to the Japan Ashwagandha Market, allowing our clients with actionable intelligence and reliable forecasts tailored to emerging regional needs.
Yes, we provide customisation as per your requirements. To learn more, feel free to contact us on sales@6wresearch.com
1 Executive Summary |
2 Introduction |
2.1 Key Highlights of the Report |
2.2 Report Description |
2.3 Market Scope & Segmentation |
2.4 Research Methodology |
2.5 Assumptions |
3 Japan Ashwagandha Market Overview |
3.1 Japan Country Macro Economic Indicators |
3.2 Japan Ashwagandha Market Revenues & Volume, 2021 & 2031F |
3.3 Japan Ashwagandha Market - Industry Life Cycle |
3.4 Japan Ashwagandha Market - Porter's Five Forces |
3.5 Japan Ashwagandha Market Revenues & Volume Share, By Type, 2021 & 2031F |
3.6 Japan Ashwagandha Market Revenues & Volume Share, By Product Type, 2021 & 2031F |
3.7 Japan Ashwagandha Market Revenues & Volume Share, By Category, 2021 & 2031F |
3.8 Japan Ashwagandha Market Revenues & Volume Share, By Function, 2021 & 2031F |
3.9 Japan Ashwagandha Market Revenues & Volume Share, By Application, 2021 & 2031F |
4 Japan Ashwagandha Market Dynamics |
4.1 Impact Analysis |
4.2 Market Drivers |
4.2.1 Increasing consumer awareness about the health benefits of ashwagandha |
4.2.2 Growing demand for natural and herbal supplements in Japan |
4.2.3 Rising prevalence of stress and anxiety, leading to a higher adoption of ashwagandha products |
4.3 Market Restraints |
4.3.1 Stringent regulations and compliance requirements in the herbal supplement market |
4.3.2 Limited availability of high-quality ashwagandha sources |
4.3.3 Price volatility of raw ashwagandha material impacting product pricing |
5 Japan Ashwagandha Market Trends |
6 Japan Ashwagandha Market, By Types |
6.1 Japan Ashwagandha Market, By Type |
6.1.1 Overview and Analysis |
6.1.2 Japan Ashwagandha Market Revenues & Volume, By Type, 2021- 2031F |
6.1.3 Japan Ashwagandha Market Revenues & Volume, By KSM-66, 2021- 2031F |
6.1.4 Japan Ashwagandha Market Revenues & Volume, By Sensoril, 2021- 2031F |
6.1.5 Japan Ashwagandha Market Revenues & Volume, By Hydro-Alcoholic Ashwagandha, 2021- 2031F |
6.1.6 Japan Ashwagandha Market Revenues & Volume, By Crude Ashwagandha, 2021- 2031F |
6.2 Japan Ashwagandha Market, By Product Type |
6.2.1 Overview and Analysis |
6.2.2 Japan Ashwagandha Market Revenues & Volume, By Ashwagandha Root Products, 2021- 2031F |
6.2.3 Japan Ashwagandha Market Revenues & Volume, By Ashwagandha Leaf Products, 2021- 2031F |
6.2.4 Japan Ashwagandha Market Revenues & Volume, By Ashwagandha Leaf, 2021- 2031F |
6.2.5 Japan Ashwagandha Market Revenues & Volume, By Root Mix Products, 2021- 2031F |
6.3 Japan Ashwagandha Market, By Category |
6.3.1 Overview and Analysis |
6.3.2 Japan Ashwagandha Market Revenues & Volume, By Regular, 2021- 2031F |
6.3.3 Japan Ashwagandha Market Revenues & Volume, By Full Spectrum, 2021- 2031F |
6.4 Japan Ashwagandha Market, By Function |
6.4.1 Overview and Analysis |
6.4.2 Japan Ashwagandha Market Revenues & Volume, By Improved Stamina, 2021- 2031F |
6.4.3 Japan Ashwagandha Market Revenues & Volume, By Improved Immunity, 2021- 2031F |
6.4.4 Japan Ashwagandha Market Revenues & Volume, By Overall Wellbeing, 2021- 2031F |
6.4.5 Japan Ashwagandha Market Revenues & Volume, By Reduced Anxiety and Stress, 2021- 2031F |
6.4.6 Japan Ashwagandha Market Revenues & Volume, By Brain Health, 2021- 2031F |
6.4.7 Japan Ashwagandha Market Revenues & Volume, By Muscle Strength, 2021- 2031F |
6.5 Japan Ashwagandha Market, By Application |
6.5.1 Overview and Analysis |
6.5.2 Japan Ashwagandha Market Revenues & Volume, By Food & Beverages, 2021- 2031F |
6.5.3 Japan Ashwagandha Market Revenues & Volume, By Pharmaceutical, 2021- 2031F |
6.5.4 Japan Ashwagandha Market Revenues & Volume, By Dietary Supplements, 2021- 2031F |
6.5.5 Japan Ashwagandha Market Revenues & Volume, By Sports Nutrition, 2021- 2031F |
6.5.6 Japan Ashwagandha Market Revenues & Volume, By Others, 2021- 2031F |
7 Japan Ashwagandha Market Import-Export Trade Statistics |
7.1 Japan Ashwagandha Market Export to Major Countries |
7.2 Japan Ashwagandha Market Imports from Major Countries |
8 Japan Ashwagandha Market Key Performance Indicators |
8.1 Consumer engagement with ashwagandha-related content on social media platforms |
8.2 Number of clinical research studies supporting the efficacy of ashwagandha in stress management |
8.3 Growth in the number of retail outlets stocking ashwagandha products |
8.4 Adoption rate of ashwagandha in traditional Japanese medicine practices |
8.5 Number of new product launches featuring ashwagandha as a key ingredient |
9 Japan Ashwagandha Market - Opportunity Assessment |
9.1 Japan Ashwagandha Market Opportunity Assessment, By Type, 2021 & 2031F |
9.2 Japan Ashwagandha Market Opportunity Assessment, By Product Type, 2021 & 2031F |
9.3 Japan Ashwagandha Market Opportunity Assessment, By Category, 2021 & 2031F |
9.4 Japan Ashwagandha Market Opportunity Assessment, By Function, 2021 & 2031F |
9.5 Japan Ashwagandha Market Opportunity Assessment, By Application, 2021 & 2031F |
10 Japan Ashwagandha Market - Competitive Landscape |
10.1 Japan Ashwagandha Market Revenue Share, By Companies, 2024 |
10.2 Japan Ashwagandha Market Competitive Benchmarking, By Operating and Technical Parameters |
11 Company Profiles |
12 Recommendations |
13 Disclaimer |
Global Go To Market Strategy - 2030
Export potential enables firms to identify high-growth global markets with greater confidence by combining advanced trade intelligence with a structured quantitative methodology. The framework analyzes emerging demand trends and country-level import patterns while integrating macroeconomic and trade datasets such as GDP and population forecasts, bilateral import–export flows, tariff structures, elasticity differentials between developed and developing economies, geographic distance, and import demand projections. Using weighted trade values from 2020–2024 as the base period to project country-to-country export potential for 2030, these inputs are operationalized through calculated drivers such as gravity model parameters, tariff impact factors, and projected GDP per-capita growth. Through an analysis of hidden potentials, demand hotspots, and market conditions that are most favorable to success, this method enables firms to focus on target countries, maximize returns, and global expansion with data, backed by accuracy.
By factoring in the projected importer demand gap that is currently unmet and could be potential opportunity, it identifies the potential for the Exporter (Country) among 190 countries, against the general trade analysis, which identifies the biggest importer or exporter.
To discover high-growth global markets and optimize your business strategy:
Click Here
Pricing
- Single User License$ 1,995
- Department License$ 2,400
- Site License$ 3,120
- Global License$ 3,795

Leadership Perspectives from Industry Events
Search
Thought Leadership and Analyst Meet


Our Clients
6WResearch In News
- Doha a strategic location for EV manufacturing hub: IPA Qatar
- Demand for luxury TVs surging in the GCC, says Samsung
- Empowering Growth: The Thriving Journey of Bangladesh’s Cable Industry
- Demand for luxury TVs surging in the GCC, says Samsung
- Video call with a traditional healer? Once unthinkable, it’s now common in South Africa
- Intelligent Buildings To Smooth GCC’s Path To Net Zero
Latest Reports
- Taiwan Airport Wireless Infrastructure Market (2026-2032)
- Vietnam Airport Wireless Infrastructure Market (2026-2032)
- Thailand Airport Wireless Infrastructure Market (2026-2032)
- South Korea Airport Wireless Infrastructure Market (2026-2032)
- Romania Airport Wireless Infrastructure Market (2026-2032)
- Qatar Airport Wireless Infrastructure Market (2026-2032)
- Philippines Airport Wireless Infrastructure Market (2026-2032)
- Japan Airport Wireless Infrastructure Market (2026-2032)
- Taiwan Airport Winter Services Market (2026-2032)
- Vietnam Airport Winter Services Market (2026-2032)
Industry Events and Analyst Meet

HIMTEX 2026

India Refining Summit 2026

India EV Show 2026

EV tech India Expo 2026

Auto Tech Asia 2026
Whitepaper
- Middle East & Africa Commercial Security Market Click here to view more.
- Middle East & Africa Fire Safety Systems & Equipment Market Click here to view more.
- GCC Drone Market Click here to view more.
- Middle East Lighting Fixture Market Click here to view more.
- GCC Physical & Perimeter Security Market Click here to view more.