Japan Digital Photo Frame Market (2026-2032) | Share, Outlook, Value, Revenue, Growth, Trends, Forecast, Size, Analysis, Industry & Companies
Market Forecast By Product Type (Pan Touch Control Frame, Remote Control Frame), By Size (Standard Frame (4:3), Widescreen Frame (16:9)), By Inch (Up to 7, Between 7 to 15, Above 15), By Power Source (Electricity Power Source, Battery Power Source), By Application (Residential, Commercial) And Competitive Landscape
| Product Code: ETC012342 | Publication Date: Oct 2020 | Updated Date: Jun 2026 | Product Type: Report | |
| Publisher: 6Wresearch | Author: Summon Dutta | No. of Pages: 70 | No. of Figures: 35 | No. of Tables: 5 |
Japan Digital Photo Frame Market Summary
The japan digital photo frame market was estimated at USD 154 Million in 2025 and is projected to reach USD 166 Million by 2032, growing at a CAGR of 2.1% from 2026 to 2032.
Japan Digital Photo Frame Market Growth Rate Analysis (2021-2032)
The Japan Digital Photo Frame market has experienced varied growth rates over the past few years, influenced by shifting consumer preferences and technological advancements. After a decline of 2.2% in 2021, the market rebounded with a 4.4% increase in 2022, driven by enhanced features and rising demand for digital displays in homes. Growth stabilized at 2.4% in 2023, as consumers continued to embrace nostalgia-driven products, but is forecasted to gradually slow to 1.1% by 2030. Factors such as ongoing digitalization efforts and the integration of smart home technology are expected to support modest growth through 2032. However, competition from smartphones and alternative display devices remains a pressing challenge for sustained market expansion.
Japan Digital Photo Frame Market Year-wise Growth Rate and Key Drivers
This graph highlights how the Japan Digital Photo Frame Market has steadily grown over the past five years, supported by major growth factors.
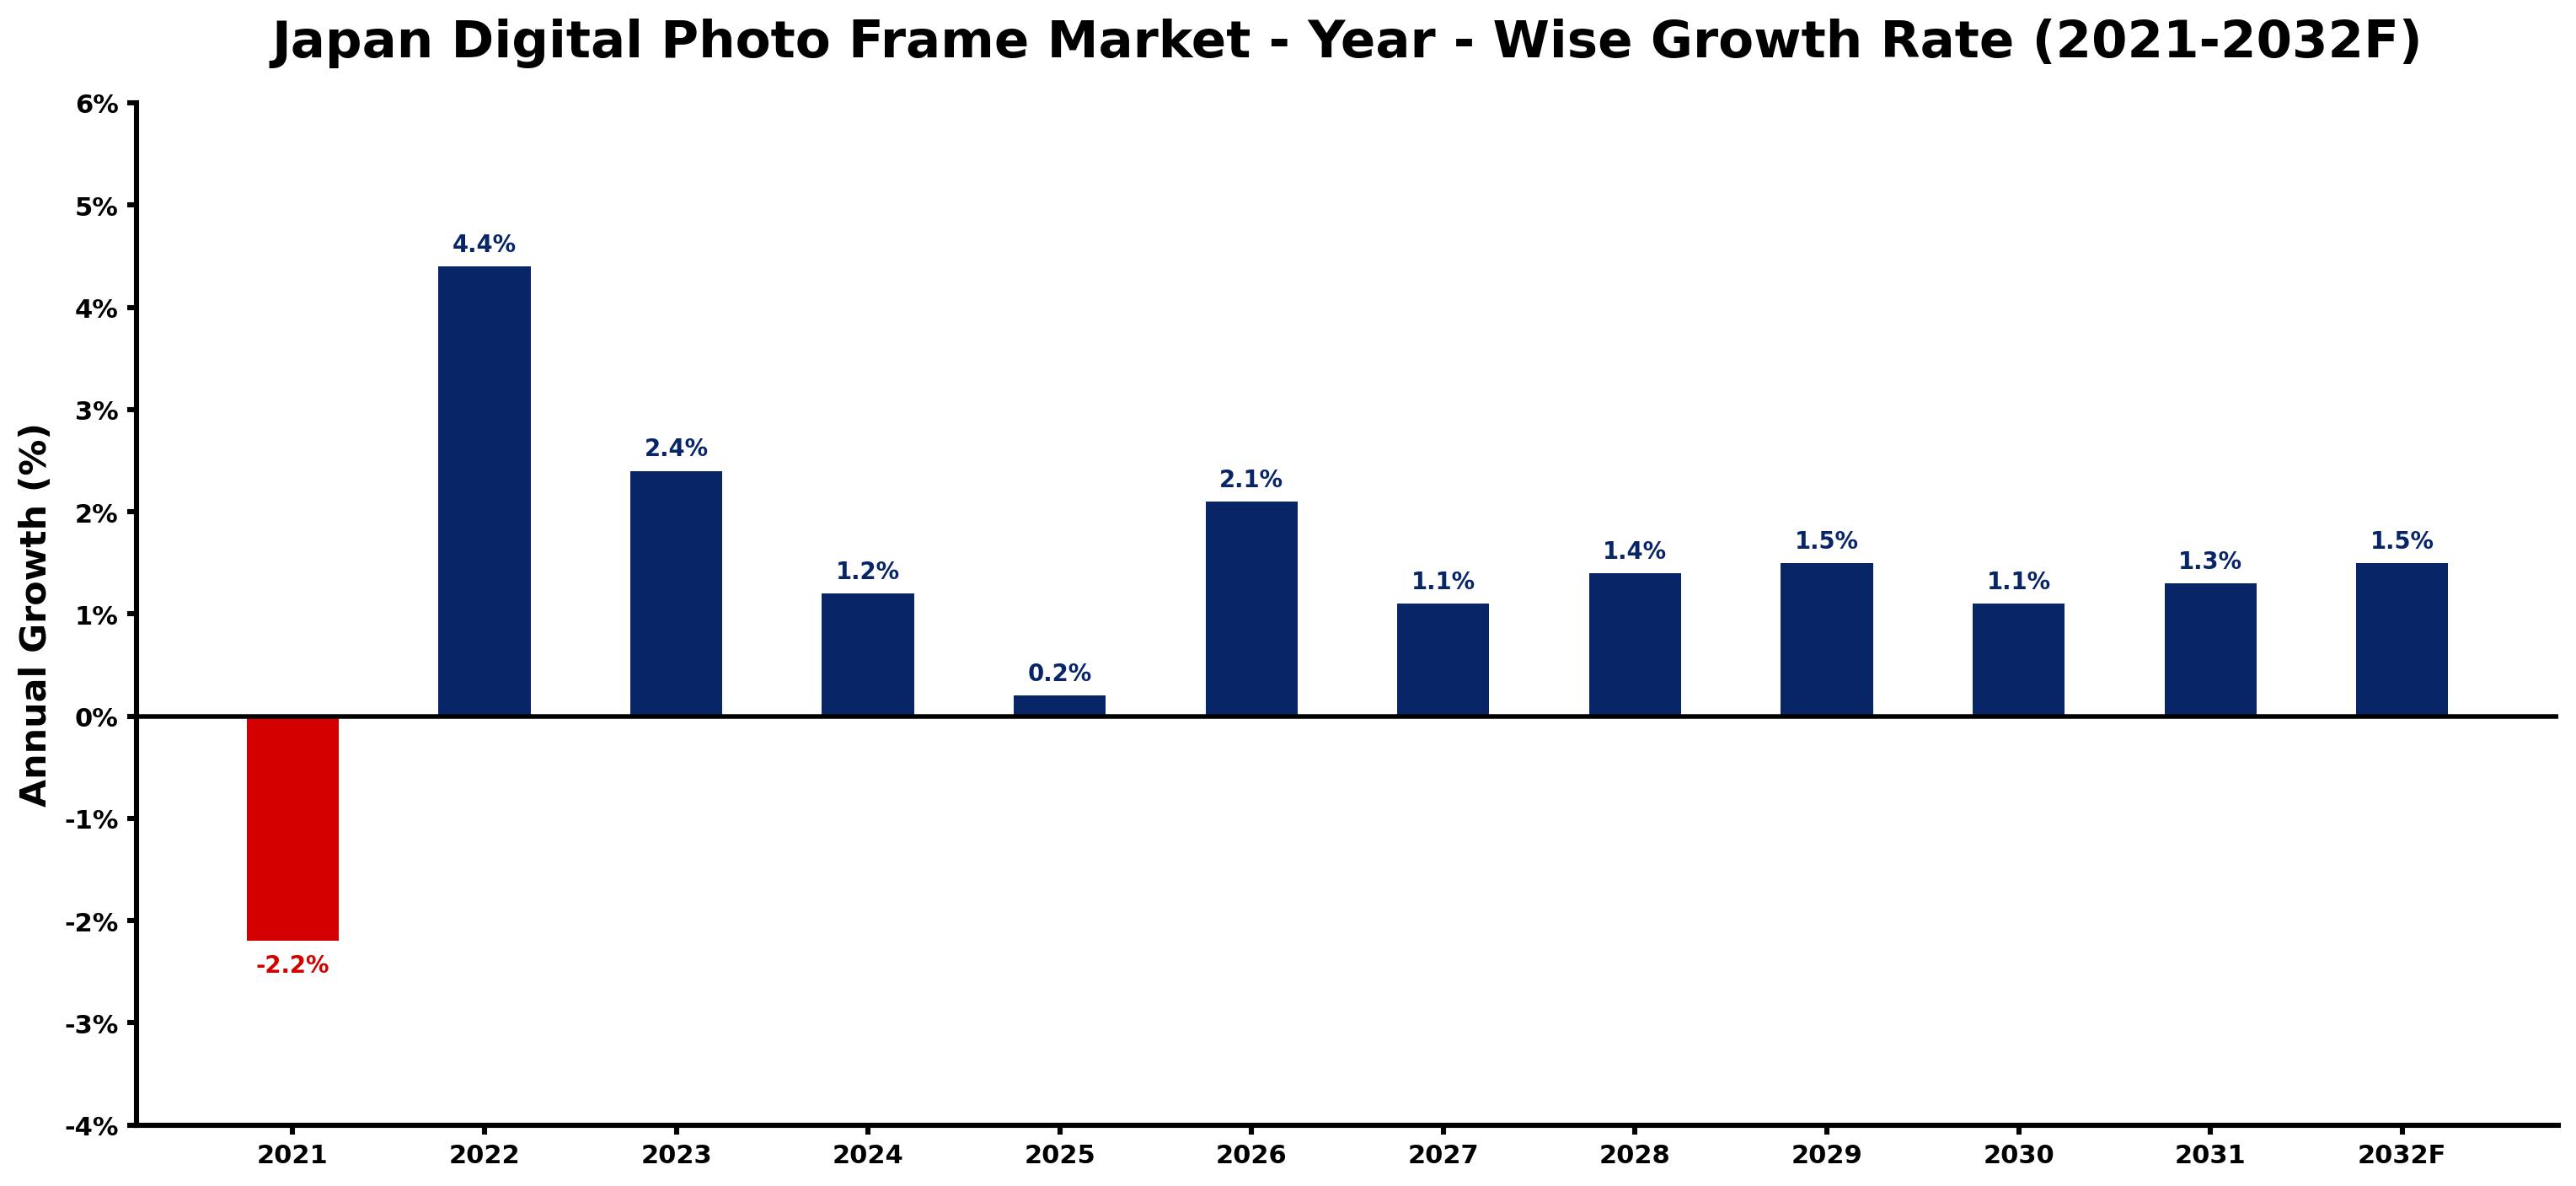
The table below presents the year wise growth rates along with the key drivers influencing the market
| Year | Growth Rate | Major Drivers |
| 2021 | -2.2% | Supply chain disruptions hindered availability of components, leading to diminished product launches and consumer interest. |
| 2022 | 4.4% | Evolving consumer preferences highlighted the need for personalized digital photo experiences. |
| 2023 | 2.4% | Technological improvements enhanced connectivity options for digital photo frame users. |
| 2024 | 1.2% | Increased smartphone penetration created new opportunities for seamless photo sharing. |
| 2025 | 0.2% | Local manufacturers began prioritizing eco-friendly materials in product development. |
| 2026 | 2.1% | Enhanced app ecosystems empowered users to customize and manage photo frames easily. |
| 2027 | 1.1% | Aging population in Japan sought user-friendly technology for keeping family memories alive. |
| 2028 | 1.4% | Collaborations between tech firms and artists introduced unique digital content offerings. |
| 2029 | 1.5% | Corporate gifting trends began integrating personalized digital frames for brand engagement. |
| 2030 | 1.1% | Smart home integration features became a key selling point for digital photo frames. |
| 2031 | 1.3% | Emerging trends in remote work increased demand for digital photo frames in home offices. |
| 2032 | 1.5% | User data analytics created personalized marketing strategies, enhancing customer retention rates. |
Note - Market size estimations and growth projections presented in this report are based on 6Wresearch's advanced forecasting approach, validated with industry datasets as of June 2026.
Japan Digital Photo Frame Market Synopsis
The Japan Digital Photo Frame Market is projected to reach 2.1% and witness significant growth during the forecast period (2026-2032). This market is driven by an increasing consumer interest in digital photography and a growing demand for personalized home decor that incorporates advanced technology. Technological advancements in display quality and connectivity features further enhance the appeal of digital photo frames, making them an attractive option for consumers looking to showcase their cherished memories in innovative ways.
Japan Digital Photo Frame Market Growth Drivers
Several factors contribute to the sustained growth of the Japan Digital Photo Frame Market. Continuous innovation in technology, especially with the rise of smart features, significantly shapes consumer preferences. Emerging trends include:
- The integration of Wi-Fi connectivity allows users to easily upload images directly from their devices, enhancing convenience and functionality.
- Cloud storage compatibility enables users to access their photo collections from virtually anywhere, promoting a seamless user experience.
- High-resolution displays cater to consumers' expectations for quality, providing vibrant and detailed images that elevate the aesthetic appeal.
- Personalized settings, such as customizable slideshow options and interactive touchscreen interfaces, are gaining popularity, particularly among tech-savvy consumers.
- An increasing focus on eco-friendly products drives demand for energy-efficient digital photo frames, appealing to environmentally conscious buyers.
Japan Digital Photo Frame Market Trends and Opportunities
A notable trend in the Japan Digital Photo Frame Market is the shift towards smart digital photo frames. These devices are increasingly favored for their enhanced functionalities, reflecting a consumer preference for technology that integrates easily with their lifestyle. Key opportunities include:
- The growing use of social media platforms for sharing photos creates a demand for frames that can effortlessly stream images from these networks.
- Customization and personalization are becoming central to consumer decision-making, with many consumers seeking frames that reflect their individual tastes and styles.
- The demand for frames that support video playback is on the rise, allowing users to display dynamic content alongside still images.
- There is an increasing interest in integrated smart home capabilities, where digital photo frames can interact with other smart devices, making them a central part of home automation.
- Investors are encouraged to focus on sustainable materials and designs, as environmentally friendly options are gaining traction among consumers.
Japan Digital Photo Frame Market Challenges and Restraints
Despite the positive growth outlook, the Japan Digital Photo Frame Market faces significant challenges. The competitive landscape is tough due to the prevalence of smartphones and tablets, which offer similar photo display capabilities. The following aspects present hurdles:
- Multi-functional devices like smartphones are commonly preferred over standalone digital photo frames, making it difficult for these products to establish a unique value proposition.
- The higher price point of digital photo frames in comparison to smartphones challenges market players to attract price-sensitive consumers.
- Rapid advancements in technology require manufacturers to continuously innovate, as consumers increasingly seek the latest features and improvements, such as enhanced connectivity and user interfaces.
- Maintaining product quality standards is crucial for consumer trust and brand loyalty, necessitating constant investments in research and development.
- Market players must differentiate their offerings through unique functions and superior user experiences to remain competitive against incumbent technologies.
Japan Digital Photo Frame Market Government Investment and Initiatives
The Japan Digital Photo Frame Market is significantly influenced by government policies and initiatives aimed at fostering innovation within the technology sector. Key aspects include:
- The Japanese government actively promotes the adoption of digital technologies, including digital photo frames, through funding programs and innovation grants that support development.
- Initiatives like the "Digital New Deal" aim to enhance technological infrastructure and encourage investments in digital products.
- Consumer protection regulations ensure product safety and quality, which is vital for maintaining consumer trust in digital technologies.
- Policies promoting eco-friendly innovations provide incentives for manufacturers to develop energy-efficient and sustainable products.
- The government also encourages collaborations between private enterprises and educational institutions to drive skills development in digital technology.
Japan Digital Photo Frame Market Latest Developments (May 2025 - June 2026)
Recent developments in the Japan Digital Photo Frame Market indicate a clear shift towards more advanced technologies and consumer-driven features. Over the period from May 2025 to June 2026, companies have been focusing on enhancing the user experience by integrating artificial intelligence and machine learning into digital photo frames. This advancement allows for more personalized and dynamic content display, catering to individual consumer preferences. Additionally, producers have been placing increased emphasis on the sustainability aspects of digital photo frames, incorporating eco-friendly materials and energy-efficient technologies into their designs. As social media use continues to rise, frames that offer seamless connectivity to these platforms have seen heightened interest, further indicating a market trend favoring interactive and connected devices.
Japan Digital Photo Frame Market - Key Attractiveness of the Report
- 10 Years of Market Numbers
- Historical Data Starting from 2022 to 2025
- Base Year: 2025
- Forecast Data until 2032
- Key Performance Indicators Impacting the Market
- Major Upcoming Developments and Projects
Key Highlights of the Report:
- Japan Digital Photo Frame Market Outlook
- Market Size of Japan Digital Photo Frame Market, 2025
- Forecast of Japan Digital Photo Frame Market, 2032
- Historical Data and Forecast of Japan Digital Photo Frame Revenues & Volume for the Period 2022-2032F
- Japan Digital Photo Frame Market Trend Evolution
- Japan Digital Photo Frame Market Drivers and Challenges
- Japan Digital Photo Frame Price Trends
- Japan Digital Photo Frame Porter's Five Forces
- Japan Digital Photo Frame Industry Life Cycle
- Historical Data and Forecast of Japan Digital Photo Frame Market Revenues & Volume By Product Type for the Period 2022-2032F
- Historical Data and Forecast of Japan Digital Photo Frame Market Revenues & Volume By Pan Touch Control Frame for the Period 2022-2032F
- Historical Data and Forecast of Japan Digital Photo Frame Market Revenues & Volume By Remote Control Frame for the Period 2022-2032F
- Historical Data and Forecast of Japan Digital Photo Frame Market Revenues & Volume By Size for the Period 2022-2032F
- Historical Data and Forecast of Japan Digital Photo Frame Market Revenues & Volume By Standard Frame (4:3) for the Period 2022-2032F
- Historical Data and Forecast of Japan Digital Photo Frame Market Revenues & Volume By Widescreen Frame (16:9) for the Period 2022-2032F
- Historical Data and Forecast of Japan Digital Photo Frame Market Revenues & Volume By Inch for the Period 2022-2032F
- Historical Data and Forecast of Japan Digital Photo Frame Market Revenues & Volume By Up to 7 for the Period 2022-2032F
- Historical Data and Forecast of Japan Digital Photo Frame Market Revenues & Volume By Between 7 to 15 for the Period 2022-2032F
- Historical Data and Forecast of Japan Digital Photo Frame Market Revenues & Volume By Above 15 for the Period 2022-2032F
- Historical Data and Forecast of Japan Digital Photo Frame Market Revenues & Volume By Power Source for the Period 2022-2032F
- Historical Data and Forecast of Japan Digital Photo Frame Market Revenues & Volume By Electricity Power Source for the Period 2022-2032F
- Historical Data and Forecast of Japan Digital Photo Frame Market Revenues & Volume By Battery Power Source for the Period 2022-2032F
- Historical Data and Forecast of Japan Digital Photo Frame Market Revenues & Volume By Application for the Period 2022-2032F
- Historical Data and Forecast of Japan Digital Photo Frame Market Revenues & Volume By Residential for the Period 2022-2032F
- Historical Data and Forecast of Japan Digital Photo Frame Market Revenues & Volume By Commercial for the Period 2022-2032F
- Historical Data and Forecast of Japan Digital Photo Frame Market Revenues & Volume By Distribution Channel for the Period 2022-2032F
- Historical Data and Forecast of Japan Digital Photo Frame Market Revenues & Volume By Online for the Period 2022-2032F
- Historical Data and Forecast of Japan Digital Photo Frame Market Revenues & Volume By Offline for the Period 2022-2032F
- Japan Digital Photo Frame Import Export Trade Statistics
- Market Opportunity Assessment By Product Type
- Market Opportunity Assessment By Size
- Market Opportunity Assessment By Inch
- Market Opportunity Assessment By Power Source
- Market Opportunity Assessment By Application
- Market Opportunity Assessment By Distribution Channel
- Japan Digital Photo Frame Top Companies Market Share
- Japan Digital Photo Frame Competitive Benchmarking By Technical and Operational Parameters
- Japan Digital Photo Frame Company Profiles
- Japan Digital Photo Frame Key Strategic Recommendations
Frequently Asked Questions About the Market Study (FAQs):
The growth is primarily driven by technological advancements, increasing consumer interest in digital photography, and rising demand for personalized home decor products.
The competition is intensifying due to the prevalence of multifunctional devices like smartphones, necessitating innovation and differentiation among digital photo frame manufacturers.
Government policies focus on promoting technological innovation and consumer protection, fostering a competitive environment in the digital photo frame sector.
Investors can capitalize on the trend towards personalized and technologically advanced products, particularly those integrating eco-friendly features and smart functionalities.
6Wresearch actively monitors the Japan Digital Photo Frame Market and publishes its comprehensive annual report, highlighting emerging trends, growth drivers, revenue analysis, and forecast outlook. Our insights help businesses to make data-backed strategic decisions with ongoing market dynamics. Our analysts track relevent industries related to the Japan Digital Photo Frame Market, allowing our clients with actionable intelligence and reliable forecasts tailored to emerging regional needs.
Yes, we provide customisation as per your requirements. To learn more, feel free to contact us on sales@6wresearch.com
1 Executive Summary |
2 Introduction |
2.1 Key Highlights of the Report |
2.2 Report Description |
2.3 Market Scope & Segmentation |
2.4 Research Methodology |
2.5 Assumptions |
3 Japan Digital Photo Frame Market Overview |
3.1 Japan Country Macro Economic Indicators |
3.2 Japan Digital Photo Frame Market Revenues & Volume, 2022 & 2032F |
3.3 Japan Digital Photo Frame Market - Industry Life Cycle |
3.4 Japan Digital Photo Frame Market - Porter's Five Forces |
3.5 Japan Digital Photo Frame Market Revenues & Volume Share, By Product Type, 2022 & 2032F |
3.6 Japan Digital Photo Frame Market Revenues & Volume Share, By Size, 2022 & 2032F |
3.7 Japan Digital Photo Frame Market Revenues & Volume Share, By Inch, 2022 & 2032F |
3.8 Japan Digital Photo Frame Market Revenues & Volume Share, By Power Source, 2022 & 2032F |
3.9 Japan Digital Photo Frame Market Revenues & Volume Share, By Application, 2022 & 2032F |
3.10 Japan Digital Photo Frame Market Revenues & Volume Share, By Distribution Channel, 2022 & 2032F |
4 Japan Digital Photo Frame Market Dynamics |
4.1 Impact Analysis |
4.2 Market Drivers |
4.2.1 Increasing trend of digitalization and technology adoption in Japan |
4.2.2 Growing demand for personalized and innovative gifting options |
4.2.3 Rising popularity of digital photo frames for home decor purposes |
4.3 Market Restraints |
4.3.1 High competition from smartphones and tablets with advanced photo viewing capabilities |
4.3.2 Limited awareness and adoption among older demographics in Japan |
5 Japan Digital Photo Frame Market Trends |
6 Japan Digital Photo Frame Market, By Types |
6.1 Japan Digital Photo Frame Market, By Product Type |
6.1.1 Overview and Analysis |
6.1.2 Japan Digital Photo Frame Market Revenues & Volume, By Product Type, 2022-2032F |
6.1.3 Japan Digital Photo Frame Market Revenues & Volume, By Pan Touch Control Frame, 2022-2032F |
6.1.4 Japan Digital Photo Frame Market Revenues & Volume, By Remote Control Frame, 2022-2032F |
6.2 Japan Digital Photo Frame Market, By Size |
6.2.1 Overview and Analysis |
6.2.2 Japan Digital Photo Frame Market Revenues & Volume, By Standard Frame (4:3), 2022-2032F |
6.2.3 Japan Digital Photo Frame Market Revenues & Volume, By Widescreen Frame (16:9), 2022-2032F |
6.3 Japan Digital Photo Frame Market, By Inch |
6.3.1 Overview and Analysis |
6.3.2 Japan Digital Photo Frame Market Revenues & Volume, By Up to 7, 2022-2032F |
6.3.3 Japan Digital Photo Frame Market Revenues & Volume, By Between 7 to 15, 2022-2032F |
6.3.4 Japan Digital Photo Frame Market Revenues & Volume, By Above 15, 2022-2032F |
6.4 Japan Digital Photo Frame Market, By Power Source |
6.4.1 Overview and Analysis |
6.4.2 Japan Digital Photo Frame Market Revenues & Volume, By Electricity Power Source, 2022-2032F |
6.4.3 Japan Digital Photo Frame Market Revenues & Volume, By Battery Power Source, 2022-2032F |
6.5 Japan Digital Photo Frame Market, By Application |
6.5.1 Overview and Analysis |
6.5.2 Japan Digital Photo Frame Market Revenues & Volume, By Residential, 2022-2032F |
6.5.3 Japan Digital Photo Frame Market Revenues & Volume, By Commercial, 2022-2032F |
6.6 Japan Digital Photo Frame Market, By Distribution Channel |
6.6.1 Overview and Analysis |
6.6.2 Japan Digital Photo Frame Market Revenues & Volume, By Online, 2022-2032F |
6.6.3 Japan Digital Photo Frame Market Revenues & Volume, By Offline, 2022-2032F |
7 Japan Digital Photo Frame Market Import-Export Trade Statistics |
7.1 Japan Digital Photo Frame Market Export to Major Countries |
7.2 Japan Digital Photo Frame Market Imports from Major Countries |
8 Japan Digital Photo Frame Market Key Performance Indicators |
8.1 Average time spent by consumers using digital photo frames |
8.2 Number of new product launches and innovative features introduced in the market |
8.3 Percentage of households owning at least one digital photo frame |
9 Japan Digital Photo Frame Market - Opportunity Assessment |
9.1 Japan Digital Photo Frame Market Opportunity Assessment, By Product Type, 2022 & 2032F |
9.2 Japan Digital Photo Frame Market Opportunity Assessment, By Size, 2022 & 2032F |
9.3 Japan Digital Photo Frame Market Opportunity Assessment, By Inch, 2022 & 2032F |
9.4 Japan Digital Photo Frame Market Opportunity Assessment, By Power Source, 2022 & 2032F |
9.5 Japan Digital Photo Frame Market Opportunity Assessment, By Application, 2022 & 2032F |
9.6 Japan Digital Photo Frame Market Opportunity Assessment, By Distribution Channel, 2022 & 2032F |
10 Japan Digital Photo Frame Market - Competitive Landscape |
10.1 Japan Digital Photo Frame Market Revenue Share, By Companies, 2025 |
10.2 Japan Digital Photo Frame Market Competitive Benchmarking, By Operating and Technical Parameters |
11 Company Profiles |
12 Recommendations |
13 Disclaimer |
Global Go To Market Strategy - 2030
Export potential enables firms to identify high-growth global markets with greater confidence by combining advanced trade intelligence with a structured quantitative methodology. The framework analyzes emerging demand trends and country-level import patterns while integrating macroeconomic and trade datasets such as GDP and population forecasts, bilateral import–export flows, tariff structures, elasticity differentials between developed and developing economies, geographic distance, and import demand projections. Using weighted trade values from 2020–2024 as the base period to project country-to-country export potential for 2030, these inputs are operationalized through calculated drivers such as gravity model parameters, tariff impact factors, and projected GDP per-capita growth. Through an analysis of hidden potentials, demand hotspots, and market conditions that are most favorable to success, this method enables firms to focus on target countries, maximize returns, and global expansion with data, backed by accuracy.
By factoring in the projected importer demand gap that is currently unmet and could be potential opportunity, it identifies the potential for the Exporter (Country) among 190 countries, against the general trade analysis, which identifies the biggest importer or exporter.
To discover high-growth global markets and optimize your business strategy:
Click Here
Pricing
- Single User License$ 1,995
- Department License$ 2,400
- Site License$ 3,120
- Global License$ 3,795

Leadership Perspectives from Industry Events
Search
Thought Leadership and Analyst Meet


Our Clients
6WResearch In News
- India Air Conditioner Market Set for Strong Rebound in 2026 After Weather-Led Correction and GST-Driven Recovery: 6Wresearch
- ADAS in India: How Automatic Emergency Braking, Blind Spot Detection & Driver Monitoring are Transforming Road Safety
- Doha a strategic location for EV manufacturing hub: IPA Qatar
- Demand for luxury TVs surging in the GCC, says Samsung
- Empowering Growth: The Thriving Journey of Bangladesh’s Cable Industry
- Demand for luxury TVs surging in the GCC, says Samsung
Latest Reports
- Nicaragua RPG Gaming Market (2026-2032)
- New Zealand RPG Gaming Market (2026-2032)
- Netherlands RPG Gaming Market (2026-2032)
- Nauru RPG Gaming Market (2026-2032)
- Namibia RPG Gaming Market (2026-2032)
- Mozambique RPG Gaming Market (2026-2032)
- Montenegro RPG Gaming Market (2026-2032)
- Mongolia RPG Gaming Market (2026-2032)
- Monaco RPG Gaming Market (2026-2032)
- Micronesia RPG Gaming Market (2026-2032)
Industry Events and Analyst Meet

HIMTEX 2026

India Refining Summit 2026

India EV Show 2026

EV tech India Expo 2026

Auto Tech Asia 2026
Whitepaper
- Middle East & Africa Commercial Security Market Click here to view more.
- Middle East & Africa Fire Safety Systems & Equipment Market Click here to view more.
- GCC Drone Market Click here to view more.
- Middle East Lighting Fixture Market Click here to view more.
- GCC Physical & Perimeter Security Market Click here to view more.