Japan Electric 3-Wheeler Market (2026-2032) | Analysis, Size, Value, Trends, Share, Revenue, Companies, Forecast, Growth & Industry
Market Forecast By End-Use (Passenger Carrier, Load Carrier), By Motor Power (Below 1,000 W, 1,000-1,500 W, Above 1,500 W), By Battery Capacity (Below 3 kWh, 3-6 kWh, Above 6 kWh), By Range (Up to 50 Miles, Above 50 Miles), By Battery Type (Lead-acid Battery, Lithium-ion Battery, Other), By Payload Capacity (Up to 300 kg, 300-500 kg, Above 500 kg) And Competitive Landscape
| Product Code: ETC4573943 | Publication Date: Jul 2023 | Updated Date: May 2026 | Product Type: Report | |
| Publisher: 6Wresearch | Author: Ravi Bhandari | No. of Pages: 85 | No. of Figures: 45 | No. of Tables: 25 |
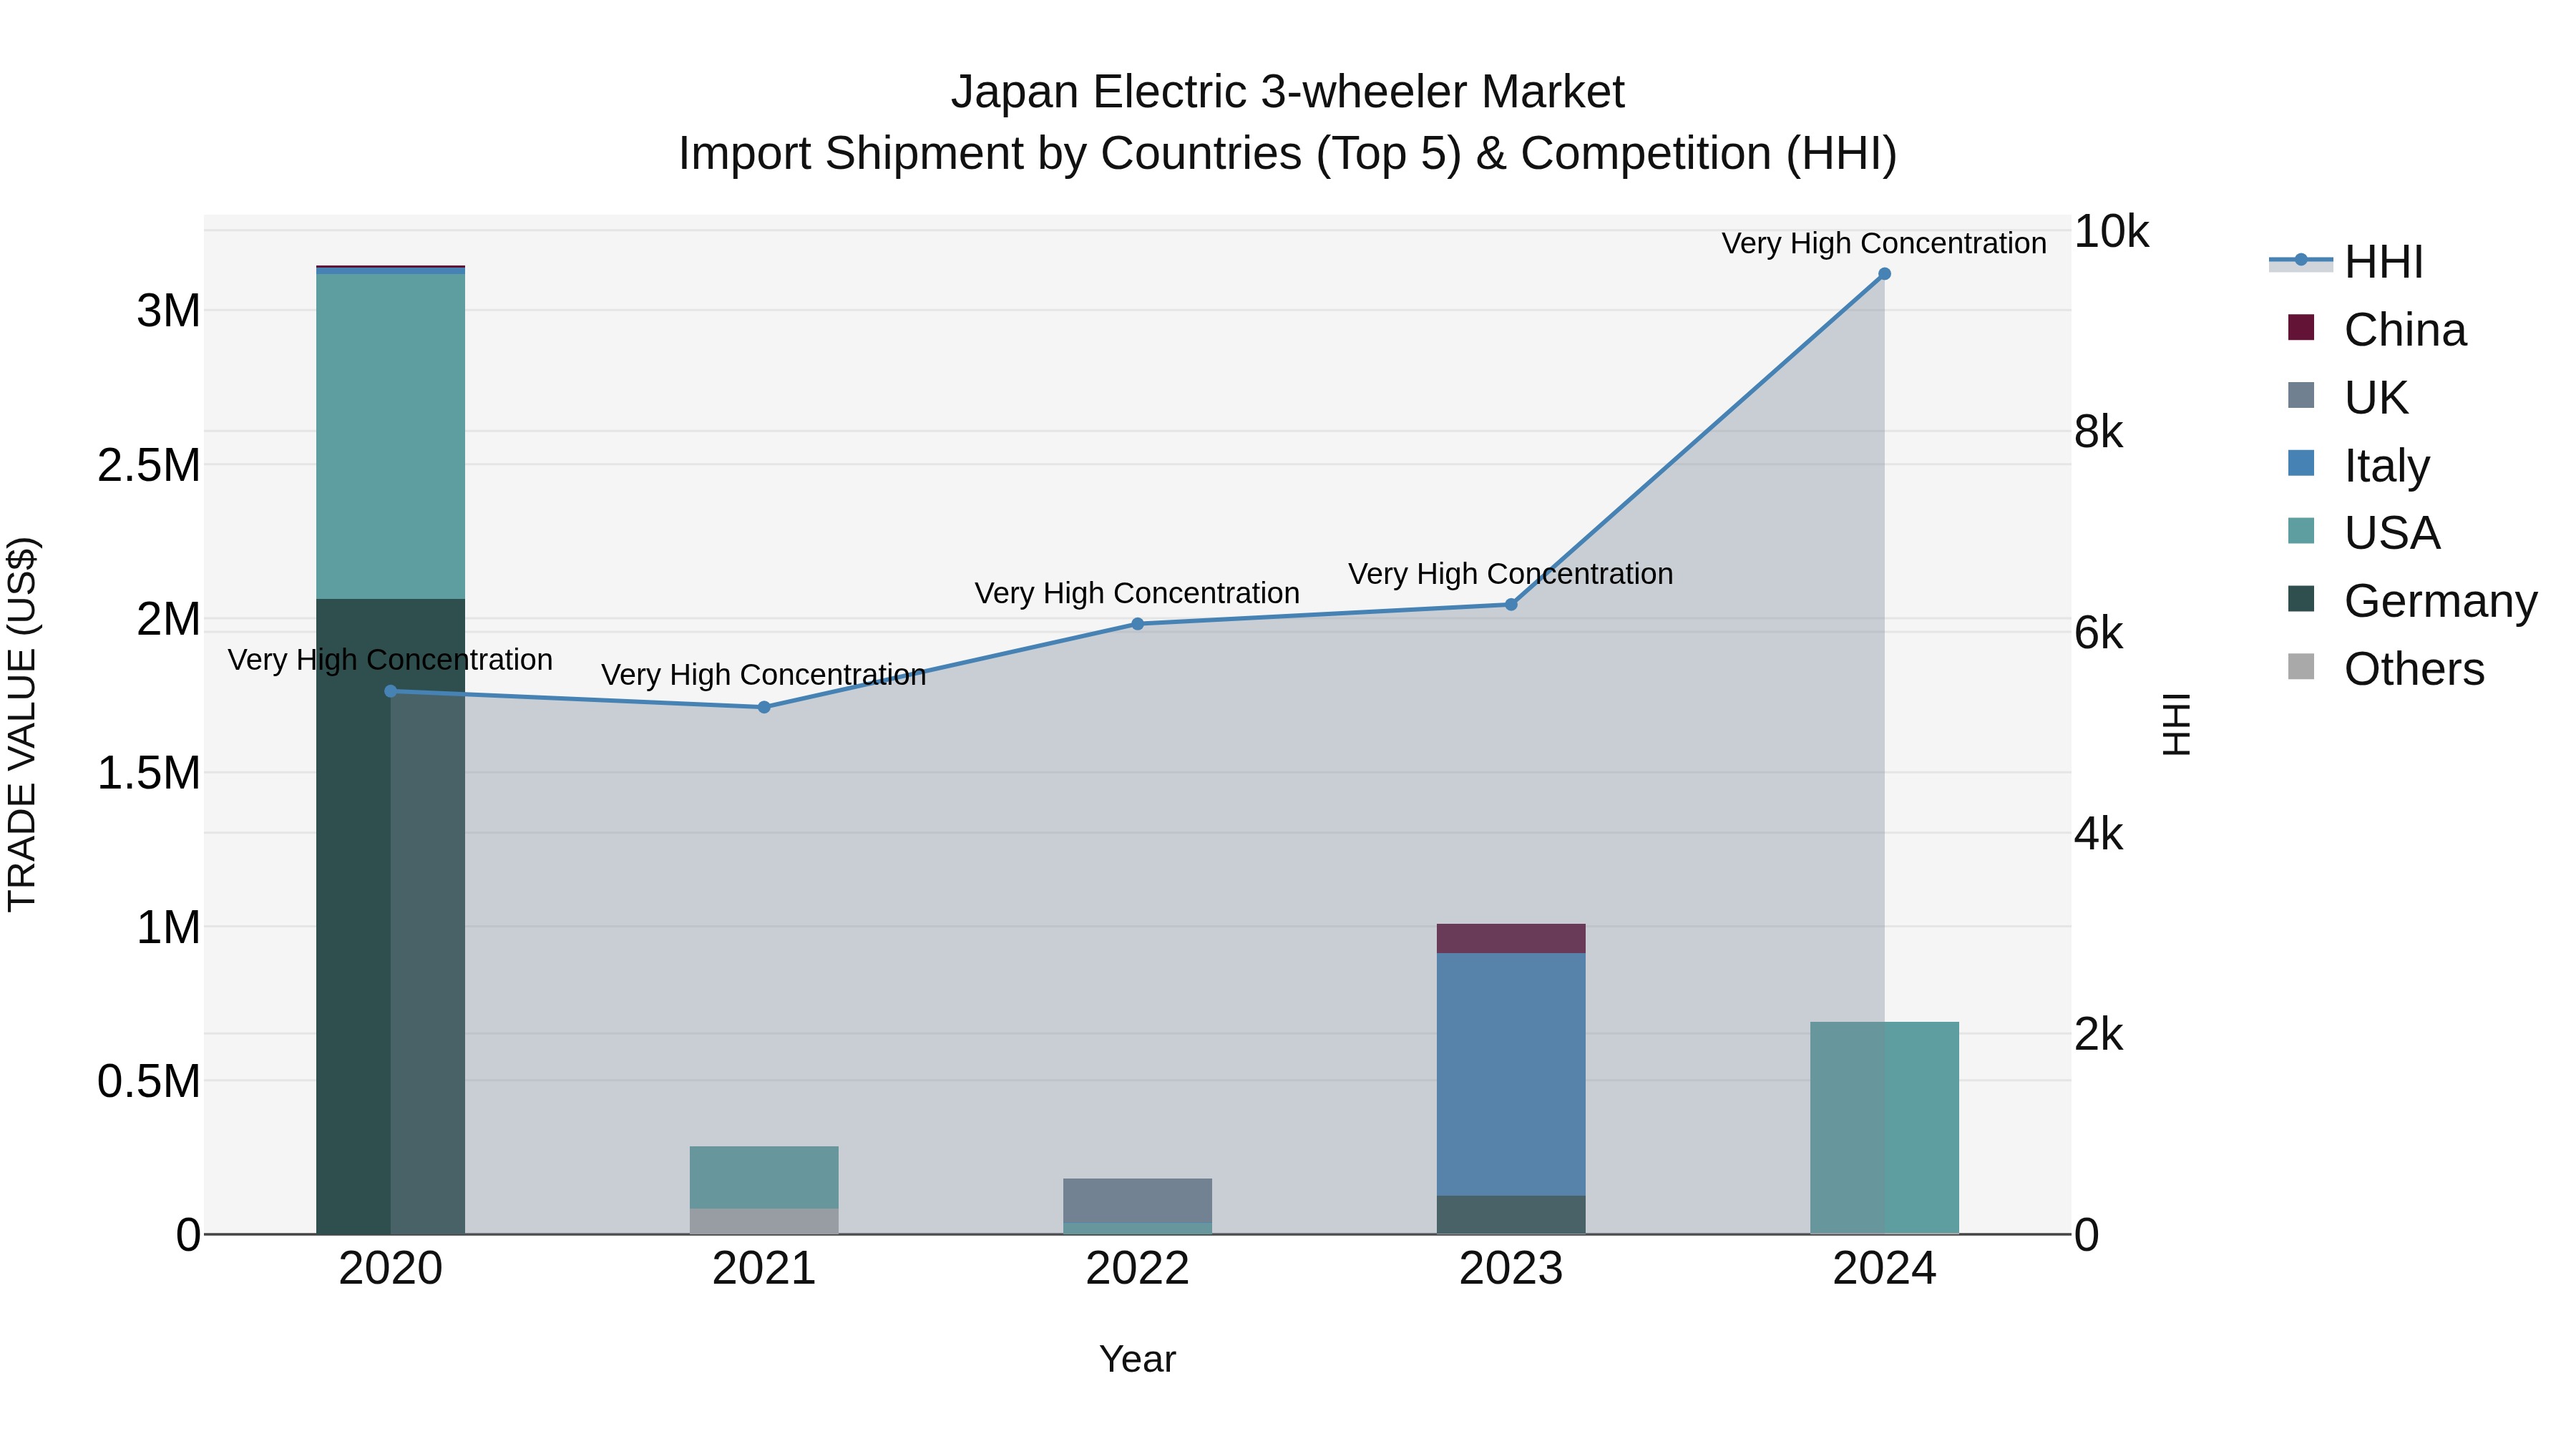
Japan Electric 3-wheeler Market Import Shipment by Countries (Top 5) & Competition (HHI)
The electric 3-wheeler import market in Japan saw a significant drop in CAGR from 2020-2024 at -31.59%, with a further decline in growth rate in 2024 at -31.64%. Despite this, top exporting countries to Japan, including the USA, Belgium, Germany, China, and Italy, continue to dominate the market. The high Herfindahl-Hirschman Index (HHI) indicates a concentrated market, suggesting potential challenges for new entrants. Monitoring these trends is crucial for stakeholders to navigate the evolving landscape and identify opportunities for growth and market expansion.
Japan Electric 3-Wheeler Market Growth Rate
According to 6Wresearch internal database and industry insights, the Japan Electric 3-Wheeler Market is growing at a compound annual growth rate (CAGR) of 12.15% during the forecast period (2026-2032).
Topics Covered in the Japan Electric 3-Wheeler Market Report
The Japan Electric 3-Wheeler Market report thoroughly covers the market by end-use, motor power, battery capacity, range, battery type, and payload capacity. The market report provides an unbiased and detailed analysis of ongoing market trends, opportunities/high-growth areas, and market drivers, which would help stakeholders devise and align their market strategies according to the current and future market dynamics.
Japan Electric 3-Wheeler Market Highlights
| Report Name |
Japan Electric 3-Wheeler Market |
| Forecast period | 2026-2032 |
| CAGR | 12.15% |
| Market Size |
Passenger Carriers |
Japan Electric 3-Wheeler Market Synopsis
The Japan Electric 3-Wheeler Market is composed for a strong growth, fueled by the demand for cleaner, more energy-efficient transport solutions. Along with that, the market benefits from government policies, rise of fuel prices, and the growing environmental concerns. Moreover, the adoption of electric 3-wheelers for urban last-mile connectivity and short-distance transportation is gaining popularity. Furthermore, the increasing focus on eco-friendly transportation and government-led programs to reduce emissions is providing further momentum to market’s growth.
Evaluation of Growth Drivers in the Japan Electric 3-Wheeler Market
Below mentioned are some growth drivers and their impact on market dynamics:
| Drivers | Primary Segments Affected | Why It Matters |
| Government Support & Initiatives | All Segments | Stimulates adoption through subsidies and infrastructure development. |
| Increasing Fuel Prices | End-Use (Passenger Carrier, Load Carrier) | Enhances the demand for cost-effective electric vehicles. |
| Urbanization and Demand for Connectivity | End-Use (Passenger Carrier, Load Carrier) | Drives adoption of electric 3-wheelers in metropolitan areas. |
| EV Technology Advancements | Motor Power, Battery Capacity | Cuts down the cost of electric 3-wheelers while improving performance. |
| Growth in Charging Infrastructure | All Segments | Facilitates increased adoption and operational ease. |
Japan Electric 3-Wheeler Market is expected to grow significantly, with a CAGR of 12.15% during the forecast period of 2026-2032. The market expands as the demand for eco-friendly transportation also rises. Government policies favoring EV adoption, such as subsidies and development of charging infrastructure, are further driving the market growth. Additionally, the increasing demand for passenger carriers and load carriers in urban areas is expected to accelerate market expansion.
Evaluation of Restraints in the Japan Electric 3-Wheeler Market
Below mentioned are some major restraints and their influence on market dynamics:
| Restraints | Primary Segments Affected | What This Means |
| High Initial Cost | All Segments | Limits affordability and adoption in price-sensitive markets. |
| Battery Performance & Range | Battery Capacity, Range | Limits operational efficiency and convenience for users. |
| Charging Infrastructure Gaps | All Segments | Slowdowns the adoption and hampers convenience for consumers. |
| Regulatory and Compliance Issues | All Segments | Limits market access and increases operational costs. |
| Limited Consumer Awareness | All Segments | Delays market’s adoption as consumers get hesitant to switch without enough information or awareness. |
Japan Electric 3-Wheeler Market Challenges
The Japan Electric 3-Wheeler Market faces challenges such as high initial vehicle costs, limited range due to battery limitations, and an underdeveloped charging framework which limits operational efficiency and convenience for users. Apart from that, the regulatory and adherence challenges can also affect the market's growth by restricting market access and increase the operational costs. Additionally, the market's success depends on consumer’s willingness to adopt electric vehicles, particularly in regions where conventional vehicles dominate.
Japan Electric 3-Wheeler Market Trends
Some major trends contributing to the Japan Electric 3-Wheeler Market Growth are:
- Government Support and Incentives: The government incentives and subsidies for electric vehicle adoption, along with tax release are supporting businesses and consumers to invest in electric 3-wheelers.
- Technological Advancements: Continuous advancements in battery technology and motor efficiency are leading the development of high-performing, low-cost electric 3-wheelers.
- Rise of E-Commerce and Last-Mile Connectivity: This growth of e-commerce in Japan is leading the demand for electric 3-wheelers for the delivery application, especially in the cities where last-mile connectivity is crucial.
Investment Opportunities in the Japan Electric 3-Wheeler Market
Here are some investment opportunities in the Japan Electric 3-Wheeler Industry:
- Battery Technology & Performance Improvement: The given investment in next-gen battery technology that extends to the sufficient range and limits the cost of electric 3-wheelers will lead to adoption.
- Infrastructure Development: Building out a network of EV charging stations and supporting facilities will improve operational ease for electric 3-wheeler owners.
- E-Commerce Delivery Services: By investing in electric 3-wheelers dedicated to last-mile delivery services will be a productive opportunity, given the expanding e-commerce sector.
Top 5 Leading Players in the Japan Electric 3-Wheeler Market
Here are some top companies contributing to Japan Electric 3-Wheeler Market Share:
1. Yamaha Motor Co Ltd
| Company Name | Yamaha Motor Co., Ltd. |
|---|---|
| Established Year | 1953 |
| Headquarters | Iwata, Japan |
| Official Website | Click Here |
Yamaha Motor is a leader in the electric 3-wheeler market, focusing on providing environmentally friendly transportation solutions. Their innovative electric vehicles cater to urban mobility needs, making them a key player in Japan's shift towards electric vehicles.
2. Suzuki Motor Corporation
| Company Name | Suzuki Motor Corporation |
|---|---|
| Established Year | 1909 |
| Headquarters | Hamamatsu, Japan |
| Official Website | Click Here |
Suzuki is a prominent player in the EV sector, developing electric 3-wheelers for various urban applications, including passenger carriers and delivery vehicles. Their focus on affordability and performance enhances their competitiveness in the market.
3. Honda Motor Co Ltd
| Company Name | Honda Motor Co., Ltd. |
|---|---|
| Established Year | 1946 |
| Headquarters | Tokyo, Japan |
| Official Website | Click Here |
Honda has been actively expanding its electric vehicle portfolio, offering sustainable and efficient 3-wheeler solutions for both passenger and goods transportation in Japan's urban centers.
4. Terra Motors Corporation
| Company Name | Terra Motors Corporation |
|---|---|
| Established Year | 2010 |
| Headquarters | Tokyo, Japan |
| Official Website | Click Here |
Terra Motors Corporation is a global leader in electric last-mile mobility, known for pioneering the electric three-wheeler segment in Asia and developing sustainable, eco-friendly vehicles for urban transportation.
5. BEMAC Corporation
| Company Name | BEMAC Corporation |
|---|---|
| Established Year | 1946 |
| Headquarters | Imabari, Japan |
| Official Website | Click Here |
BEMAC is a veteran in electrical engineering and power management, which gives them a technical edge in the EV sector. They are specifically recognized for their reliability in commercial applications.
Government Regulations Introduced in the Japan Electric 3-Wheeler Market
According to Japanese government data, the government regulations play a main role in shaping the Japan Electric 3-Wheeler Market. The Japanese government also offers subsidies like tax reductions and incentives to encourage the adoption of electric vehicles. Along with that, the programs such as the "Green Vehicle Promotion" policy, which offers financial support for the development and adoption of green vehicles, includes electric 3-wheelers, significantly improve market prospects. Moreover, the Japanese government is also investing in EV charging framework development, which will ensure a smooth transition to electric vehicles in the country.
Future Insights of the Japan Electric 3-Wheeler Market
The upcoming years for the Japan Electric 3-Wheeler Market appears to be promising, with substantial growth as predicted. With the amount of rising government support, the development of innovative EV technologies, and the rising focus on sustainable transportation are set to lead to market’s expansion. The demand for electric 3-wheelers in last-mile connectivity, urban mobility, and delivery services will continue to rise, expanding the adoption of electric vehicles in Japan.
Market Segmentation Analysis
The report offers a comprehensive study of the subsequent market segments and their leading categories.
Passenger Carrier to Dominate the Market – By End-Use
According to Kanak Phartiyal, Senior Research Analyst at 6Wresearch, the passenger carrier segment dominates the market due to the increasing demand for eco-friendly, affordable, and efficient urban transportation options. Electric 3-wheelers provide a solution for short-distance travel in densely populated cities, making them highly popular in urban settings.
Below 1,000 W to Dominate the Market – By Motor Power
The motor power below 1,000 W dominates the market due to its suitability for urban commuting. And, these 3-wheelers offer sufficient power for last-mile connectivity, which provides an affordable and energy-efficient solution for consumers.
3-6 kWh to Dominate the Market – By Battery Capacity
The 3-6 kWh battery capacity dominates the market as it strikes an optimal balance between cost, performance, and range. So, this battery capacity provides the electric 3-wheelers with enough power for urban distances and allows for more efficient use of resources.
Up to 50 Miles to Dominate the Market – By Range
The "Up to 50 Miles" range segment dominates the market owing to the short distances required for daily commuting in the cities. Apart from that, this range caters to the average distance traveled by the passengers and goods in the city, which also offers the perfect balance of power and economy.
Lithium-ion Battery to Dominate the Market – By Battery Type
Lithium-ion batteries are set to dominate the market due to their superior energy density, long life cycle, and faster charging times compared to lead-acid batteries. However, the lithium-ion batteries are also more eco-friendly, which aligns with the rising demand for eco-friendly technology in urban mobility.
Up to 300 kg to Dominate the Market – By Payload Capacity
The "Up to 300 kg" payload capacity segment dominates the market owing to its suitability for passenger carriers and light goods transport. Also, it is ideal for urban transportation needs, where smaller electric 3-wheelers are more practical for navigating congested areas.
Key attractiveness of the report
- 10 Years Market Numbers.
- Historical Data Starting from 2022 to 2025.
- Base Year: 2025
- Forecast Data until 2032.
- Key Performance Indicators Impacting the Market.
- Major Upcoming Developments and Projects
Key Highlights of the Report:
- Japan Electric 3-Wheeler Market Outlook
- Market Size of Japan Electric 3-Wheeler Market, 2025
- Forecast of Japan Electric 3-Wheeler Market, 2032
- Historical Data and Forecast of Japan Electric 3-Wheeler Revenues & Volume for the Period 2022- 2032
- Japan Electric 3-Wheeler Market Trend Evolution
- Japan Electric 3-Wheeler Market Drivers and Challenges
- Japan Electric 3-Wheeler Price Trends
- Japan Electric 3-Wheeler Porter's Five Forces
- Japan Electric 3-Wheeler Industry Life Cycle
- Historical Data and Forecast of Japan Electric 3-Wheeler Market Revenues & Volume By End-Use for the Period 2022- 2032
- Historical Data and Forecast of Japan Electric 3-Wheeler Market Revenues & Volume By Passenger Carrier for the Period 2022- 2032
- Historical Data and Forecast of Japan Electric 3-Wheeler Market Revenues & Volume By Load Carrier for the Period 2022- 2032
- Historical Data and Forecast of Japan Electric 3-Wheeler Market Revenues & Volume By Motor Power for the Period 2022- 2032
- Historical Data and Forecast of Japan Electric 3-Wheeler Market Revenues & Volume By Below 1,000 W for the Period 2022- 2032
- Historical Data and Forecast of Japan Electric 3-Wheeler Market Revenues & Volume By 1,000-1,500 W for the Period 2022- 2032
- Historical Data and Forecast of Japan Electric 3-Wheeler Market Revenues & Volume By Above 1,500 W for the Period 2022- 2032
- Historical Data and Forecast of Japan Electric 3-Wheeler Market Revenues & Volume By Battery Capacity for the Period 2022- 2032
- Historical Data and Forecast of Japan Electric 3-Wheeler Market Revenues & Volume By Below 3 kWh for the Period 2022- 2032
- Historical Data and Forecast of Japan Electric 3-Wheeler Market Revenues & Volume By 3-6 kWh for the Period 2022- 2032
- Historical Data and Forecast of Japan Electric 3-Wheeler Market Revenues & Volume By Above 6 kWh for the Period 2022- 2032
- Historical Data and Forecast of Japan Electric 3-Wheeler Market Revenues & Volume By Range for the Period 2022- 2032
- Historical Data and Forecast of Japan Electric 3-Wheeler Market Revenues & Volume By Up to 50 Miles for the Period 2022- 2032
- Historical Data and Forecast of Japan Electric 3-Wheeler Market Revenues & Volume By Above 50 Miles for the Period 2022- 2032
- Historical Data and Forecast of Japan Electric 3-Wheeler Market Revenues & Volume By Battery Type for the Period 2022- 2032
- Historical Data and Forecast of Japan Electric 3-Wheeler Market Revenues & Volume By Lead-acid Battery for the Period 2022- 2032
- Historical Data and Forecast of Japan Electric 3-Wheeler Market Revenues & Volume By Lithium-ion Battery for the Period 2022- 2032
- Historical Data and Forecast of Japan Electric 3-Wheeler Market Revenues & Volume By Other for the Period 2022- 2032
- Historical Data and Forecast of Japan Electric 3-Wheeler Market Revenues & Volume By Payload Capacity for the Period 2022- 2032
- Historical Data and Forecast of Japan Electric 3-Wheeler Market Revenues & Volume By Up to 300 kg for the Period 2022- 2032
- Historical Data and Forecast of Japan Electric 3-Wheeler Market Revenues & Volume By 300-500 kg for the Period 2022- 2032
- Historical Data and Forecast of Japan Electric 3-Wheeler Market Revenues & Volume By Above 500 kg for the Period 2022- 2032
- Japan Electric 3-Wheeler Import Export Trade Statistics
- Market Opportunity Assessment By End-Use
- Market Opportunity Assessment By Motor Power
- Market Opportunity Assessment By Battery Capacity
- Market Opportunity Assessment By Range
- Market Opportunity Assessment By Battery Type
- Market Opportunity Assessment By Payload Capacity
- Japan Electric 3-Wheeler Top Companies Market Share
- Japan Electric 3-Wheeler Competitive Benchmarking By Technical and Operational Parameters
- Japan Electric 3-Wheeler Company Profiles
- Japan Electric 3-Wheeler Key Strategic Recommendations
Market Covered
The report subsequently covers the market by following segments and subsegments.
By End-Use
- Passenger Carrier
- Load Carrier
By Motor Power
- Below 1,000 W
- 1,000-1,500 W
- Above 1,500 W
By Battery Capacity
- Below 3 kWh
- 3-6 kWh
- Above 6 kWh
By Range
- Up to 50 Miles
- Above 50 Miles
By Battery Type
- Lead-acid Battery
- Lithium-ion Battery
- Other
By Payload Capacity
- Up to 300 kg
- 300-500 kg
- Above 500 kg
Japan Electric 3-Wheeler Market (2026-2032): FAQs
The Japan Electric 3-Wheeler Market is expected to grow at a CAGR of 12.15% during the forecast period (2026-2032).
The technological advancements are as battery technology, electric motors, and charging framework which are making electric 3-wheelers more affordable and practical for consumers.
The key challenges includes high initial costs, battery restrictions, shortage of charging framework, and regulatory hurdles.
The growth is fueled by government initiatives, innovations in technology, and urban demand for green transport solutions.
6Wresearch actively monitors the Japan Electric 3-Wheeler Market and publishes its comprehensive annual report, highlighting emerging trends, growth drivers, revenue analysis, and forecast outlook. Our insights help businesses to make data-backed strategic decisions with ongoing market dynamics. Our analysts track relevent industries related to the Japan Electric 3-Wheeler Market, allowing our clients with actionable intelligence and reliable forecasts tailored to emerging regional needs.
Yes, we provide customisation as per your requirements. To learn more, feel free to contact us on sales@6wresearch.com
| 1 Executive Summary |
| 2 Introduction |
| 2.1 Key Highlights of the Report |
| 2.2 Report Description |
| 2.3 Market Scope & Segmentation |
| 2.4 Research Methodology |
| 2.5 Assumptions |
| 3 Japan Electric 3-Wheeler Market Overview |
| 3.1 Japan Country Macro Economic Indicators |
| 3.2 Japan Electric 3-Wheeler Market Revenues & Volume, 2022 & 2032F |
| 3.3 Japan Electric 3-Wheeler Market - Industry Life Cycle |
| 3.4 Japan Electric 3-Wheeler Market - Porter's Five Forces |
| 3.5 Japan Electric 3-Wheeler Market Revenues & Volume Share, By End-Use, 2022 & 2032F |
| 3.6 Japan Electric 3-Wheeler Market Revenues & Volume Share, By Motor Power, 2022 & 2032F |
| 3.7 Japan Electric 3-Wheeler Market Revenues & Volume Share, By Battery Capacity, 2022 & 2032F |
| 3.8 Japan Electric 3-Wheeler Market Revenues & Volume Share, By Range, 2022 & 2032F |
| 3.9 Japan Electric 3-Wheeler Market Revenues & Volume Share, By Battery Type, 2022 & 2032F |
| 3.10 Japan Electric 3-Wheeler Market Revenues & Volume Share, By Payload Capacity, 2022 & 2032F |
| 4 Japan Electric 3-Wheeler Market Dynamics |
| 4.1 Impact Analysis |
| 4.2 Market Drivers |
| 4.2.1 Increasing environmental awareness and government initiatives promoting electric vehicles |
| 4.2.2 Rising fuel prices and the need for cost-effective transportation solutions |
| 4.2.3 Technological advancements leading to improved performance and range of electric 3-wheelers |
| 4.3 Market Restraints |
| 4.3.1 High initial cost of electric 3-wheelers compared to conventional vehicles |
| 4.3.2 Limited charging infrastructure for electric vehicles in Japan |
| 4.3.3 Consumer concerns regarding battery life and range anxiety |
| 5 Japan Electric 3-Wheeler Market Trends |
| 6 Japan Electric 3-Wheeler Market, By Types |
| 6.1 Japan Electric 3-Wheeler Market, By End-Use |
| 6.1.1 Overview and Analysis |
| 6.1.2 Japan Electric 3-Wheeler Market Revenues & Volume, By End-Use, 2022 - 2032F |
| 6.1.3 Japan Electric 3-Wheeler Market Revenues & Volume, By Passenger Carrier, 2022 - 2032F |
| 6.1.4 Japan Electric 3-Wheeler Market Revenues & Volume, By Load Carrier, 2022 - 2032F |
| 6.2 Japan Electric 3-Wheeler Market, By Motor Power |
| 6.2.1 Overview and Analysis |
| 6.2.2 Japan Electric 3-Wheeler Market Revenues & Volume, By Below 1,000 W, 2022 - 2032F |
| 6.2.3 Japan Electric 3-Wheeler Market Revenues & Volume, By 1,000-1,500 W, 2022 - 2032F |
| 6.2.4 Japan Electric 3-Wheeler Market Revenues & Volume, By Above 1,500 W, 2022 - 2032F |
| 6.3 Japan Electric 3-Wheeler Market, By Battery Capacity |
| 6.3.1 Overview and Analysis |
| 6.3.2 Japan Electric 3-Wheeler Market Revenues & Volume, By Below 3 kWh, 2022 - 2032F |
| 6.3.3 Japan Electric 3-Wheeler Market Revenues & Volume, By 3-6 kWh, 2022 - 2032F |
| 6.3.4 Japan Electric 3-Wheeler Market Revenues & Volume, By Above 6 kWh, 2022 - 2032F |
| 6.4 Japan Electric 3-Wheeler Market, By Range |
| 6.4.1 Overview and Analysis |
| 6.4.2 Japan Electric 3-Wheeler Market Revenues & Volume, By Up to 50 Miles, 2022 - 2032F |
| 6.4.3 Japan Electric 3-Wheeler Market Revenues & Volume, By Above 50 Miles, 2022 - 2032F |
| 6.5 Japan Electric 3-Wheeler Market, By Battery Type |
| 6.5.1 Overview and Analysis |
| 6.5.2 Japan Electric 3-Wheeler Market Revenues & Volume, By Lead-acid Battery, 2022 - 2032F |
| 6.5.3 Japan Electric 3-Wheeler Market Revenues & Volume, By Lithium-ion Battery, 2022 - 2032F |
| 6.5.4 Japan Electric 3-Wheeler Market Revenues & Volume, By Other, 2022 - 2032F |
| 6.6 Japan Electric 3-Wheeler Market, By Payload Capacity |
| 6.6.1 Overview and Analysis |
| 6.6.2 Japan Electric 3-Wheeler Market Revenues & Volume, By Up to 300 kg, 2022 - 2032F |
| 6.6.3 Japan Electric 3-Wheeler Market Revenues & Volume, By 300-500 kg, 2022 - 2032F |
| 6.6.4 Japan Electric 3-Wheeler Market Revenues & Volume, By Above 500 kg, 2022 - 2032F |
| 7 Japan Electric 3-Wheeler Market Import-Export Trade Statistics |
| 7.1 Japan Electric 3-Wheeler Market Export to Major Countries |
| 7.2 Japan Electric 3-Wheeler Market Imports from Major Countries |
| 8 Japan Electric 3-Wheeler Market Key Performance Indicators |
| 8.1 Average daily usage of electric 3-wheelers |
| 8.2 Number of charging stations and infrastructure development |
| 8.3 Adoption rate of electric 3-wheelers by commercial fleets |
| 8.4 Average maintenance cost comparison between electric and conventional 3-wheelers |
| 8.5 Customer satisfaction and feedback on the performance and usability of electric 3-wheelers |
| 9 Japan Electric 3-Wheeler Market - Opportunity Assessment |
| 9.1 Japan Electric 3-Wheeler Market Opportunity Assessment, By End-Use, 2022 & 2032F |
| 9.2 Japan Electric 3-Wheeler Market Opportunity Assessment, By Motor Power, 2022 & 2032F |
| 9.3 Japan Electric 3-Wheeler Market Opportunity Assessment, By Battery Capacity, 2022 & 2032F |
| 9.4 Japan Electric 3-Wheeler Market Opportunity Assessment, By Range, 2022 & 2032F |
| 9.5 Japan Electric 3-Wheeler Market Opportunity Assessment, By Battery Type, 2022 & 2032F |
| 9.6 Japan Electric 3-Wheeler Market Opportunity Assessment, By Payload Capacity, 2022 & 2032F |
| 10 Japan Electric 3-Wheeler Market - Competitive Landscape |
| 10.1 Japan Electric 3-Wheeler Market Revenue Share, By Companies, 2025 |
| 10.2 Japan Electric 3-Wheeler Market Competitive Benchmarking, By Operating and Technical Parameters |
| 11 Company Profiles |
| 12 Recommendations |
| 13 Disclaimer |
Global Go To Market Strategy - 2030
Export potential enables firms to identify high-growth global markets with greater confidence by combining advanced trade intelligence with a structured quantitative methodology. The framework analyzes emerging demand trends and country-level import patterns while integrating macroeconomic and trade datasets such as GDP and population forecasts, bilateral import–export flows, tariff structures, elasticity differentials between developed and developing economies, geographic distance, and import demand projections. Using weighted trade values from 2020–2024 as the base period to project country-to-country export potential for 2030, these inputs are operationalized through calculated drivers such as gravity model parameters, tariff impact factors, and projected GDP per-capita growth. Through an analysis of hidden potentials, demand hotspots, and market conditions that are most favorable to success, this method enables firms to focus on target countries, maximize returns, and global expansion with data, backed by accuracy.
By factoring in the projected importer demand gap that is currently unmet and could be potential opportunity, it identifies the potential for the Exporter (Country) among 190 countries, against the general trade analysis, which identifies the biggest importer or exporter.
To discover high-growth global markets and optimize your business strategy:
Click Here
Pricing
- Single User License$ 1,995
- Department License$ 2,400
- Site License$ 3,120
- Global License$ 3,795

Leadership Perspectives from Industry Events
Search
Thought Leadership and Analyst Meet


Our Clients
6WResearch In News
- India Export Attractiveness Tracker 2026
- India Air Conditioner Market Set for Strong Rebound in 2026 After Weather-Led Correction and GST-Driven Recovery: 6Wresearch
- ADAS in India: How Automatic Emergency Braking, Blind Spot Detection & Driver Monitoring are Transforming Road Safety
- Doha a strategic location for EV manufacturing hub: IPA Qatar
- Demand for luxury TVs surging in the GCC, says Samsung
- Empowering Growth: The Thriving Journey of Bangladesh’s Cable Industry
Latest Reports
- Nicaragua RPG Gaming Market (2026-2032)
- New Zealand RPG Gaming Market (2026-2032)
- Netherlands RPG Gaming Market (2026-2032)
- Nauru RPG Gaming Market (2026-2032)
- Namibia RPG Gaming Market (2026-2032)
- Mozambique RPG Gaming Market (2026-2032)
- Montenegro RPG Gaming Market (2026-2032)
- Mongolia RPG Gaming Market (2026-2032)
- Monaco RPG Gaming Market (2026-2032)
- Micronesia RPG Gaming Market (2026-2032)
Industry Events and Analyst Meet

EV India Expo 2026

HIMTEX 2026

India Refining Summit 2026

India EV Show 2026

EV tech India Expo 2026
Whitepaper
- Middle East & Africa Commercial Security Market Click here to view more.
- Middle East & Africa Fire Safety Systems & Equipment Market Click here to view more.
- GCC Drone Market Click here to view more.
- Middle East Lighting Fixture Market Click here to view more.
- GCC Physical & Perimeter Security Market Click here to view more.