Japan Electronic parts Market (2026-2032) | Industry, Growth, Trends, Revenue, Value, Share, Outlook, Forecast, Companies, Size & Analysis
Market Forecast By Type (Passive, Active, Electro Mechanic), By Application (Automotive, Communications, Computing Applications, Others) And Competitive Landscape
| Product Code: ETC035562 | Publication Date: Oct 2020 | Updated Date: Jun 2026 | Product Type: Report | |
| Publisher: 6Wresearch | Author: Shubham Deep | No. of Pages: 70 | No. of Figures: 35 | No. of Tables: 5 |
Japan Electronic parts Market Summary
The japan electronic parts market was estimated at USD 140 Million in 2025 and is projected to reach USD 150 Million by 2032, growing at a CAGR of 1.7% from 2026 to 2032.
Japan Electronic parts Market Growth Rate Analysis (2021-2032)
The Japan electronic parts market has exhibited fluctuations in growth, notably starting with a decline of 2.6% in 2021, primarily due to pandemic-related disruptions and supply chain challenges. However, 2022 marked a resurgence with a 4.5% increase as recovery efforts gained momentum and global demand surged. Growth persisted into 2023 at 1.8%, supported by advancements in digitalization and increased investments in infrastructure. Although growth is projected to moderate, with 1.3% in 2024 and tapering to around 0.9% by 2031, the overall trend remains upward. This is driven by ongoing industrial innovation and a strategic pivot towards energy-efficient technologies, aligning with shifting consumer preferences and regulatory frameworks in Japan.
Japan Electronic parts Market Year-wise Growth Rate and Key Drivers
This graph highlights how the Japan Electronic parts Market has steadily grown over the past five years, supported by major growth factors.
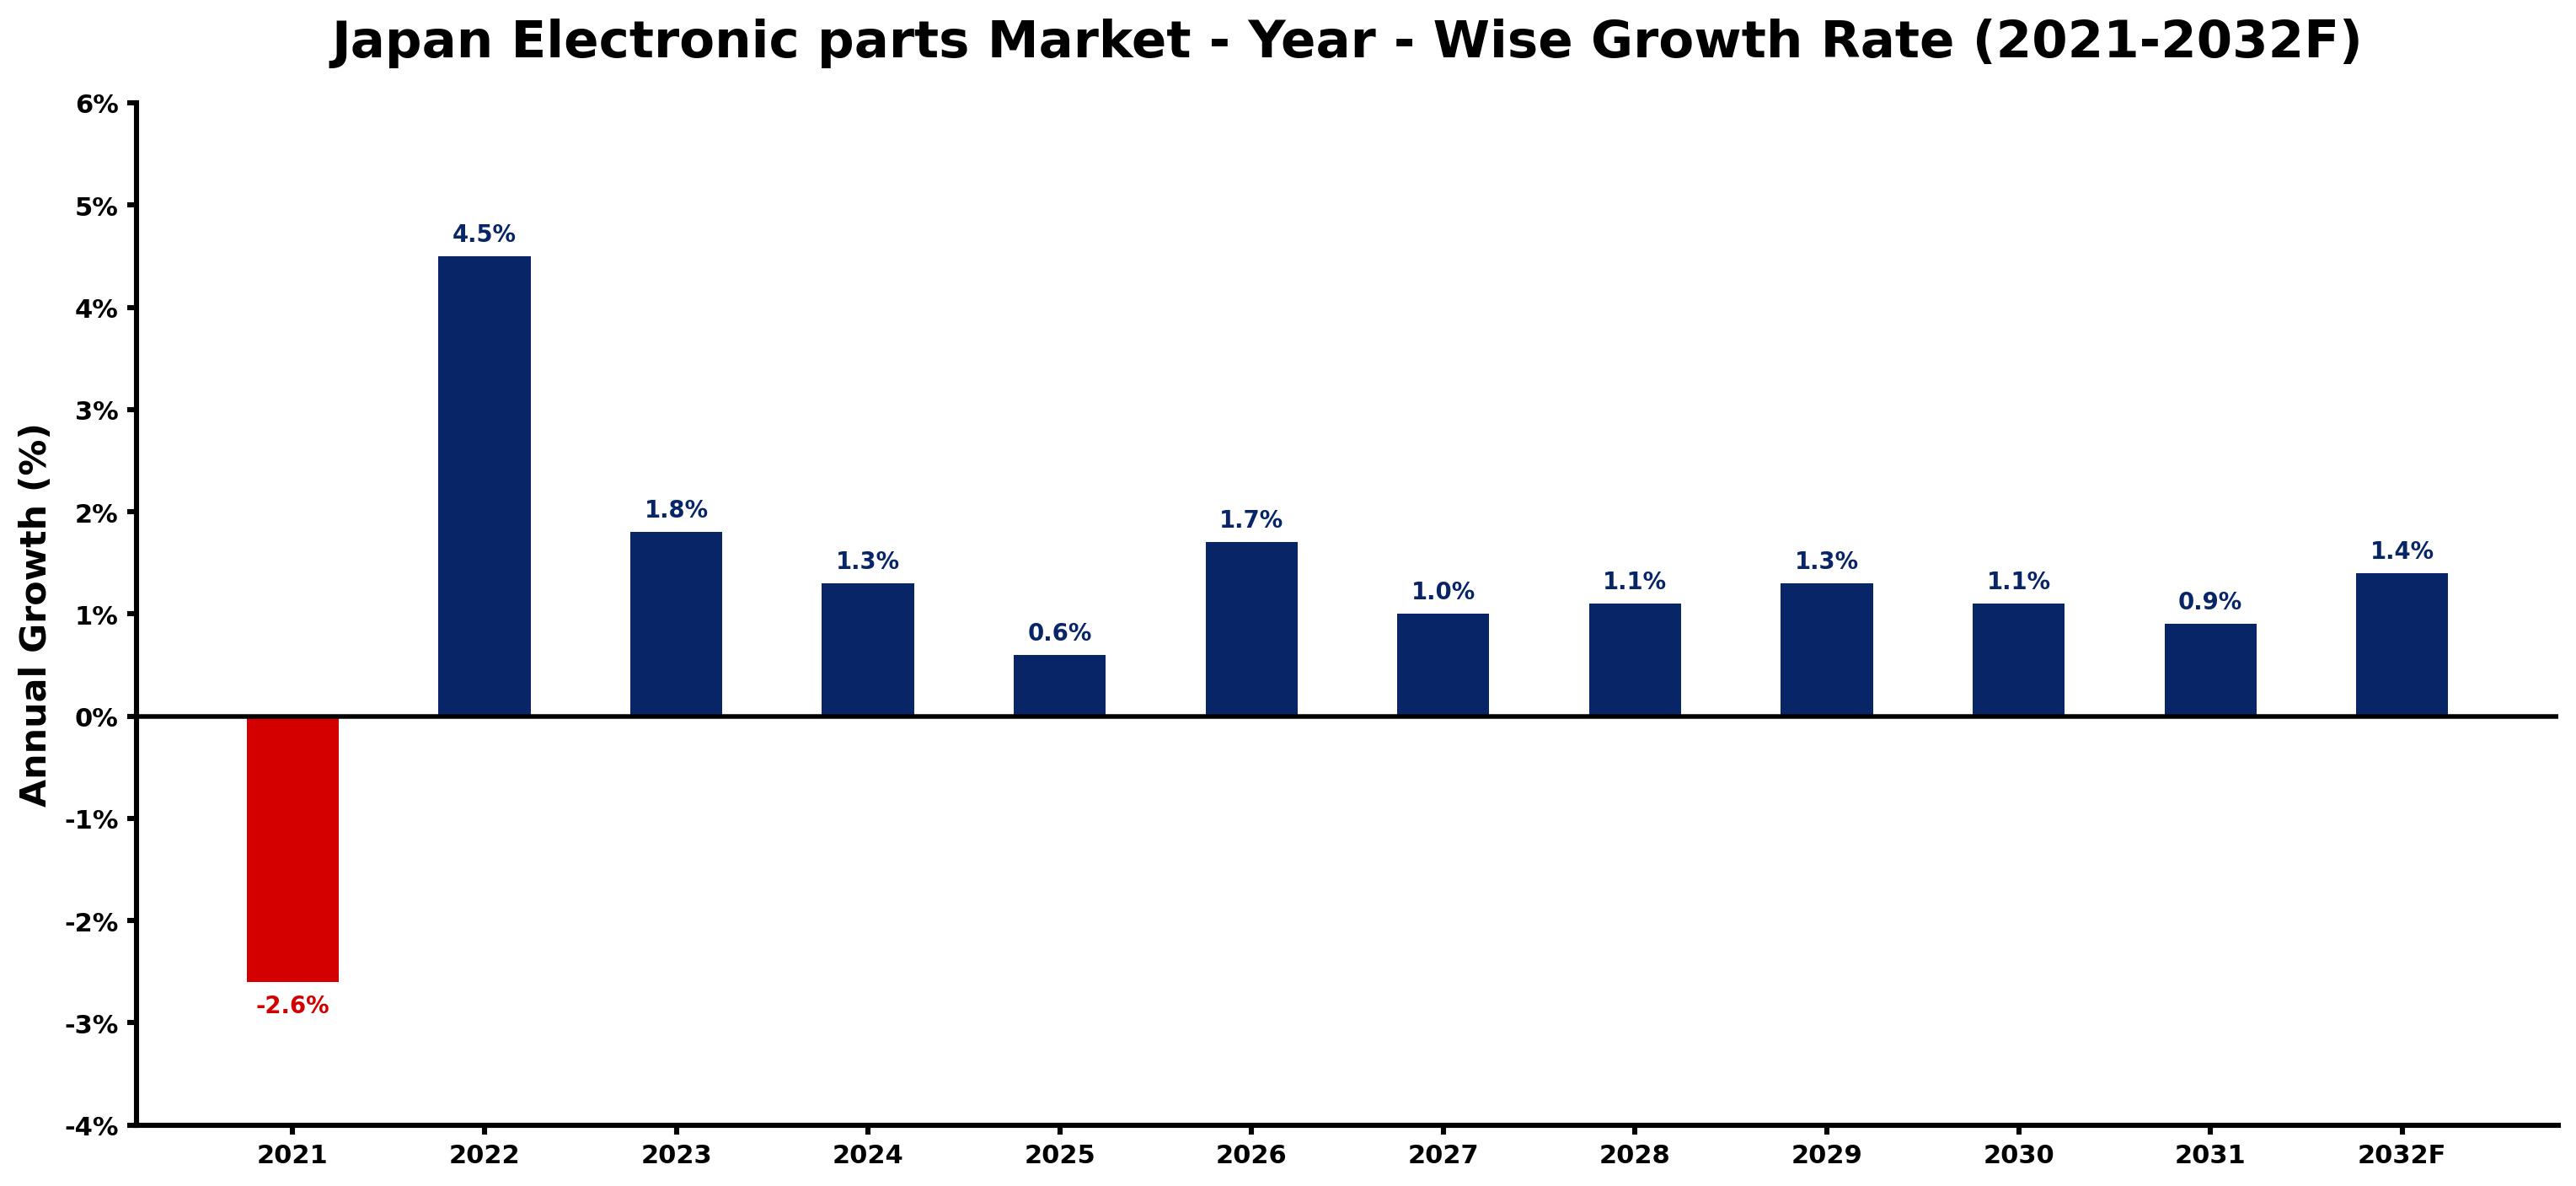
The table below presents the year wise growth rates along with the key drivers influencing the market
| Year | Growth Rate | Major Drivers |
| 2021 | -2.6% | Supply chain disruptions severely impacted component availability, hindering production and leading to significant market downturns. |
| 2022 | 4.5% | The semiconductor shortage highlights the need for robust supply chain strategies in electronics. |
| 2023 | 1.8% | Japanese manufacturers pivot towards automation to enhance productivity and efficiency in operations. |
| 2024 | 1.3% | Emerging technologies in 5G networks create new opportunities for electronic parts demand. |
| 2025 | 0.6% | Consumer electronics market expansion drives innovations in component miniaturization and performance. |
| 2026 | 1.7% | Sustainability initiatives encourage investment in eco-friendly and energy-efficient electronic parts. |
| 2027 | 1.0% | Collaborations between tech companies foster innovations in smart devices and IoT applications. |
| 2028 | 1.1% | Aging infrastructure in transportation prompts investments in advanced electronic control systems. |
| 2029 | 1.3% | Increased focus on telemedicine necessitates reliable electronic parts for healthcare devices. |
| 2030 | 1.1% | The shift towards renewable energy sources boosts demand for specialized electronic components. |
| 2031 | 0.9% | R&D initiatives in robotics create a continuous demand for cutting-edge electronic parts. |
| 2032 | 1.4% | Competitive pressures in global markets lead to improved manufacturing efficiencies and innovations. |
Note - Market size estimations and growth projections presented in this report are based on 6Wresearch's advanced forecasting approach, validated with industry datasets as of June 2026.
Japan Electronic parts Market Synopsis
The Japan Electronic parts Market is projected to reach 1.7% and witness significant growth during the forecast period (2026-2032). This robust market is characterized by a diverse array of products, including semiconductors, resistors, capacitors, connectors, and other essential components. The demand for electronic parts is predominantly fueled by the increasing reliance on technology across various sectors such as automotive, consumer electronics, industrial machinery, and telecommunications. As a global leader in technology and innovation, Japan's electronic parts industry emphasizes high-quality products and cutting-edge technologies, positioning itself to address the evolving needs of modern consumers.
Japan Electronic parts Market Growth Drivers
Several key drivers are propelling the growth of the Japan Electronic parts market. These include:
- Increased demand for miniaturized components to support compact electronic devices, such as wearables and IoT devices, which are becoming increasingly prevalent in daily life.
- The robust growth of the automotive sector, particularly with the shift towards electric and autonomous vehicles, which require advanced sensors and electronic controls.
- The rising consumer demand for smart electronics and connectivity, resulting in greater need for components that facilitate wireless communication and data transfer.
- Technological advancements in automation and robotics across various industries, creating a need for specialized components like actuators and sensors.
- Sustainability initiatives driving the demand for energy-efficient and eco-friendly electronic parts in response to changing consumer preferences and regulatory standards.
Japan Electronic parts Market Challenges and Restraints
While the Japan Electronic parts market presents substantial growth opportunities, it is also faced with several challenges:
- Intense competition from manufacturers in other Asian countries, which impacts pricing pressures and market share for Japanese producers.
- The rapid pace of technological change, necessitating continuous investment in research and development to keep up with consumer trends and innovations.
- Fluctuating exchange rates that can affect the cost structure for importing raw materials and exporting finished goods.
- An aging population influencing workforce availability and overall consumer demand for electronic products, potentially straining market growth.
- Supply chain disruptions, which have become increasingly common due to global events, impacting the timely availability of products and components.
Japan Electronic parts Market Investment Opportunities
The Japan Electronic parts market is ripe for investment in several areas:
- Opportunities in the semiconductor sector, as the demand for these essential components continues to rise with technological advancements across industries.
- Investment potential in the development of sensors and actuators, especially with the increased adoption of automation and smart technologies.
- Growth in passive components such as capacitors and resistors, driven by the expanding consumer electronics market and industrial applications.
- Companies that focus on sustainable practices and the creation of eco-friendly electronic parts may attract interest, given the growing consumer preference for environmentally responsible products.
- Partnerships with research institutions and collaborations aimed at fostering innovation can also create lucrative avenues for investment in emerging technologies.
Japan Electronic parts Market Government Investment and Initiatives
The Japanese government plays a pivotal role in supporting the electronic parts market through various policies and initiatives:
- Financial support for research and development activities aimed at promoting innovative solutions in electronic components.
- Collaborations between industry and academic institutions designed to enhance the capabilities and competitiveness of the electronic parts sector.
- Regulatory frameworks that ensure the safety and quality of electronic components, enhancing consumer confidence in domestic products.
- Incentives for small and medium-sized enterprises (SMEs) to strengthen their market presence and enhance their competitiveness through grants and subsidies.
- Long-term development plans focusing on technological advancements and sustainability, aimed at positioning Japan as a leader in the global electronic parts market.
Japan Electronic parts Market Latest Developments (May 2025 - June 2026)
Recent developments in the Japan Electronic parts market highlight the evolving landscape of this dynamic sector:
- Increased investment in advanced manufacturing technologies, including automation and artificial intelligence, to enhance production efficiency and reduce costs.
- Growing collaboration between technology companies and academic institutions aimed at fostering innovation in electronic component design and manufacturing.
- Expansion of government initiatives focused on promoting sustainable practices across the electronic parts industry, contributing to eco-friendly product development.
- Strategic partnerships formed between local manufacturers and global firms to access wider markets and share technological advancements.
- Ongoing efforts to address supply chain challenges by diversifying sourcing strategies and enhancing logistics efficiencies.
Japan Electronic parts Market - Key Attractiveness of the Report
- 10 Years of Market Numbers
- Historical Data Starting from 2022 to 2025
- Base Year: 2025
- Forecast Data until 2032
- Key Performance Indicators Impacting the Market
- Major Upcoming Developments and Projects
Key Highlights of the Report:
- Japan Electronic parts Market Outlook
- Market Size of Japan Electronic parts Market, 2025
- Forecast of Japan Electronic parts Market, 2032F
- Historical Data and Forecast of Japan Electronic parts Revenues & Volume for the Period 2022-2032F
- Japan Electronic parts Market Trend Evolution
- Japan Electronic parts Market Drivers and Challenges
- Japan Electronic parts Price Trends
- Japan Electronic parts Porter's Five Forces
- Japan Electronic parts Industry Life Cycle
- Historical Data and Forecast of Japan Electronic parts Market Revenues & Volume By Type for the Period 2022-2032F
- Historical Data and Forecast of Japan Electronic parts Market Revenues & Volume By Passive for the Period 2022-2032F
- Historical Data and Forecast of Japan Electronic parts Market Revenues & Volume By Active for the Period 2022-2032F
- Historical Data and Forecast of Japan Electronic parts Market Revenues & Volume By Electro Mechanic for the Period 2022-2032F
- Historical Data and Forecast of Japan Electronic parts Market Revenues & Volume By Application for the Period 2022-2032F
- Historical Data and Forecast of Japan Electronic parts Market Revenues & Volume By Automotive for the Period 2022-2032F
- Historical Data and Forecast of Japan Electronic parts Market Revenues & Volume By Communications for the Period 2022-2032F
- Historical Data and Forecast of Japan Electronic parts Market Revenues & Volume By Computing Applications for the Period 2022-2032F
- Historical Data and Forecast of Japan Electronic parts Market Revenues & Volume By Others for the Period 2022-2032F
- Japan Electronic parts Import Export Trade Statistics
- Market Opportunity Assessment By Type
- Market Opportunity Assessment By Application
- Japan Electronic parts Top Companies Market Share
- Japan Electronic parts Competitive Benchmarking By Technical and Operational Parameters
- Japan Electronic parts Company Profiles
- Japan Electronic parts Key Strategic Recommendations
Frequently Asked Questions About the Market Study (FAQs):
The growth is driven by the increasing demand for miniaturized components, advancements in technology across multiple sectors, and the rising consumer preference for smart, connected devices.
Challenges include intense competition from lower-cost producers in other regions, the need for continuous innovation, and navigating supply chain disruptions.
Investment opportunities exist in sectors such as semiconductors, sensors, and sustainable electronic components, with potential for growth driven by technological advancements.
The government supports the market through funding for R&D, fostering collaborations between industry and academia, and providing incentives for SMEs to enhance competitiveness.
6Wresearch actively monitors the Japan Electronic parts Market and publishes its comprehensive annual report, highlighting emerging trends, growth drivers, revenue analysis, and forecast outlook. Our insights help businesses to make data-backed strategic decisions with ongoing market dynamics. Our analysts track relevent industries related to the Japan Electronic parts Market, allowing our clients with actionable intelligence and reliable forecasts tailored to emerging regional needs.
Yes, we provide customisation as per your requirements. To learn more, feel free to contact us on sales@6wresearch.com
1 Executive Summary |
2 Introduction |
2.1 Key Highlights of the Report |
2.2 Report Description |
2.3 Market Scope & Segmentation |
2.4 Research Methodology |
2.5 Assumptions |
3 Japan Electronic parts Market Overview |
3.1 Japan Country Macro Economic Indicators |
3.2 Japan Electronic parts Market Revenues & Volume, 2022 & 2032F |
3.3 Japan Electronic parts Market - Industry Life Cycle |
3.4 Japan Electronic parts Market - Porter's Five Forces |
3.5 Japan Electronic parts Market Revenues & Volume Share, By Type, 2022 & 2032F |
3.6 Japan Electronic parts Market Revenues & Volume Share, By Application, 2022 & 2032F |
4 Japan Electronic parts Market Dynamics |
4.1 Impact Analysis |
4.2 Market Drivers |
4.2.1 Growing demand for consumer electronics in Japan |
4.2.2 Technological advancements leading to the development of new electronic parts |
4.2.3 Increasing adoption of Internet of Things (IoT) devices in various industries |
4.3 Market Restraints |
4.3.1 High competition in the electronic parts market |
4.3.2 Volatility in raw material prices impacting production costs |
4.3.3 Stringent regulations and compliance requirements in the electronic parts industry |
5 Japan Electronic parts Market Trends |
6 Japan Electronic parts Market, By Types |
6.1 Japan Electronic parts Market, By Type |
6.1.1 Overview and Analysis |
6.1.2 Japan Electronic parts Market Revenues & Volume, By Type, 2022-2032F |
6.1.3 Japan Electronic parts Market Revenues & Volume, By Passive, 2022-2032F |
6.1.4 Japan Electronic parts Market Revenues & Volume, By Active, 2022-2032F |
6.1.5 Japan Electronic parts Market Revenues & Volume, By Electro Mechanic, 2022-2032F |
6.2 Japan Electronic parts Market, By Application |
6.2.1 Overview and Analysis |
6.2.2 Japan Electronic parts Market Revenues & Volume, By Automotive, 2022-2032F |
6.2.3 Japan Electronic parts Market Revenues & Volume, By Communications, 2022-2032F |
6.2.4 Japan Electronic parts Market Revenues & Volume, By Computing Applications, 2022-2032F |
6.2.5 Japan Electronic parts Market Revenues & Volume, By Others, 2022-2032F |
7 Japan Electronic parts Market Import-Export Trade Statistics |
7.1 Japan Electronic parts Market Export to Major Countries |
7.2 Japan Electronic parts Market Imports from Major Countries |
8 Japan Electronic parts Market Key Performance Indicators |
8.1 Research and development investment in new electronic parts technologies |
8.2 Number of patents filed for innovative electronic parts |
8.3 Adoption rate of electronic parts in key industries in Japan |
8.4 Rate of technological obsolescence in electronic parts |
8.5 Customer satisfaction levels with electronic parts performance and reliability. |
9 Japan Electronic parts Market - Opportunity Assessment |
9.1 Japan Electronic parts Market Opportunity Assessment, By Type, 2022 & 2032F |
9.2 Japan Electronic parts Market Opportunity Assessment, By Application, 2022 & 2032F |
10 Japan Electronic parts Market - Competitive Landscape |
10.1 Japan Electronic parts Market Revenue Share, By Companies, 2025 |
10.2 Japan Electronic parts Market Competitive Benchmarking, By Operating and Technical Parameters |
11 Company Profiles |
12 Recommendations |
13 Disclaimer |
Global Go To Market Strategy - 2030
Export potential enables firms to identify high-growth global markets with greater confidence by combining advanced trade intelligence with a structured quantitative methodology. The framework analyzes emerging demand trends and country-level import patterns while integrating macroeconomic and trade datasets such as GDP and population forecasts, bilateral import–export flows, tariff structures, elasticity differentials between developed and developing economies, geographic distance, and import demand projections. Using weighted trade values from 2020–2024 as the base period to project country-to-country export potential for 2030, these inputs are operationalized through calculated drivers such as gravity model parameters, tariff impact factors, and projected GDP per-capita growth. Through an analysis of hidden potentials, demand hotspots, and market conditions that are most favorable to success, this method enables firms to focus on target countries, maximize returns, and global expansion with data, backed by accuracy.
By factoring in the projected importer demand gap that is currently unmet and could be potential opportunity, it identifies the potential for the Exporter (Country) among 190 countries, against the general trade analysis, which identifies the biggest importer or exporter.
To discover high-growth global markets and optimize your business strategy:
Click Here
Pricing
- Single User License$ 1,995
- Department License$ 2,400
- Site License$ 3,120
- Global License$ 3,795

Leadership Perspectives from Industry Events
Search
Thought Leadership and Analyst Meet


Our Clients
6WResearch In News
- India Air Conditioner Market Set for Strong Rebound in 2026 After Weather-Led Correction and GST-Driven Recovery: 6Wresearch
- ADAS in India: How Automatic Emergency Braking, Blind Spot Detection & Driver Monitoring are Transforming Road Safety
- Doha a strategic location for EV manufacturing hub: IPA Qatar
- Demand for luxury TVs surging in the GCC, says Samsung
- Empowering Growth: The Thriving Journey of Bangladesh’s Cable Industry
- Demand for luxury TVs surging in the GCC, says Samsung
Latest Reports
- Nicaragua RPG Gaming Market (2026-2032)
- New Zealand RPG Gaming Market (2026-2032)
- Netherlands RPG Gaming Market (2026-2032)
- Nauru RPG Gaming Market (2026-2032)
- Namibia RPG Gaming Market (2026-2032)
- Mozambique RPG Gaming Market (2026-2032)
- Montenegro RPG Gaming Market (2026-2032)
- Mongolia RPG Gaming Market (2026-2032)
- Monaco RPG Gaming Market (2026-2032)
- Micronesia RPG Gaming Market (2026-2032)
Industry Events and Analyst Meet

HIMTEX 2026

India Refining Summit 2026

India EV Show 2026

EV tech India Expo 2026

Auto Tech Asia 2026
Whitepaper
- Middle East & Africa Commercial Security Market Click here to view more.
- Middle East & Africa Fire Safety Systems & Equipment Market Click here to view more.
- GCC Drone Market Click here to view more.
- Middle East Lighting Fixture Market Click here to view more.
- GCC Physical & Perimeter Security Market Click here to view more.