Japan Flavored Water Market Size & Growth Rate
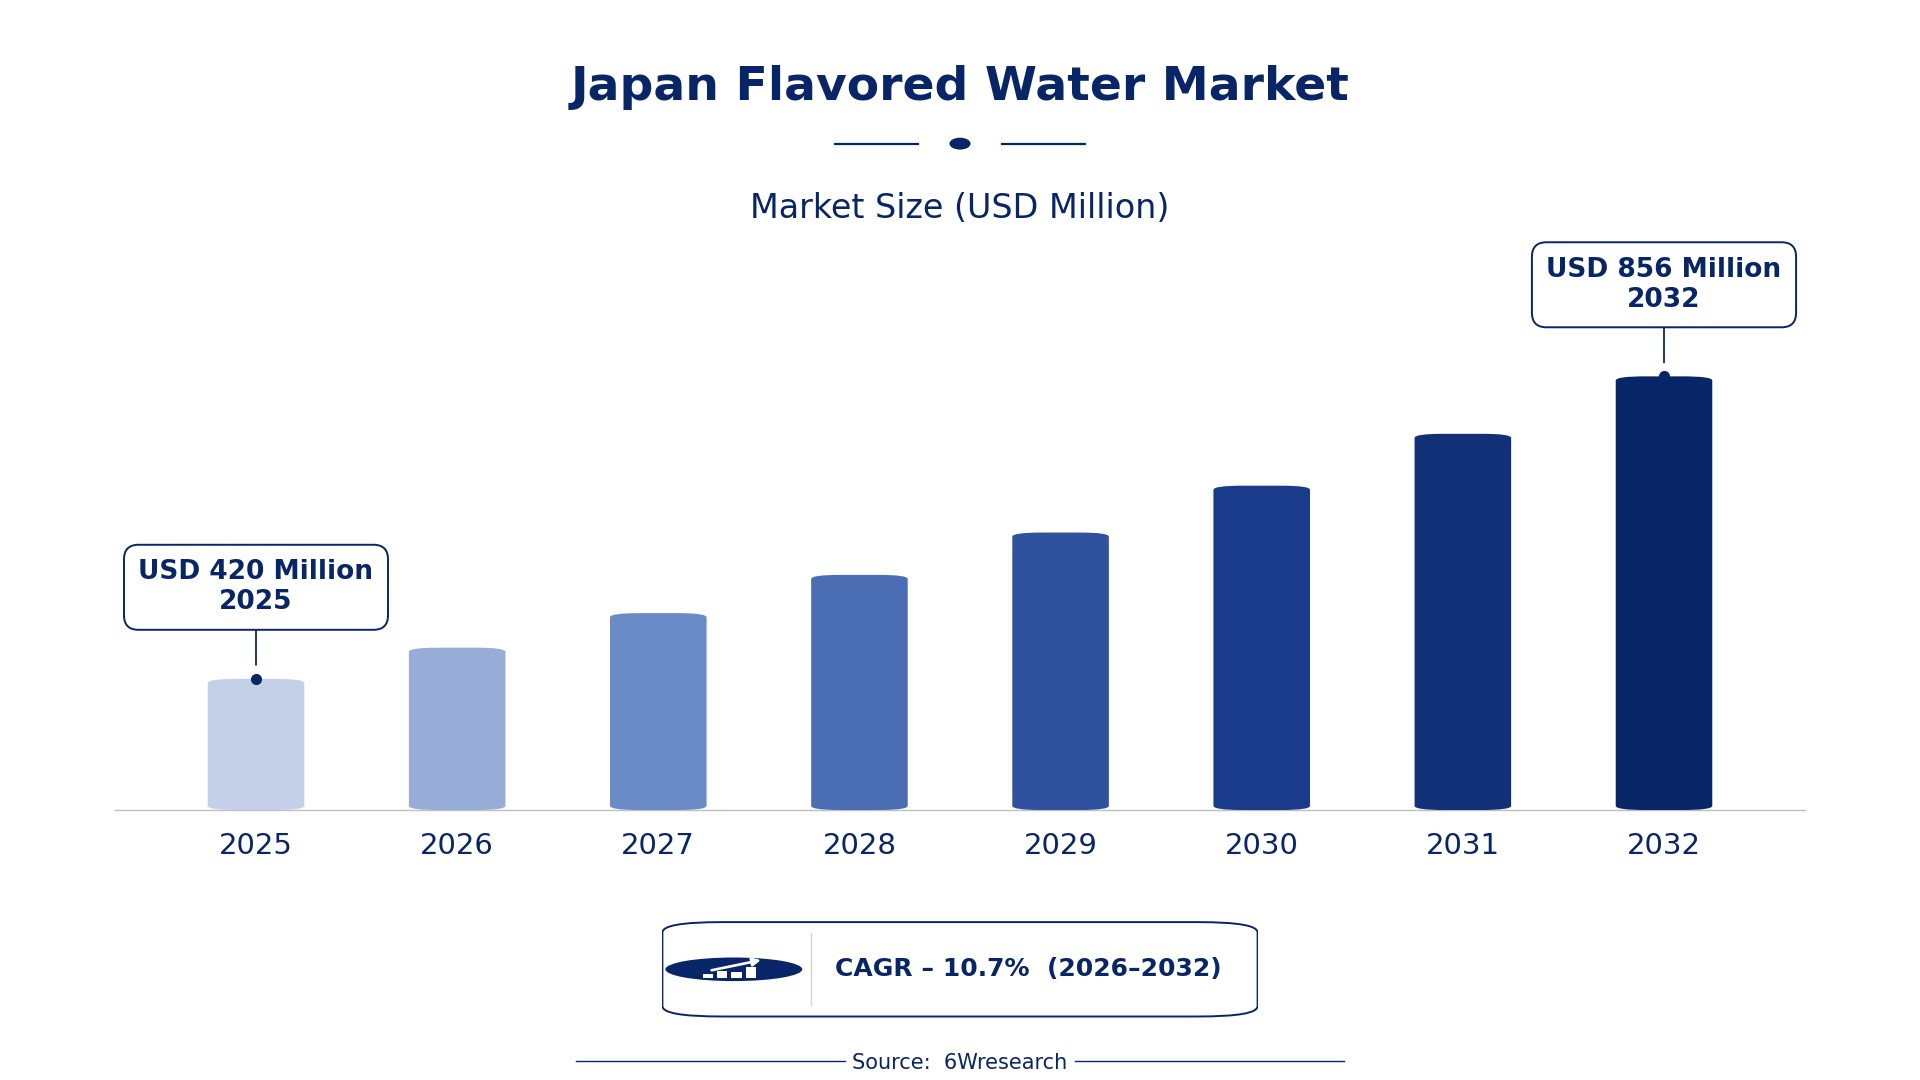
According to 6Wresearch internal database and industry insights, the Japan Flavored Water Market was valued at USD 420 Million in 2025 and is projected to reach USD 856 Million by 2032, growing at a CAGR of approximately 10.7% during 2026–2032.
Japan Flavored Water Market Highlights
| Report Metric | Details |
| Report Name | Japan Flavored Water Market (2026-2032) |
| Market Size 2025 | USD 420 Million |
| Market Size 2032 | USD 856 Million |
| Absolute Growth 2025–2032 | USD 436 Million |
| CAGR 2026–2032 | 10.7% |
| Peak Annual Growth | 12.6% in 2026 |
| Forecast Period | 2026–2032 |
| Historical Data | 2022–2025 |
| Base Year | 2025 |
| Leading Type, 2025 | Carbonated (60% share) |
| Leading Packaging type, 2025 | Bottles (46% share) |
| Leading Distribution Channel, 2025 | Store-Based (55% share) |
| Fastest-Growing Type | Still (13.9% CAGR) |
| Fastest-Growing Packaging type | Cans (14.2% CAGR) |
| Fastest-Growing Distribution Channel | Non-Store-Based (12.4% CAGR) |
| Growing Sector | Beverage Industry |
| Key End Users | Health-conscious consumers, Retailers, Convenience stores, Online shoppers |
Japan Flavored Water Market Year-wise Growth Rate and Key Drivers (2022–2032)
This graph illustrates the annual growth rates of the market from 2022 to 2032, highlighting a steady upward trajectory and projected market expansion over the forecast period.
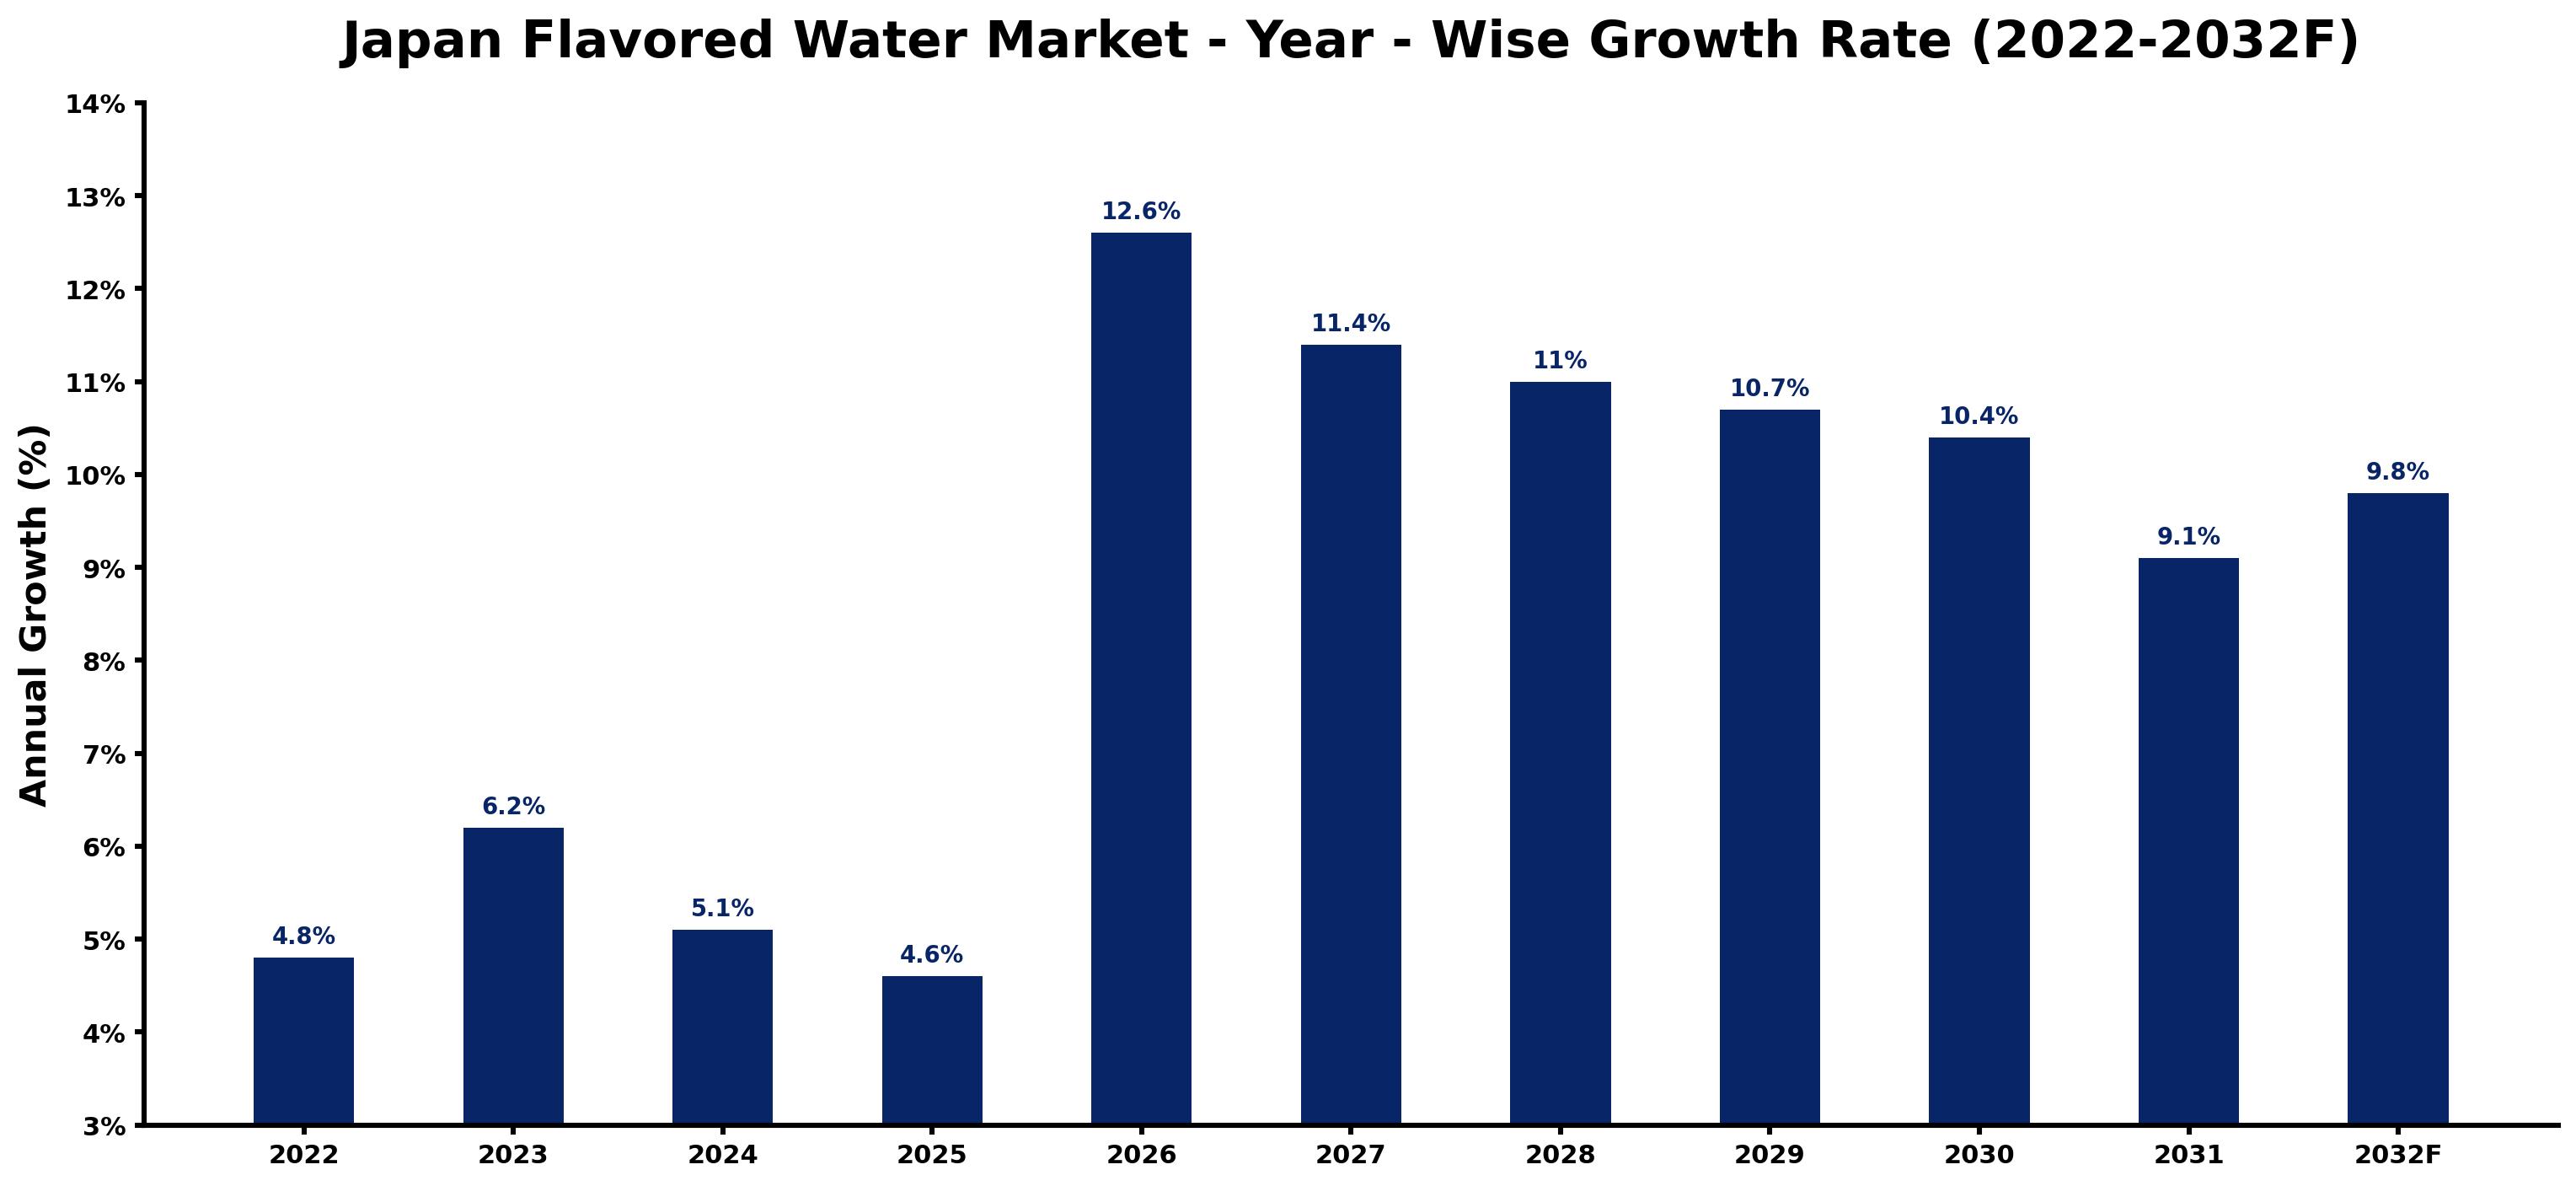
The following figures match every annual growth estimate with the main market development of that year, giving the reasoning behind each rise or slowdown.
| Year | Estimated Annual Growth (%) | Market Rationale |
| 2022 | 4.8 | Flavored water consumption was strong, reflecting a steady interest in healthier beverage options. |
| 2023 | 6.2 | The market saw increased consumer awareness around hydration, boosting flavored water sales. |
| 2024 | 5.1 | Growth slowed as consumers began to shift focus towards other beverage alternatives. |
| 2025 | 4.6 | Demand continued to moderate, as competition intensified within the beverage sector. |
| 2026 | 12.6 | A surge in promotional campaigns for low-calorie drinks is anticipated to spark rapid growth in flavored water sales. |
| 2027 | 11.4 | Sales growth will decelerate slightly as market saturation begins to set in. |
| 2028 | 11.0 | The market will maintain steady growth, driven by ongoing health trends and consumer preferences. |
| 2029 | 10.7 | Growth will continue to slow as consumers explore diverse beverage options beyond flavored water. |
| 2030 | 10.4 | Demand will remain stable, supported by consistent messaging from industry associations. |
| 2031 | 9.1 | Growth will slow further as consumers become more discerning about beverage choices. |
| 2032 | 9.8 | A renewed focus on hydration awareness campaigns is expected to stimulate demand again. |
Note: Market size estimations and growth projections presented in this report are based on 6Wresearch's proprietary forecasting methodology, utilizing the latest available industry data, government publications, and primary research inputs.
Japan Flavored Water Market Synopsis
Flavored water combines water with natural or artificial flavours, often infused with vitamins or minerals, serving as a low-calorie alternative to sugary drinks. The Japan Flavored Water Market is expanding due to rising consumer awareness of hydration and health benefits, with consumption reaching 1.5 million litres in 2022. Tokyo accounts for 30% of sales, while a campaign launched in 2023 to promote low-calorie beverages is expected to drive further growth.
Market Dynamics Impact Analysis (2026–2032)
| Factor | Type | Impact | Primary Segment Affected |
| Growing health consciousness among consumers | Driver | High | Still |
| Increased availability of diverse flavours | Driver | High | Carbonated |
| Expansion of retail channels for flavored water | Opportunity | High | Store-Based |
| Rising demand for low-calorie beverages | Opportunity | High | Non-Store-Based |
| Intense competition from other beverage categories | Restraint | High | Carbonated |
| Price sensitivity among consumers | Restraint | Medium | Still |
| Supply chain disruptions affecting production | Challenge | High | Bottles |
| Fluctuating raw material costs impacting pricing | Challenge | Medium | Cans |
Evaluation of Drivers in Japan Flavored Water Market (2026–2032)
Demand rests on the following drivers, each shown with the segment it touches most.
| Drivers | Primary Segment Affected | Why It Matters (Evidence) |
| Health awareness campaigns | Still | These campaigns promote hydration, leading to increased purchases among health-conscious consumers, with hydration awareness programs launched by health associations since 2021. |
| Diverse flavour offerings | Carbonated | The availability of over 100 flavours attracts consumers seeking variety, encouraging higher sales in retail outlets. |
| Retail channel expansion | Store-Based | The growth of convenience stores, which account for 40% of sales, makes flavored water more accessible to consumers. |
| Promotional activities for low-calorie options | Non-Store-Based | Campaigns launched in 2023 have heightened interest in low-calorie beverages, driving online sales. |
| Endorsements from health associations | Still | Health and nutrition associations endorse flavored water as a healthy choice, influencing consumer purchasing decisions. |
Volumes grow on the back of health awareness campaigns promoting hydration, which have led to increased purchases among health-conscious consumers. The availability of over 100 flavours attracts consumers seeking variety, encouraging higher sales in retail outlets. The growth of convenience stores, accounting for 40% of sales, improves accessibility. Campaigns launched in 2023 have heightened interest in low-calorie beverages, driving online sales. Endorsements from health associations reinforce consumer confidence in flavored water as a healthy choice, further stimulating demand.
Evaluation of Restraints in Japan Flavored Water Market
The main factors holding the market back are set out below.
| Market Restraint | Primary Segment Affected | Why It Matters (Evidence) |
| Intense competition from other beverage categories | Carbonated | Competition from energy drinks and soft drinks limits market share for flavored water, impacting sales growth. |
| Price sensitivity among consumers | Still | Fluctuations in pricing can deter budget-conscious consumers from purchasing flavored water regularly. |
| Supply chain disruptions affecting production | Bottles | Disruptions in supply chains can delay product availability, impacting sales and consumer access. |
| Fluctuating raw material costs impacting pricing | Cans | Increased costs for packaging materials can lead to higher retail prices, affecting consumer purchasing decisions. |
| Limited consumer awareness of health benefits | Still | Some consumers remain unaware of the health benefits of flavored water, limiting potential market growth. |
Japan Flavored Water Market Challenges
Flavored water consumption in Japan reached 1.5 million liters in 2022, highlighting a demand that producers struggle to meet due to skills shortages in flavour formulation. Many producers lack expertise in developing diverse flavours, causing delays in product launches and limiting options for buyers. Strict adherence to the JIS standard for bottled water complicates production, resulting in delays of up to six months for suppliers. Increased competition from alternative low-calorie beverages, spurred by a government campaign, pressures producers to innovate quickly, risking market share for those unable to adapt.
Trends in the Japan Flavored Water Market
Several trends are reshaping the Japan Flavored Water Market; the most important are set out below.
- Shift towards Health-Conscious Choices: Health-conscious consumers are increasingly opting for flavored water as a healthier alternative to sugary drinks, with Tokyo accounting for 30% of sales.
- Transition from Traditional to Unique Flavours: The introduction of unique flavours is reshaping consumer preferences, with flavored water now available in over 100 different varieties.
- Bottles Prioritised over Cans: Bottled flavored water remains the preferred choice for convenience, holding a 46% market share in 2025, while cans are gaining traction.
- Emergence of Online Sales Channels: Non-store-based sales are growing, driven by the increasing popularity of online shopping, with a projected CAGR of 12.4%.
Investment Opportunities in the Japan Flavored Water Market
The opportunities below stand out in the Japan Flavored Water Market for new entrants and existing suppliers.
- Flavored Water Supply: Investing in flavored water production aligns with rising consumer demand for healthier beverages, with the market expected to grow by 5% annually.
- Entry through Joint Ventures: The timing is ideal as consumer interest in hydration continues to rise.
- Retail Expansion in Convenience Stores: Expanding distribution in convenience stores can capture a larger share of the market, which accounts for 40% of flavored water sales.
- Focus on Sustainable Packaging Solutions: Investing in sustainable packaging options can attract environmentally conscious consumers, as the Plastic Resource Circulation Act encourages recycling.
Government Initiatives in the Japan Flavored Water Market
The Industrial Standardization Act, amended in 2019, governs JIS product and test standards, ensuring compliance and quality assurance in the flavored water market. The Water Supply Act, established in 1957, sets standards for drinking-water quality and supply, ensuring safe production of flavored water.
The Plastic Resource Circulation Act promotes sustainable practices among producers, supporting initiatives that encourage the reduction and recycling of plastic packaging. This scheme has benefitted numerous producers, improving their market positioning while ensuring compliance with environmental standards.
Future Insight of the Japan Flavored Water Market
Investment in beverage innovation will increase, driven by government subsidies and growing consumer demand for healthier options. By 2032, the market will see a broader range of flavours, with the average Japanese consumer currently drinking 2 liters of flavored water per week. Hydration awareness initiatives will elevate the profile of flavored water among health-conscious consumers. Suppliers will benefit from advancements in production techniques, allowing them to respond rapidly to changing market preferences.
Market Segmentation Analysis
Japan Flavored Water Market report covers a detailed analysis of the following market segments:
By Type – Carbonated Leads, Still Expected to Grow Fastest
According to Sachin Kumar Rai, Senior Research Analyst at 6Wresearch, Carbonated held 60% of the Japan Flavored Water Market by type in 2025. Carbonated flavored water commands the largest share due to its popularity among consumers seeking refreshing beverage options. The vibrant beverage culture in Tokyo, which accounts for 30% of flavored water sales, significantly influences this preference. Still is set to record the highest CAGR in this split, 13.9% over 2026–2032. Still flavored water is experiencing rapid growth as health-conscious consumers increasingly choose hydration without carbonation. The ongoing campaign promoting low-calorie beverages has notably boosted its appeal among various demographics. Suppliers should focus on diversifying their still flavored water offerings to cater to the rising demand.
By Packaging type – Bottles Lead, Cans Expected to Grow Fastest
In 2025, Bottles led the packaging type split with a 46% share. Bottles are the leading packaging type due to their convenience for consumers purchasing flavored water. The average retail price of ¥150 per bottle underscores their widespread acceptance in the market. Cans are projected to grow fastest, at a CAGR of 14.2% during 2026–2032. Cans are increasingly popular as they offer portability, catering to consumers who prefer convenient options. The rise in online sales channels is also contributing to the demand for canned flavored water. Suppliers may need to refine their can packaging strategies to take advantage of the increasing trend towards convenience.
By Distribution Channel – Store-Based Leads, Non-Store-Based Expected to Grow Fastest
Store-Based accounted for 55% of the market by distribution channel in 2025. Store-based channels are the primary purchasing method for flavored water, holding a substantial share of the market. Convenience stores, which account for 40% of sales, play a vital role in providing easy access to these beverages. Over 2026–2032, Non-Store-Based is expected to post the fastest growth, at a CAGR of 12.4%. Non-store-based channels are gaining traction as online shopping becomes a preferred option for consumers seeking convenience. This trend will likely continue as more consumers embrace digital purchasing for beverages. Suppliers should strengthen their online distribution strategies to capitalise on the expanding market segment.
Key Attractiveness of the Report
- 10 Years of Market Numbers
- Historical Data Starting from 2022 to 2025
- Base Year 2025
- Forecast Data until 2032
- Key Performance Indicators Impacting the Market
- Major Upcoming Developments and Projects
Key Highlights of the Report:
- Japan Flavored Water Market Outlook
- Market Size of Japan Flavored Water Market, 2025
- Forecast of Japan Flavored Water Market, 2032
- Historical Data and Forecast of Japan Flavored Water Revenues & Volume for the Period 2022-2032
- Japan Flavored Water Market Trend Evolution
- Japan Flavored Water Market Drivers and Challenges
- Japan Flavored Water Price Trends
- Japan Flavored Water Porter's Five Forces
- Japan Flavored Water Industry Life Cycle
- Historical Data and Forecast of Japan Flavored Water Market Revenues & Volume By Type for the Period 2022-2032
- Historical Data and Forecast of Japan Flavored Water Market Revenues & Volume By Carbonated for the Period 2022-2032
- Historical Data and Forecast of Japan Flavored Water Market Revenues & Volume By Still for the Period 2022-2032
- Historical Data and Forecast of Japan Flavored Water Market Revenues & Volume By Packaging type for the Period 2022-2032
- Historical Data and Forecast of Japan Flavored Water Market Revenues & Volume By Bottles for the Period 2022-2032
- Historical Data and Forecast of Japan Flavored Water Market Revenues & Volume By Cans for the Period 2022-2032
- Historical Data and Forecast of Japan Flavored Water Market Revenues & Volume By others for the Period 2022-2032
- Historical Data and Forecast of Japan Flavored Water Market Revenues & Volume By Distribution Channel for the Period 2022-2032
- Historical Data and Forecast of Japan Flavored Water Market Revenues & Volume By Store-Based for the Period 2022-2032
- Historical Data and Forecast of Japan Flavored Water Market Revenues & Volume By Non-Store-Based for the Period 2022-2032
- Japan Flavored Water Import Export Trade Statistics
- Market Opportunity Assessment By Type
- Market Opportunity Assessment By Packaging type
- Market Opportunity Assessment By Distribution Channel
- Japan Flavored Water Top Companies Market Share
- Japan Flavored Water Competitive Benchmarking By Technical and Operational Parameters
- Japan Flavored Water Company Profiles
- Japan Flavored Water Key Strategic Recommendations
Market Covered
The following segment groups are covered in the report.
By Type
- Carbonated
- Still
By Packaging type
- Bottles
- Cans
- others
By Distribution Channel
- Store-Based
- Non-Store-Based