Japan Gums Market (2025-2031) | Industry, Size & Revenue, Share, Forecast, Value, Companies, Growth, Segmentation, Outlook, Trends, Analysis, Competitive Landscape
Market Forecast By Confectionery Variant (Bubble Gum, Chewing Gum), By Distribution Channel (Convenience Store, Online Retail Store, Supermarket/Hypermarket, Others) And Competitive Landscape
| Product Code: ETC7739355 | Publication Date: Sep 2024 | Updated Date: Oct 2025 | Product Type: Market Research Report | |
| Publisher: 6Wresearch | Author: Vasudha | No. of Pages: 75 | No. of Figures: 35 | No. of Tables: 20 |
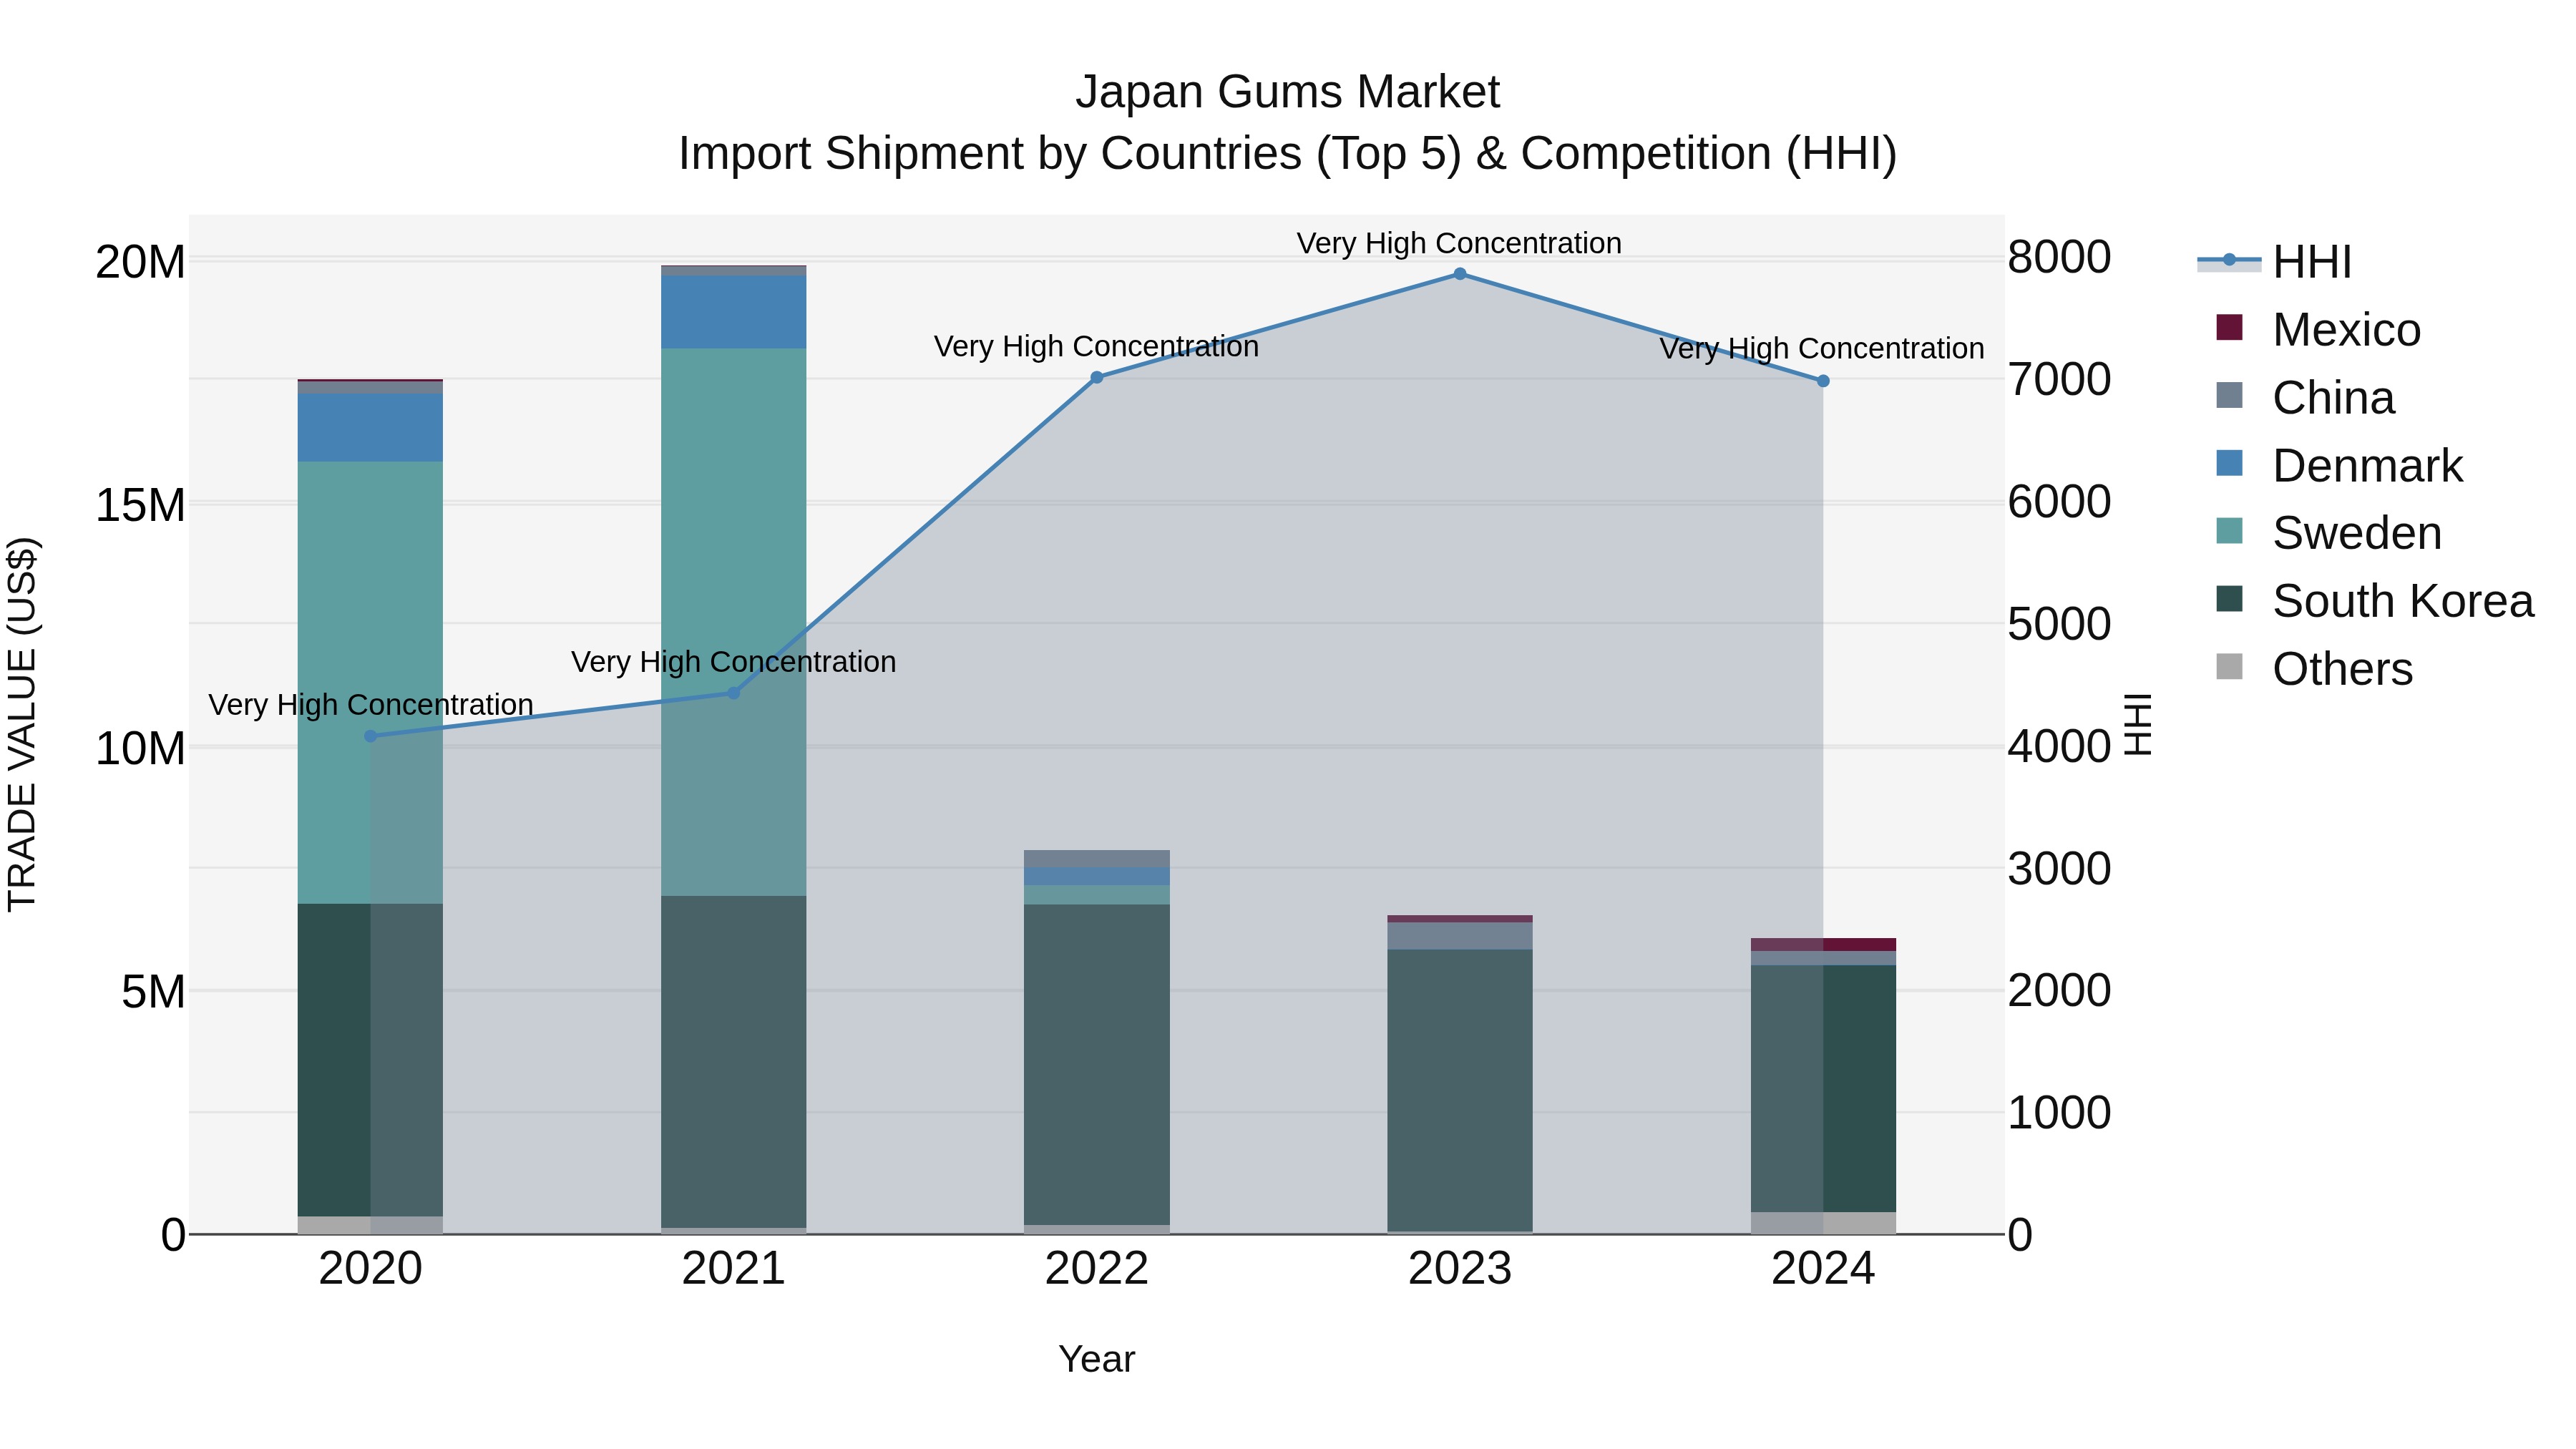
Japan Gums Market Import Shipment by Countries (Top 5) & Competition (HHI)
In 2024, Japan continued to be a significant importer of gums, with top countries like South Korea, Spain, China, Mexico, and the USA dominating the market. Despite a high concentration with a high Herfindahl-Hirschman Index (HHI), the industry saw a negative compound annual growth rate (CAGR) of -23.27% from 2020 to 2024. The growth rate further declined by -7.06% from 2023 to 2024, indicating challenges in the market. It will be essential for industry players to strategize and adapt to the changing dynamics to navigate these challenging times.
Key Highlights of the Report:
- Japan Gums Market Outlook
- Market Size of Japan Gums Market, 2024
- Forecast of Japan Gums Market, 2031
- Historical Data and Forecast of Japan Gums Revenues & Volume for the Period 2021- 2031
- Japan Gums Market Trend Evolution
- Japan Gums Market Drivers and Challenges
- Japan Gums Price Trends
- Japan Gums Porter's Five Forces
- Japan Gums Industry Life Cycle
- Historical Data and Forecast of Japan Gums Market Revenues & Volume By Confectionery Variant for the Period 2021- 2031
- Historical Data and Forecast of Japan Gums Market Revenues & Volume By Bubble Gum for the Period 2021- 2031
- Historical Data and Forecast of Japan Gums Market Revenues & Volume By Chewing Gum for the Period 2021- 2031
- Historical Data and Forecast of Japan Gums Market Revenues & Volume By Distribution Channel for the Period 2021- 2031
- Historical Data and Forecast of Japan Gums Market Revenues & Volume By Convenience Store for the Period 2021- 2031
- Historical Data and Forecast of Japan Gums Market Revenues & Volume By Online Retail Store for the Period 2021- 2031
- Historical Data and Forecast of Japan Gums Market Revenues & Volume By Supermarket/Hypermarket for the Period 2021- 2031
- Historical Data and Forecast of Japan Gums Market Revenues & Volume By Others for the Period 2021- 2031
- Japan Gums Import Export Trade Statistics
- Market Opportunity Assessment By Confectionery Variant
- Market Opportunity Assessment By Distribution Channel
- Japan Gums Top Companies Market Share
- Japan Gums Competitive Benchmarking By Technical and Operational Parameters
- Japan Gums Company Profiles
- Japan Gums Key Strategic Recommendations
Frequently Asked Questions About the Market Study (FAQs):
6Wresearch actively monitors the Japan Gums Market and publishes its comprehensive annual report, highlighting emerging trends, growth drivers, revenue analysis, and forecast outlook. Our insights help businesses to make data-backed strategic decisions with ongoing market dynamics. Our analysts track relevent industries related to the Japan Gums Market, allowing our clients with actionable intelligence and reliable forecasts tailored to emerging regional needs.
Yes, we provide customisation as per your requirements. To learn more, feel free to contact us on sales@6wresearch.com
1 Executive Summary |
2 Introduction |
2.1 Key Highlights of the Report |
2.2 Report Description |
2.3 Market Scope & Segmentation |
2.4 Research Methodology |
2.5 Assumptions |
3 Japan Gums Market Overview |
3.1 Japan Country Macro Economic Indicators |
3.2 Japan Gums Market Revenues & Volume, 2021 & 2031F |
3.3 Japan Gums Market - Industry Life Cycle |
3.4 Japan Gums Market - Porter's Five Forces |
3.5 Japan Gums Market Revenues & Volume Share, By Confectionery Variant, 2021 & 2031F |
3.6 Japan Gums Market Revenues & Volume Share, By Distribution Channel, 2021 & 2031F |
4 Japan Gums Market Dynamics |
4.1 Impact Analysis |
4.2 Market Drivers |
4.2.1 Increasing health consciousness among consumers leading to a preference for sugar-free and functional gums. |
4.2.2 Growing demand for convenience foods and snacks, driving the sales of gums as an on-the-go option. |
4.2.3 Innovations in gum flavors and packaging attracting consumers seeking variety and novelty. |
4.3 Market Restraints |
4.3.1 Competition from substitute products like mints, candies, and chocolates impacting the market growth. |
4.3.2 Regulatory restrictions on certain ingredients used in gums affecting product formulations and market availability. |
5 Japan Gums Market Trends |
6 Japan Gums Market, By Types |
6.1 Japan Gums Market, By Confectionery Variant |
6.1.1 Overview and Analysis |
6.1.2 Japan Gums Market Revenues & Volume, By Confectionery Variant, 2021- 2031F |
6.1.3 Japan Gums Market Revenues & Volume, By Bubble Gum, 2021- 2031F |
6.1.4 Japan Gums Market Revenues & Volume, By Chewing Gum, 2021- 2031F |
6.2 Japan Gums Market, By Distribution Channel |
6.2.1 Overview and Analysis |
6.2.2 Japan Gums Market Revenues & Volume, By Convenience Store, 2021- 2031F |
6.2.3 Japan Gums Market Revenues & Volume, By Online Retail Store, 2021- 2031F |
6.2.4 Japan Gums Market Revenues & Volume, By Supermarket/Hypermarket, 2021- 2031F |
6.2.5 Japan Gums Market Revenues & Volume, By Others, 2021- 2031F |
7 Japan Gums Market Import-Export Trade Statistics |
7.1 Japan Gums Market Export to Major Countries |
7.2 Japan Gums Market Imports from Major Countries |
8 Japan Gums Market Key Performance Indicators |
8.1 Consumer engagement metrics such as social media interactions, reviews, and brand sentiment to gauge market acceptance and loyalty. |
8.2 Rate of new product launches and innovations within the gum market indicating industry dynamism and consumer interest. |
8.3 Distribution expansion metrics like the number of retail outlets or online platforms stocking gum products to track market reach and accessibility. |
9 Japan Gums Market - Opportunity Assessment |
9.1 Japan Gums Market Opportunity Assessment, By Confectionery Variant, 2021 & 2031F |
9.2 Japan Gums Market Opportunity Assessment, By Distribution Channel, 2021 & 2031F |
10 Japan Gums Market - Competitive Landscape |
10.1 Japan Gums Market Revenue Share, By Companies, 2024 |
10.2 Japan Gums Market Competitive Benchmarking, By Operating and Technical Parameters |
11 Company Profiles |
12 Recommendations |
13 Disclaimer |
Export potential assessment - trade Analytics for 2030
Export potential enables firms to identify high-growth global markets with greater confidence by combining advanced trade intelligence with a structured quantitative methodology. The framework analyzes emerging demand trends and country-level import patterns while integrating macroeconomic and trade datasets such as GDP and population forecasts, bilateral import–export flows, tariff structures, elasticity differentials between developed and developing economies, geographic distance, and import demand projections. Using weighted trade values from 2020–2024 as the base period to project country-to-country export potential for 2030, these inputs are operationalized through calculated drivers such as gravity model parameters, tariff impact factors, and projected GDP per-capita growth. Through an analysis of hidden potentials, demand hotspots, and market conditions that are most favorable to success, this method enables firms to focus on target countries, maximize returns, and global expansion with data, backed by accuracy.
By factoring in the projected importer demand gap that is currently unmet and could be potential opportunity, it identifies the potential for the Exporter (Country) among 190 countries, against the general trade analysis, which identifies the biggest importer or exporter.
To discover high-growth global markets and optimize your business strategy:
Click Here
Pricing
- Single User License$ 1,995
- Department License$ 2,400
- Site License$ 3,120
- Global License$ 3,795

Search
Thought Leadership and Analyst Meet


Our Clients
Latest Reports
- Philippines Polyhydroxybutyrate-co-Hydroxyvalerate Market (2026-2032) | Trends, Insights, Challenges, Restraints, Competition, Size, Value, Forecast, Pricing, Share, Outlook, Revenue, Investment Opportunities, Strategy, Drivers, Demand, Growth, segmentation, Analysis, Companies
- Peru Polyhydroxybutyrate-co-Hydroxyvalerate Market (2026-2032) | Growth, Demand, Challenges, Share, Trends, Analysis, Pricing, Investment Opportunities, Drivers, Value, Forecast, Competition, Size, Companies, Insights, Outlook, Restraints, segmentation, Revenue, Strategy
- Pakistan Polyhydroxybutyrate-co-Hydroxyvalerate Market (2026-2032) | Restraints, segmentation, Pricing, Forecast, Share, Strategy, Competition, Trends, Insights, Drivers, Challenges, Growth, Revenue, Outlook, Value, Investment Opportunities, Companies, Size, Analysis, Demand
- Oman Polyhydroxybutyrate-co-Hydroxyvalerate Market (2026-2032) | Drivers, segmentation, Insights, Competition, Pricing, Outlook, Size, Revenue, Challenges, Forecast, Analysis, Growth, Value, Share, Trends, Investment Opportunities, Strategy, Restraints, Companies, Demand
- Nigeria Polyhydroxybutyrate-co-Hydroxyvalerate Market (2026-2032) | Value, Investment Opportunities, Analysis, Revenue, Restraints, Pricing, Outlook, Competition, Demand, Growth, Forecast, Companies, Trends, Challenges, segmentation, Drivers, Insights, Share, Size, Strategy
- Nepal Polyhydroxybutyrate-co-Hydroxyvalerate Market (2026-2032) | Insights, Analysis, Drivers, Share, Revenue, Demand, segmentation, Investment Opportunities, Competition, Forecast, Growth, Pricing, Companies, Strategy, Trends, Restraints, Challenges, Outlook, Size, Value
- Myanmar Polyhydroxybutyrate-co-Hydroxyvalerate Market (2026-2032) | Outlook, Revenue, Strategy, Restraints, Drivers, segmentation, Share, Forecast, Competition, Insights, Growth, Pricing, Size, Demand, Value, Companies, Trends, Challenges, Investment Opportunities, Analysis
- Morocco Polyhydroxybutyrate-co-Hydroxyvalerate Market (2026-2032) | Outlook, Investment Opportunities, Restraints, Strategy, Forecast, Challenges, Drivers, Growth, Companies, segmentation, Trends, Size, Competition, Revenue, Demand, Insights, Share, Analysis, Value, Pricing
- Mexico Polyhydroxybutyrate-co-Hydroxyvalerate Market (2026-2032) | Size, Drivers, Outlook, Share, Strategy, Growth, Pricing, Challenges, Companies, Demand, Value, Investment Opportunities, Restraints, Trends, Forecast, segmentation, Analysis, Insights, Competition, Revenue
- Malaysia Polyhydroxybutyrate-co-Hydroxyvalerate Market (2026-2032) | Share, segmentation, Size, Companies, Analysis, Insights, Forecast, Value, Revenue, Drivers, Restraints, Challenges, Investment Opportunities, Trends, Competition, Strategy, Demand, Growth, Outlook, Pricing
Industry Events and Analyst Meet

HIMTEX 2026

India Refining Summit 2026

India EV Show 2026

EV tech India Expo 2026

Auto Tech Asia 2026
Whitepaper
- Middle East & Africa Commercial Security Market Click here to view more.
- Middle East & Africa Fire Safety Systems & Equipment Market Click here to view more.
- GCC Drone Market Click here to view more.
- Middle East Lighting Fixture Market Click here to view more.
- GCC Physical & Perimeter Security Market Click here to view more.
6WResearch In News
- Doha a strategic location for EV manufacturing hub: IPA Qatar
- Demand for luxury TVs surging in the GCC, says Samsung
- Empowering Growth: The Thriving Journey of Bangladesh’s Cable Industry
- Demand for luxury TVs surging in the GCC, says Samsung
- Video call with a traditional healer? Once unthinkable, it’s now common in South Africa
- Intelligent Buildings To Smooth GCC’s Path To Net Zero