Japan Non-Carbonated Soft Drinks Market Size & Growth Rate
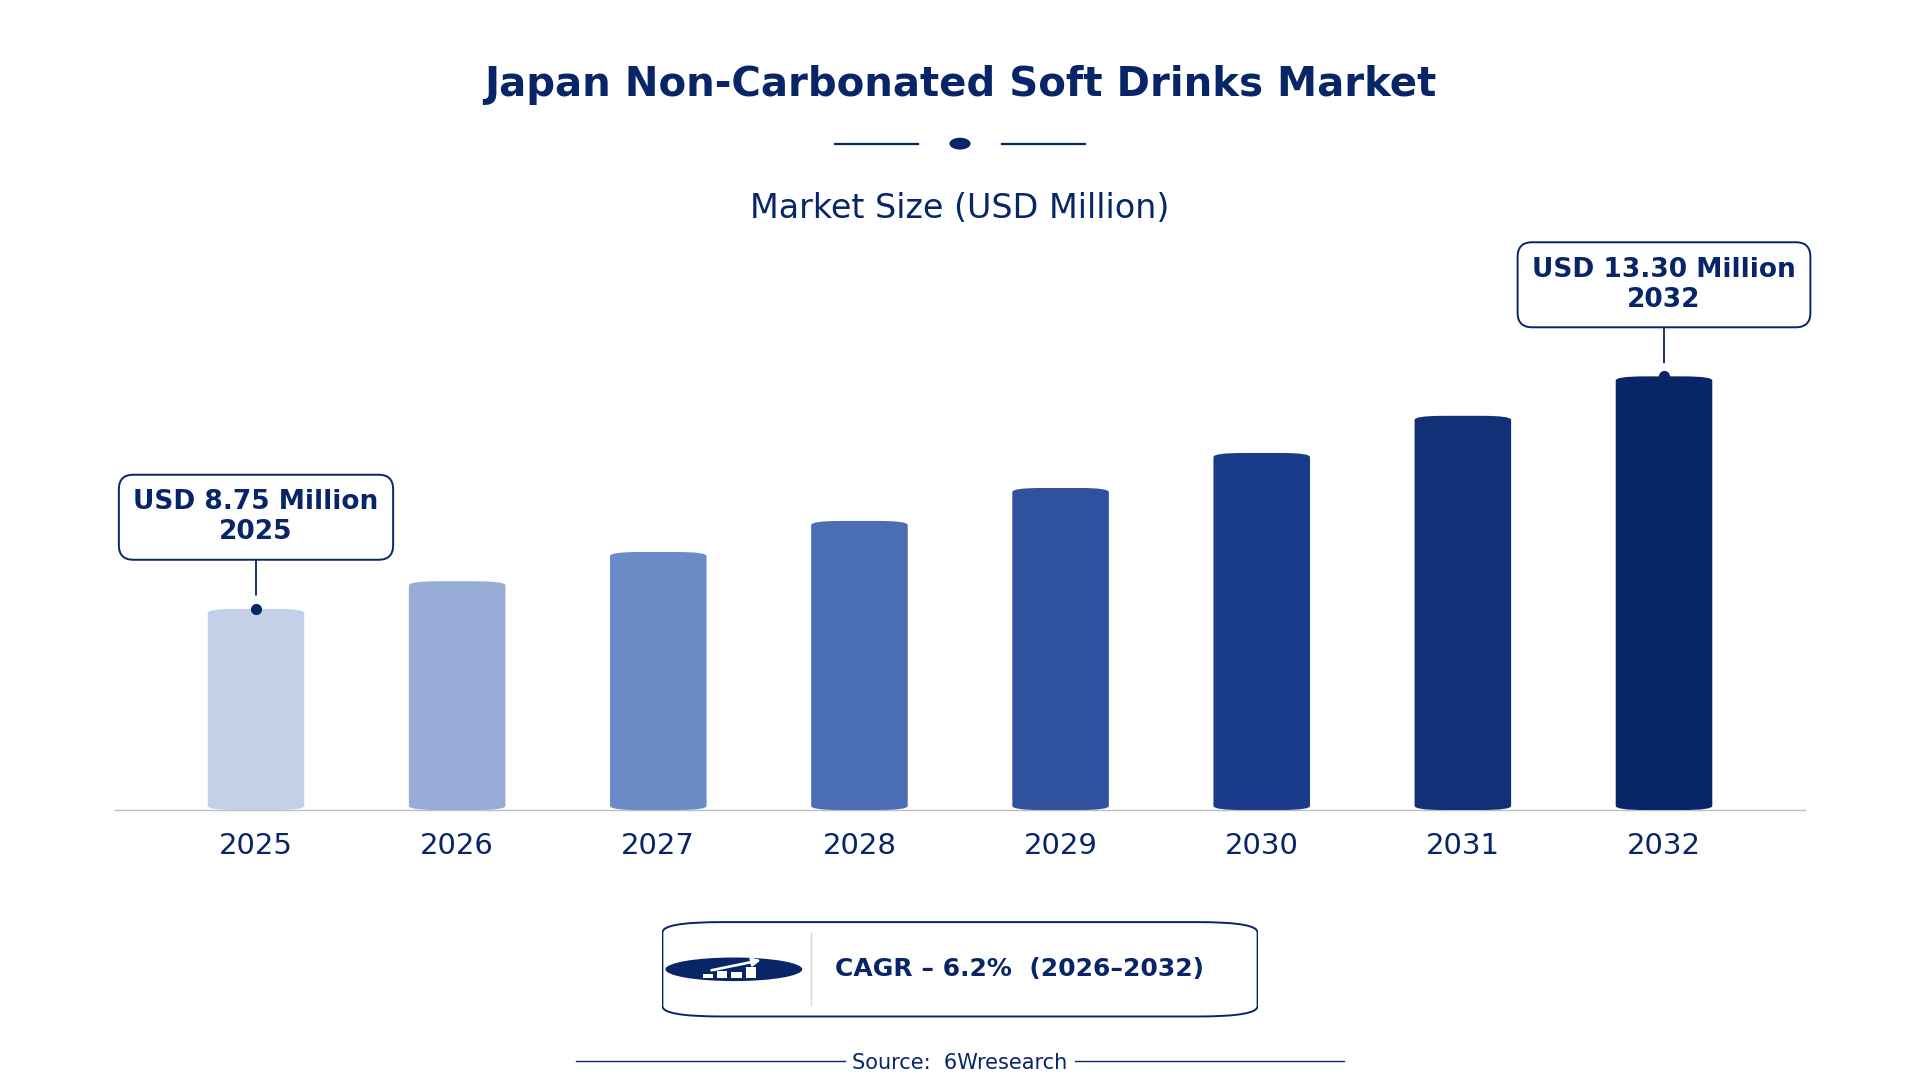
According to 6Wresearch internal database and industry insights, the Japan Non-Carbonated Soft Drinks Market was valued at USD 8.75 Million in 2025 and is projected to reach USD 13.30 Million by 2032, growing at a CAGR of approximately 6.2% during 2026–2032.
Japan Non-Carbonated Soft Drinks Market Highlights
| Report Metric | Details |
| Report Name | Japan Non-Carbonated Soft Drinks Market (2026-2032) |
| Market Size 2025 | USD 8.75 Million |
| Market Size 2032 | USD 13.30 Million |
| Absolute Growth 2025–2032 | USD 4.55 Million |
| CAGR 2026–2032 | 6.2% |
| Peak Annual Growth | 7.1% in 2032 |
| Forecast Period | 2026–2032 |
| Historical Data | 2022–2025 |
| Base Year | 2025 |
| Leading Product, 2025 | RTD (60% share) |
| Leading Distribution Channel, 2025 | Hypermarkets and Supermarkets (51% share) |
| Fastest-Growing Product | Sparkling & Flavored Water (8.6% CAGR) |
| Fastest-Growing Distribution Channel | Convenience Store (8.4% CAGR) |
| Growing Sector | health-conscious beverages |
| Key End Users | urban consumers, health-conscious individuals, convenience store shoppers |
Japan Non-Carbonated Soft Drinks Market Year-wise Growth Rate and Key Drivers (2022–2032)
This graph illustrates the annual growth rates of the market from 2022 to 2032, highlighting a steady upward trajectory and projected market expansion over the forecast period.
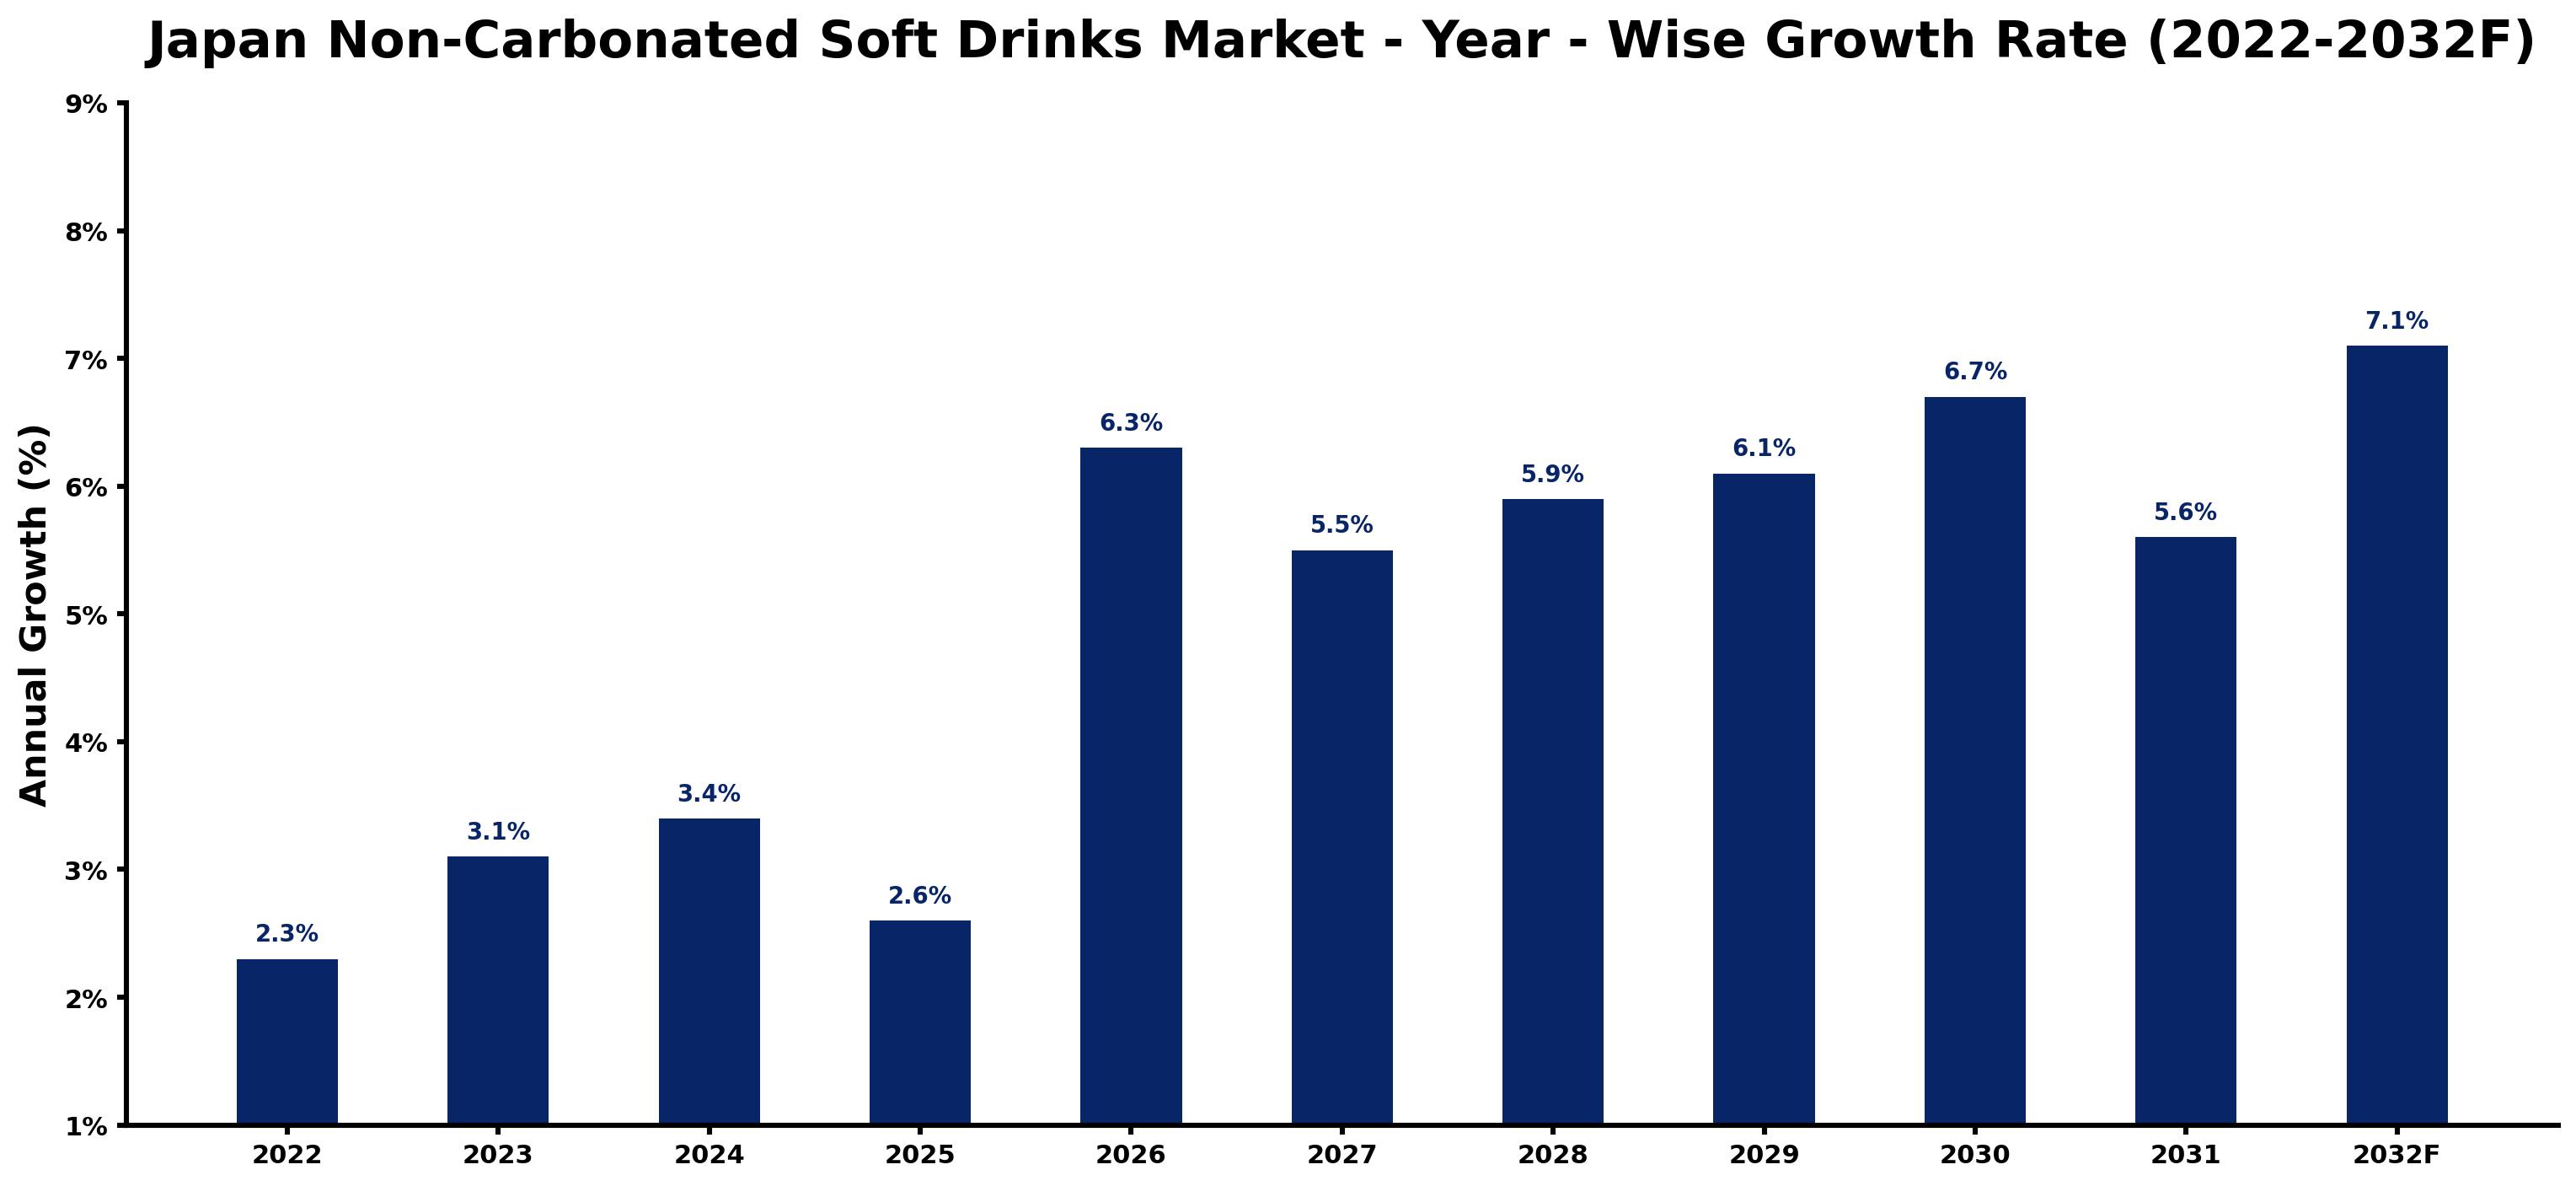
The yearly estimates that follow link every growth rate to its principal driver, so readers can see why the pace changed in each period.
| Year | Estimated Annual Growth (%) | Market Rationale |
| 2022 | 2.3 | The market experienced steady demand from urban consumers seeking alternatives to sugary drinks. |
| 2023 | 3.1 | Growth accelerated as flavored water gained popularity among health-conscious buyers. |
| 2024 | 3.4 | Consumer interest in ready-to-drink beverages continued to rise, boosting market performance. |
| 2025 | 2.6 | Growth slowed as competition intensified among beverage producers in urban areas. |
| 2026 | 6.3 | Demand is expected to surge with the introduction of new low-sugar beverage options in the market. |
| 2027 | 5.5 | Growth will decelerate slightly as consumers become more selective in their beverage choices. |
| 2028 | 5.9 | Interest in flavored water is projected to increase, driving higher sales in urban regions. |
| 2029 | 6.1 | The market is expected to expand as online sales channels become more popular among consumers. |
| 2030 | 6.7 | Growth will pick up again as new health initiatives encourage low-sugar beverage consumption. |
| 2031 | 5.6 | Demand is projected to slow as market saturation begins to affect growth rates. |
| 2032 | 7.1 | The market will peak with rising consumer awareness of health benefits from non-carbonated drinks. |
Note: Market size estimations and growth projections presented in this report are based on 6Wresearch's proprietary forecasting methodology, utilizing the latest available industry data, government publications, and primary research inputs.
Japan Non-Carbonated Soft Drinks Market Synopsis
Non-carbonated soft drinks are beverages without carbonation, including ready-to-drink (RTD) beverages and flavoured waters. The Japan Non-Carbonated Soft Drinks Market is valued at approximately 1 trillion yen, driven by urban consumers seeking healthier alternatives. The growing popularity of flavoured waters, which saw a 15% increase in consumption in urban areas in 2023, alongside a health initiative promoting low-sugar beverages, fuels demand and investment in this sector.
Market Dynamics Impact Analysis (2026–2032)
| Factor | Type | Impact | Primary Segment Affected |
| Rising health consciousness among consumers | Driver | High | RTD |
| Increased demand for hydration alternatives | Driver | High | RTD |
| Growing urban population seeking convenient options | Opportunity | High | Convenience Store |
| Expansion of online sales channels for home delivery | Opportunity | Medium | Online |
| Intense competition among beverage producers | Restraint | High | RTD |
| Market saturation limiting new product introductions | Restraint | Medium | RTD |
| Rising production costs affecting pricing strategies | Challenge | High | RTD |
| Compliance with stringent health regulations | Challenge | Medium | RTD |
Evaluation of Drivers in Japan Non-Carbonated Soft Drinks Market (2026–2032)
The main growth drivers and the segments they affect most are set out below.
| Drivers | Primary Segment Affected | Why It Matters (Evidence) |
| Health-conscious consumers prefer low-sugar options | RTD | Flavored water consumption has increased by 15% in urban areas, leading to higher sales. |
| Convenience of ready-to-drink beverages | RTD | RTD beverages account for over 60% of the market share, attracting busy consumers. |
| Urbanization driving demand for accessible products | Convenience Store | Convenience stores represent 30% of distribution, catering to on-the-go consumers. |
| Growth of online shopping for beverages | Online | Online sales of non-carbonated drinks have grown by 25% in the last year. |
| Government health initiatives promoting low-sugar options | RTD | The 2023 health initiative encourages consumers to choose healthier beverage alternatives. |
Purchasing is picking up as flavoured water consumption has increased by 15% in urban areas, leading many consumers to seek healthier hydration options. The average Japanese consumer drinks 50 litres of non-carbonated beverages annually, reflecting a strong preference for these products. Convenience stores represent 30% of the distribution, making them critical for on-the-go purchases. Online sales have increased by 25% over the past year, indicating a shift towards digital shopping for beverages. Health-conscious buyers are driving demand for low-sugar options, further boosting market growth.
Evaluation of Restraints in Japan Non-Carbonated Soft Drinks Market
The following restraints limit how fast demand can grow.
| Market Restraint | Primary Segment Affected | Why It Matters (Evidence) |
| Intense competition among established brands | RTD | With numerous brands in the market, price wars are common, affecting profit margins. |
| Market saturation limiting growth potential | RTD | As the market matures, introducing new products becomes increasingly challenging. |
| Rising production costs impacting pricing | RTD | Increased costs for ingredients and production can lead to higher retail prices. |
| Compliance with health regulations increasing operational costs | RTD | Producers must invest in meeting stringent health standards, raising overall expenses. |
| Consumer preference shifts towards niche products | RTD | As consumers explore diverse beverage options, traditional RTD products may face declining interest. |
Japan Non-Carbonated Soft Drinks Market Challenges
A shortage of skilled labour in beverage manufacturing limits producers' ability to adapt to market trends. This issue exists due to an ageing workforce and insufficient training, costing producers up to 10% of potential revenue as they struggle to innovate. High logistics expenses challenge importers, particularly when sourcing raw materials, which can increase costs by 15% and reduce profit margins. Buyers face intense competition from low-sugar alternatives, leading to a 20% drop in sales for sugary beverages, forcing them to rethink their purchasing strategies. New regulations from the Ministry of Health mandate a 20% reduction in sugar consumption by 2025, necessitating costly reformulations for producers.
Trends in the Japan Non-Carbonated Soft Drinks Market
Several trends are reshaping the Japan Non-Carbonated Soft Drinks Market; the most important are set out below.
- Increase in Flavoured Water Consumption: Flavoured water is becoming increasingly popular in urban areas, with a 15% rise in consumption in 2023. This shift indicates a growing preference for healthier hydration alternatives among consumers.
- Surge in Online Sales Channels: Online sales of non-carbonated drinks have increased by 25% over the past year, reflecting a change in consumer purchasing habits towards convenience and home delivery.
- Health Initiatives Promoting Low-Sugar Beverages: The government initiative aims to reduce sugar consumption by 20% by 2025, encouraging consumers to opt for low-sugar non-carbonated beverages, influencing market trends.
- Expansion of Convenience Store Distribution: Convenience stores represent 30% of the distribution for non-carbonated drinks, highlighting their importance in meeting consumer demand for accessible beverage options.
Investment Opportunities in the Japan Non-Carbonated Soft Drinks Market
Below are the investment opportunities with the strongest case in the Japan Non-Carbonated Soft Drinks Market.
- Urban Consumers Seeking Healthier Options: Health-conscious urban populations are increasingly looking for low-sugar beverages, with the government targeting a 20% reduction in sugar consumption by 2025. Suppliers can focus on developing low-sugar RTD products.
- Growth in Online Beverage Sales: With online sales of non-carbonated drinks growing by 25%, there is an opportunity for e-commerce platforms to expand their beverage offerings. Partnering with local distributors can facilitate market entry.
- Convenience Store Expansion: As convenience stores account for 30% of distribution, investing in partnerships with these retailers can increase product visibility and sales, particularly in urban areas.
- Health-Conscious Buyer Groups: Health-conscious consumers are driving demand for flavoured waters, presenting an opportunity for producers to innovate and offer new flavours that align with health trends.
Government Initiatives in the Japan Non-Carbonated Soft Drinks Market
The 2023 health initiative promotes low-sugar beverages, building on the Water Supply Act and Sewerage Act, which set standards for safe drinking water and wastewater treatment. This initiative encourages producers to reformulate products to meet health standards, improving consumer safety and satisfaction. The initiative aims to reduce sugar consumption by 20% by 2025, impacting beverage formulation across the industry.
The Digital Agency's efforts streamline beverage regulations, making it easier for buyers to access information about health standards and product safety. This initiative supports informed purchasing decisions and builds trust in beverage quality, with approvals for new low-sugar products expected to increase significantly in the coming years.
Future Insight of the Japan Non-Carbonated Soft Drinks Market
By 2032, the investment pipeline will focus on health-oriented products, stimulating demand for low-sugar beverages and opening new avenues for suppliers. The implementation of ISO 22000 standards will enhance food safety, reassuring buyers about product integrity. Flavoured water consumption will continue to grow, with urban areas projected to see a 15% rise, encouraging producers to expand their portfolios. Enhanced distribution channels will enable suppliers to connect with a wider audience and respond effectively to evolving consumer preferences.
Market Segmentation Analysis
Japan Non-Carbonated Soft Drinks Market report covers a detailed analysis of the following market segments:
By Product – RTD Leads, Sparkling & Flavored Water Expected to Grow Fastest
According to Shubham Padhi, Research Analyst at 6Wresearch, RTD took 60% of product revenue in 2025, more than any other category. RTD beverages dominate the non-carbonated soft drinks market due to their convenience and high consumption rates among Japanese consumers. Their popularity is particularly pronounced in urban areas like Tokyo, where busy lifestyles demand easy access to ready-to-drink options. Sparkling & Flavored Water is set to record the highest CAGR in this split, 8.6% over 2026–2032. The growth of sparkling and flavored water is propelled by a 15% increase in consumption in urban areas in 2023, as consumers seek healthier hydration alternatives. This trend is expected to persist as health initiatives encourage low-sugar beverage choices, allowing RTD options to maintain their lead. Suppliers should focus on expanding their RTD offerings and developing innovative flavored water products to meet evolving consumer preferences.
By Distribution Channel – Hypermarkets and Supermarkets Lead, Convenience Store Expected to Grow Fastest
Hypermarkets and Supermarkets held 51% of the Japan Non-Carbonated Soft Drinks Market by distribution channel in 2025. Hypermarkets and supermarkets serve as the primary distribution channels for non-carbonated soft drinks, providing consumers with extensive access to a wide variety of products. This channel's importance is underscored by its role as a major retail point for consumer purchases. Over 2026–2032, Convenience Store is expected to post the fastest growth, at a CAGR of 8.4%. Convenience stores are quickly becoming a preferred distribution channel, catering to the rising demand for on-the-go consumption. Their market share is projected to grow as urban lifestyles increasingly favour quick and accessible shopping options. Suppliers need to enhance collaborations with convenience stores to capitalise on the growing trend of on-the-go beverage consumption.
Key Attractiveness of the Report
- 10 Years of Market Numbers
- Historical Data Starting from 2022 to 2025
- Base Year 2025
- Forecast Data until 2032
- Key Performance Indicators Impacting the Market
- Major Upcoming Developments and Projects
Key Highlights of the Report:
- Japan Non-Carbonated Soft Drinks Market Outlook
- Market Size of Japan Non-Carbonated Soft Drinks Market, 2025
- Forecast of Japan Non-Carbonated Soft Drinks Market, 2032
- Historical Data and Forecast of Japan Non-Carbonated Soft Drinks Revenues & Volume for the Period 2022-2032
- Japan Non-Carbonated Soft Drinks Market Trend Evolution
- Japan Non-Carbonated Soft Drinks Market Drivers and Challenges
- Japan Non-Carbonated Soft Drinks Price Trends
- Japan Non-Carbonated Soft Drinks Porter's Five Forces
- Japan Non-Carbonated Soft Drinks Industry Life Cycle
- Historical Data and Forecast of Japan Non-Carbonated Soft Drinks Market Revenues & Volume By Product for the Period 2022-2032
- Historical Data and Forecast of Japan Non-Carbonated Soft Drinks Market Revenues & Volume By RTD for the Period 2022-2032
- Historical Data and Forecast of Japan Non-Carbonated Soft Drinks Market Revenues & Volume By Sparkling & Flavored Water for the Period 2022-2032
- Historical Data and Forecast of Japan Non-Carbonated Soft Drinks Market Revenues & Volume By Distribution Channel for the Period 2022-2032
- Historical Data and Forecast of Japan Non-Carbonated Soft Drinks Market Revenues & Volume By Hypermarkets and Supermarkets for the Period 2022-2032
- Historical Data and Forecast of Japan Non-Carbonated Soft Drinks Market Revenues & Volume By Convenience Store for the Period 2022-2032
- Historical Data and Forecast of Japan Non-Carbonated Soft Drinks Market Revenues & Volume By Online for the Period 2022-2032
- Historical Data and Forecast of Japan Non-Carbonated Soft Drinks Market Revenues & Volume By Others for the Period 2022-2032
- Japan Non-Carbonated Soft Drinks Import Export Trade Statistics
- Market Opportunity Assessment By Product
- Market Opportunity Assessment By Distribution Channel
- Japan Non-Carbonated Soft Drinks Top Companies Market Share
- Japan Non-Carbonated Soft Drinks Competitive Benchmarking By Technical and Operational Parameters
- Japan Non-Carbonated Soft Drinks Company Profiles
- Japan Non-Carbonated Soft Drinks Key Strategic Recommendations
Market Covered
Coverage by segment is as follows.
By Product
- RTD
- Sparkling & Flavored Water
By Distribution Channel
- Hypermarkets and Supermarkets
- Convenience Store
- Online
- Others































