Jordan Farm Equipment Market Outlook | Industry, COVID-19 IMPACT, Growth, Forecast, Size, Share, Companies, Analysis, Revenue, Trends & Value
Market Forecast By Power Output (<30 HP, 3170 HP, 71130 HP, 131250 HP, >250 HP), By Drive Type (Two-wheel, Four-wheel), By Function (Plowing & Cultivating, Sowing & Planting, Plant Protection & Fertilizing, Harvesting & Threshing, Others), By Equipment Type (Tractors, Combines, Sprayers, Balers, Others) And Competitive Landscape
| Product Code: ETC324586 | Publication Date: Aug 2022 | Updated Date: Aug 2025 | Product Type: Market Research Report | |
| Publisher: 6Wresearch | Author: Ravi Bhandari | No. of Pages: 75 | No. of Figures: 35 | No. of Tables: 20 |
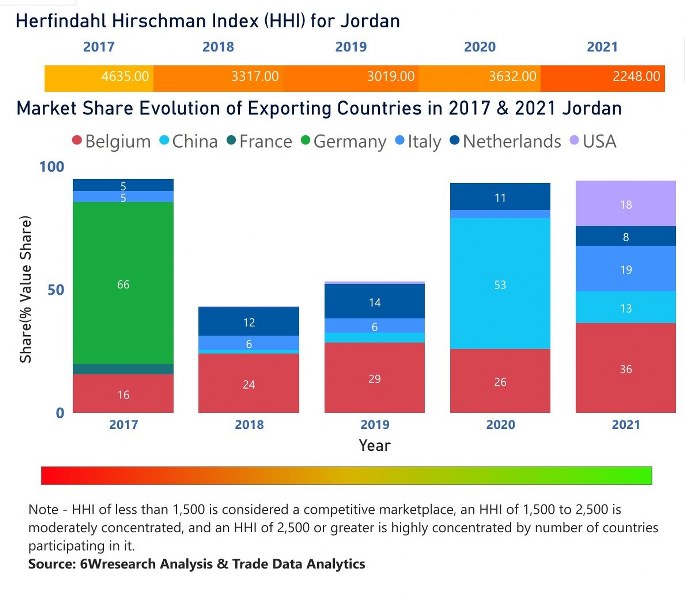
Jordan Farm Equipment Market | Country-Wise Share and Competition Analysis
In the year 2021, Belgium was the largest exporter in terms of value, followed by Italy. It has registered a decline of -18.07% over the previous year. While Italy registered a growth of 214.77% as compared to the previous year. In the year 2017, Germany was the largest exporter followed by Belgium. In terms of the Herfindahl Index, which measures the competitiveness of countries exporting, Jordan has a Herfindahl index of 4635 in 2017 which signifies high concentration also in 2021 it registered a Herfindahl index of 2248 which signifies moderately concentrated in the market.
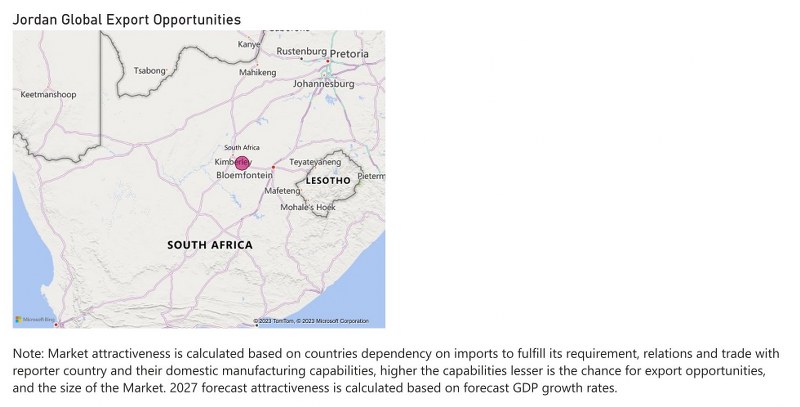
Jordan Farm Equipment Market - Export Market Opportunities
Key Highlights of the Report:
- Jordan Farm Equipment Market Outlook
- Market Size of Jordan Farm Equipment Market, 2021
- Forecast of Jordan Farm Equipment Market, 2028
- Historical Data and Forecast of Jordan Farm Equipment Revenues & Volume for the Period 2018 - 2028
- Jordan Farm Equipment Market Trend Evolution
- Jordan Farm Equipment Market Drivers and Challenges
- Jordan Farm Equipment Price Trends
- Jordan Farm Equipment Porter's Five Forces
- Jordan Farm Equipment Industry Life Cycle
- Historical Data and Forecast of Jordan Farm Equipment Market Revenues & Volume By Power Output for the Period 2018 - 2028
- Historical Data and Forecast of Jordan Farm Equipment Market Revenues & Volume By <30 HP for the Period 2018 - 2028
- Historical Data and Forecast of Jordan Farm Equipment Market Revenues & Volume By 31�70 HP for the Period 2018 - 2028
- Historical Data and Forecast of Jordan Farm Equipment Market Revenues & Volume By 71�130 HP for the Period 2018 - 2028
- Historical Data and Forecast of Jordan Farm Equipment Market Revenues & Volume By 131�250 HP for the Period 2018 - 2028
- Historical Data and Forecast of Jordan Farm Equipment Market Revenues & Volume By >250 HP for the Period 2018 - 2028
- Historical Data and Forecast of Jordan Farm Equipment Market Revenues & Volume By Drive Type for the Period 2018 - 2028
- Historical Data and Forecast of Jordan Farm Equipment Market Revenues & Volume By Two-wheel for the Period 2018 - 2028
- Historical Data and Forecast of Jordan Farm Equipment Market Revenues & Volume By Four-wheel for the Period 2018 - 2028
- Historical Data and Forecast of Jordan Farm Equipment Market Revenues & Volume By Function for the Period 2018 - 2028
- Historical Data and Forecast of Jordan Farm Equipment Market Revenues & Volume By Plowing & Cultivating for the Period 2018 - 2028
- Historical Data and Forecast of Jordan Farm Equipment Market Revenues & Volume By Sowing & Planting for the Period 2018 - 2028
- Historical Data and Forecast of Jordan Farm Equipment Market Revenues & Volume By Plant Protection & Fertilizing for the Period 2018 - 2028
- Historical Data and Forecast of Jordan Farm Equipment Market Revenues & Volume By Harvesting & Threshing for the Period 2018 - 2028
- Historical Data and Forecast of Jordan Farm Equipment Market Revenues & Volume By Others for the Period 2018 - 2028
- Historical Data and Forecast of Jordan Farm Equipment Market Revenues & Volume By Equipment Type for the Period 2018 - 2028
- Historical Data and Forecast of Jordan Farm Equipment Market Revenues & Volume By Tractors for the Period 2018 - 2028
- Historical Data and Forecast of Jordan Farm Equipment Market Revenues & Volume By Combines for the Period 2018 - 2028
- Historical Data and Forecast of Jordan Farm Equipment Market Revenues & Volume By Sprayers for the Period 2018 - 2028
- Historical Data and Forecast of Jordan Farm Equipment Market Revenues & Volume By Balers for the Period 2018 - 2028
- Historical Data and Forecast of Jordan Farm Equipment Market Revenues & Volume By Others for the Period 2018 - 2028
- Jordan Farm Equipment Import Export Trade Statistics
- Market Opportunity Assessment By Power Output
- Market Opportunity Assessment By Drive Type
- Market Opportunity Assessment By Function
- Market Opportunity Assessment By Equipment Type
- Jordan Farm Equipment Top Companies Market Share
- Jordan Farm Equipment Competitive Benchmarking By Technical and Operational Parameters
- Jordan Farm Equipment Company Profiles
- Jordan Farm Equipment Key Strategic Recommendations
Frequently Asked Questions About the Market Study (FAQs):
6Wresearch actively monitors the Jordan Farm Equipment Market and publishes its comprehensive annual report, highlighting emerging trends, growth drivers, revenue analysis, and forecast outlook. Our insights help businesses to make data-backed strategic decisions with ongoing market dynamics. Our analysts track relevent industries related to the Jordan Farm Equipment Market, allowing our clients with actionable intelligence and reliable forecasts tailored to emerging regional needs.
Yes, we provide customisation as per your requirements. To learn more, feel free to contact us on sales@6wresearch.com
|
1 Executive Summary |
|
2 Introduction |
|
2.1 Key Highlights of the Report |
|
2.2 Report Description |
|
2.3 Market Scope & Segmentation |
|
2.4 Research Methodology |
|
2.5 Assumptions |
|
3 Jordan Farm Equipment Market Overview |
|
3.1 Jordan Country Macro Economic Indicators |
|
3.2 Jordan Farm Equipment Market Revenues & Volume, 2021 & 2028F |
|
3.3 Jordan Farm Equipment Market - Industry Life Cycle |
|
3.4 Jordan Farm Equipment Market - Porter's Five Forces |
|
3.5 Jordan Farm Equipment Market Revenues & Volume Share, By Power Output, 2021 & 2028F |
|
3.6 Jordan Farm Equipment Market Revenues & Volume Share, By Drive Type, 2021 & 2028F |
|
3.7 Jordan Farm Equipment Market Revenues & Volume Share, By Function, 2021 & 2028F |
|
3.8 Jordan Farm Equipment Market Revenues & Volume Share, By Equipment Type, 2021 & 2028F |
|
4 Jordan Farm Equipment Market Dynamics |
|
4.1 Impact Analysis |
|
4.2 Market Drivers |
|
4.2.1 Increase in demand for modern and efficient farm equipment due to the need for improved agricultural productivity. |
|
4.2.2 Government initiatives and subsidies to promote mechanization in the agricultural sector. |
|
4.2.3 Technological advancements leading to the development of innovative and precision farming equipment. |
|
4.3 Market Restraints |
|
4.3.1 High initial investment costs associated with purchasing farm equipment. |
|
4.3.2 Dependence on external factors such as weather conditions and global market trends impacting the purchasing power of farmers. |
|
5 Jordan Farm Equipment Market Trends |
|
6 Jordan Farm Equipment Market, By Types |
|
6.1 Jordan Farm Equipment Market, By Power Output |
|
6.1.1 Overview and Analysis |
|
6.1.2 Jordan Farm Equipment Market Revenues & Volume, By Power Output, 2018 - 2028F |
|
6.1.3 Jordan Farm Equipment Market Revenues & Volume, By <30 HP, 2018 - 2028F |
|
6.1.4 Jordan Farm Equipment Market Revenues & Volume, By 31â??70 HP, 2018 - 2028F |
|
6.1.5 Jordan Farm Equipment Market Revenues & Volume, By 71â??130 HP, 2018 - 2028F |
|
6.1.6 Jordan Farm Equipment Market Revenues & Volume, By 131â??250 HP, 2018 - 2028F |
|
6.1.7 Jordan Farm Equipment Market Revenues & Volume, By >250 HP, 2018 - 2028F |
|
6.2 Jordan Farm Equipment Market, By Drive Type |
|
6.2.1 Overview and Analysis |
|
6.2.2 Jordan Farm Equipment Market Revenues & Volume, By Two-wheel, 2018 - 2028F |
|
6.2.3 Jordan Farm Equipment Market Revenues & Volume, By Four-wheel, 2018 - 2028F |
|
6.3 Jordan Farm Equipment Market, By Function |
|
6.3.1 Overview and Analysis |
|
6.3.2 Jordan Farm Equipment Market Revenues & Volume, By Plowing & Cultivating, 2018 - 2028F |
|
6.3.3 Jordan Farm Equipment Market Revenues & Volume, By Sowing & Planting, 2018 - 2028F |
|
6.3.4 Jordan Farm Equipment Market Revenues & Volume, By Plant Protection & Fertilizing, 2018 - 2028F |
|
6.3.5 Jordan Farm Equipment Market Revenues & Volume, By Harvesting & Threshing, 2018 - 2028F |
|
6.3.6 Jordan Farm Equipment Market Revenues & Volume, By Others, 2018 - 2028F |
|
6.4 Jordan Farm Equipment Market, By Equipment Type |
|
6.4.1 Overview and Analysis |
|
6.4.2 Jordan Farm Equipment Market Revenues & Volume, By Tractors, 2018 - 2028F |
|
6.4.3 Jordan Farm Equipment Market Revenues & Volume, By Combines, 2018 - 2028F |
|
6.4.4 Jordan Farm Equipment Market Revenues & Volume, By Sprayers, 2018 - 2028F |
|
6.4.5 Jordan Farm Equipment Market Revenues & Volume, By Balers, 2018 - 2028F |
|
6.4.6 Jordan Farm Equipment Market Revenues & Volume, By Others, 2018 - 2028F |
|
7 Jordan Farm Equipment Market Import-Export Trade Statistics |
|
7.1 Jordan Farm Equipment Market Export to Major Countries |
|
7.2 Jordan Farm Equipment Market Imports from Major Countries |
|
8 Jordan Farm Equipment Market Key Performance Indicators |
| 8.1 Adoption rate of modern farm equipment among farmers. |
| 8.2 Rate of technological innovation in the farm equipment market. |
| 8.3 Efficiency and effectiveness of government policies and subsidies in promoting mechanization in agriculture. |
| 8.4 Number of farms transitioning from traditional to mechanized farming practices. |
|
9 Jordan Farm Equipment Market - Opportunity Assessment |
|
9.1 Jordan Farm Equipment Market Opportunity Assessment, By Power Output, 2021 & 2028F |
|
9.2 Jordan Farm Equipment Market Opportunity Assessment, By Drive Type, 2021 & 2028F |
|
9.3 Jordan Farm Equipment Market Opportunity Assessment, By Function, 2021 & 2028F |
|
9.4 Jordan Farm Equipment Market Opportunity Assessment, By Equipment Type, 2021 & 2028F |
|
10 Jordan Farm Equipment Market - Competitive Landscape |
|
10.1 Jordan Farm Equipment Market Revenue Share, By Companies, 2021 |
|
10.2 Jordan Farm Equipment Market Competitive Benchmarking, By Operating and Technical Parameters |
|
11 Company Profiles |
|
12 Recommendations |
|
13 Disclaimer |
Global Go To Market Strategy - 2030
Export potential enables firms to identify high-growth global markets with greater confidence by combining advanced trade intelligence with a structured quantitative methodology. The framework analyzes emerging demand trends and country-level import patterns while integrating macroeconomic and trade datasets such as GDP and population forecasts, bilateral import–export flows, tariff structures, elasticity differentials between developed and developing economies, geographic distance, and import demand projections. Using weighted trade values from 2020–2024 as the base period to project country-to-country export potential for 2030, these inputs are operationalized through calculated drivers such as gravity model parameters, tariff impact factors, and projected GDP per-capita growth. Through an analysis of hidden potentials, demand hotspots, and market conditions that are most favorable to success, this method enables firms to focus on target countries, maximize returns, and global expansion with data, backed by accuracy.
By factoring in the projected importer demand gap that is currently unmet and could be potential opportunity, it identifies the potential for the Exporter (Country) among 190 countries, against the general trade analysis, which identifies the biggest importer or exporter.
To discover high-growth global markets and optimize your business strategy:
Click Here
Pricing
- Single User License$ 1,995
- Department License$ 2,400
- Site License$ 3,120
- Global License$ 3,795

Leadership Perspectives from Industry Events
Search
Thought Leadership and Analyst Meet


Our Clients
6WResearch In News
- India Air Conditioner Market Set for Strong Rebound in 2026 After Weather-Led Correction and GST-Driven Recovery: 6Wresearch
- ADAS in India: How Automatic Emergency Braking, Blind Spot Detection & Driver Monitoring are Transforming Road Safety
- Doha a strategic location for EV manufacturing hub: IPA Qatar
- Demand for luxury TVs surging in the GCC, says Samsung
- Empowering Growth: The Thriving Journey of Bangladesh’s Cable Industry
- Demand for luxury TVs surging in the GCC, says Samsung
Latest Reports
- Nicaragua RPG Gaming Market (2026-2032)
- New Zealand RPG Gaming Market (2026-2032)
- Netherlands RPG Gaming Market (2026-2032)
- Nauru RPG Gaming Market (2026-2032)
- Namibia RPG Gaming Market (2026-2032)
- Mozambique RPG Gaming Market (2026-2032)
- Montenegro RPG Gaming Market (2026-2032)
- Mongolia RPG Gaming Market (2026-2032)
- Monaco RPG Gaming Market (2026-2032)
- Micronesia RPG Gaming Market (2026-2032)
Industry Events and Analyst Meet

HIMTEX 2026

India Refining Summit 2026

India EV Show 2026

EV tech India Expo 2026

Auto Tech Asia 2026
Whitepaper
- Middle East & Africa Commercial Security Market Click here to view more.
- Middle East & Africa Fire Safety Systems & Equipment Market Click here to view more.
- GCC Drone Market Click here to view more.
- Middle East Lighting Fixture Market Click here to view more.
- GCC Physical & Perimeter Security Market Click here to view more.