Jordan Urea Formaldehyde Market (2026-2032) Outlook | Industry, Analysis, Revenue, Size, Forecast, Share, Trends, Growth, Value & Companies
Market Forecast By End-users (Automobiles, Electrical Appliances, Home Appliances (Furniture), Agriculture, Others), By Applications (Adhesives, Particle board, Plywood, Roofing mats, Others) And Competitive Landscape
| Product Code: ETC093125 | Publication Date: Jun 2021 | Updated Date: Jun 2026 | Product Type: Report | |
| Publisher: 6Wresearch | Author: Ravi Bhandari | No. of Pages: 70 | No. of Figures: 35 | No. of Tables: 5 |
Jordan Urea Formaldehyde Market Size, Share & Growth Rate
The Jordan Urea Formaldehyde Market was estimated at USD 264 Million in 2025 and is projected to reach USD 364 Million by 2032, growing at a CAGR of 4.7% from 2026 to 2032. This growth trajectory is largely attributed to the expanding construction and furniture manufacturing industries in Jordan, both of which heavily rely on urea formaldehyde for their adhesive and molding requirements. Furthermore, the increasing demand for high-strength, cost-effective materials is driving the adoption of urea formaldehyde resins across various applications, thus propelling market growth.
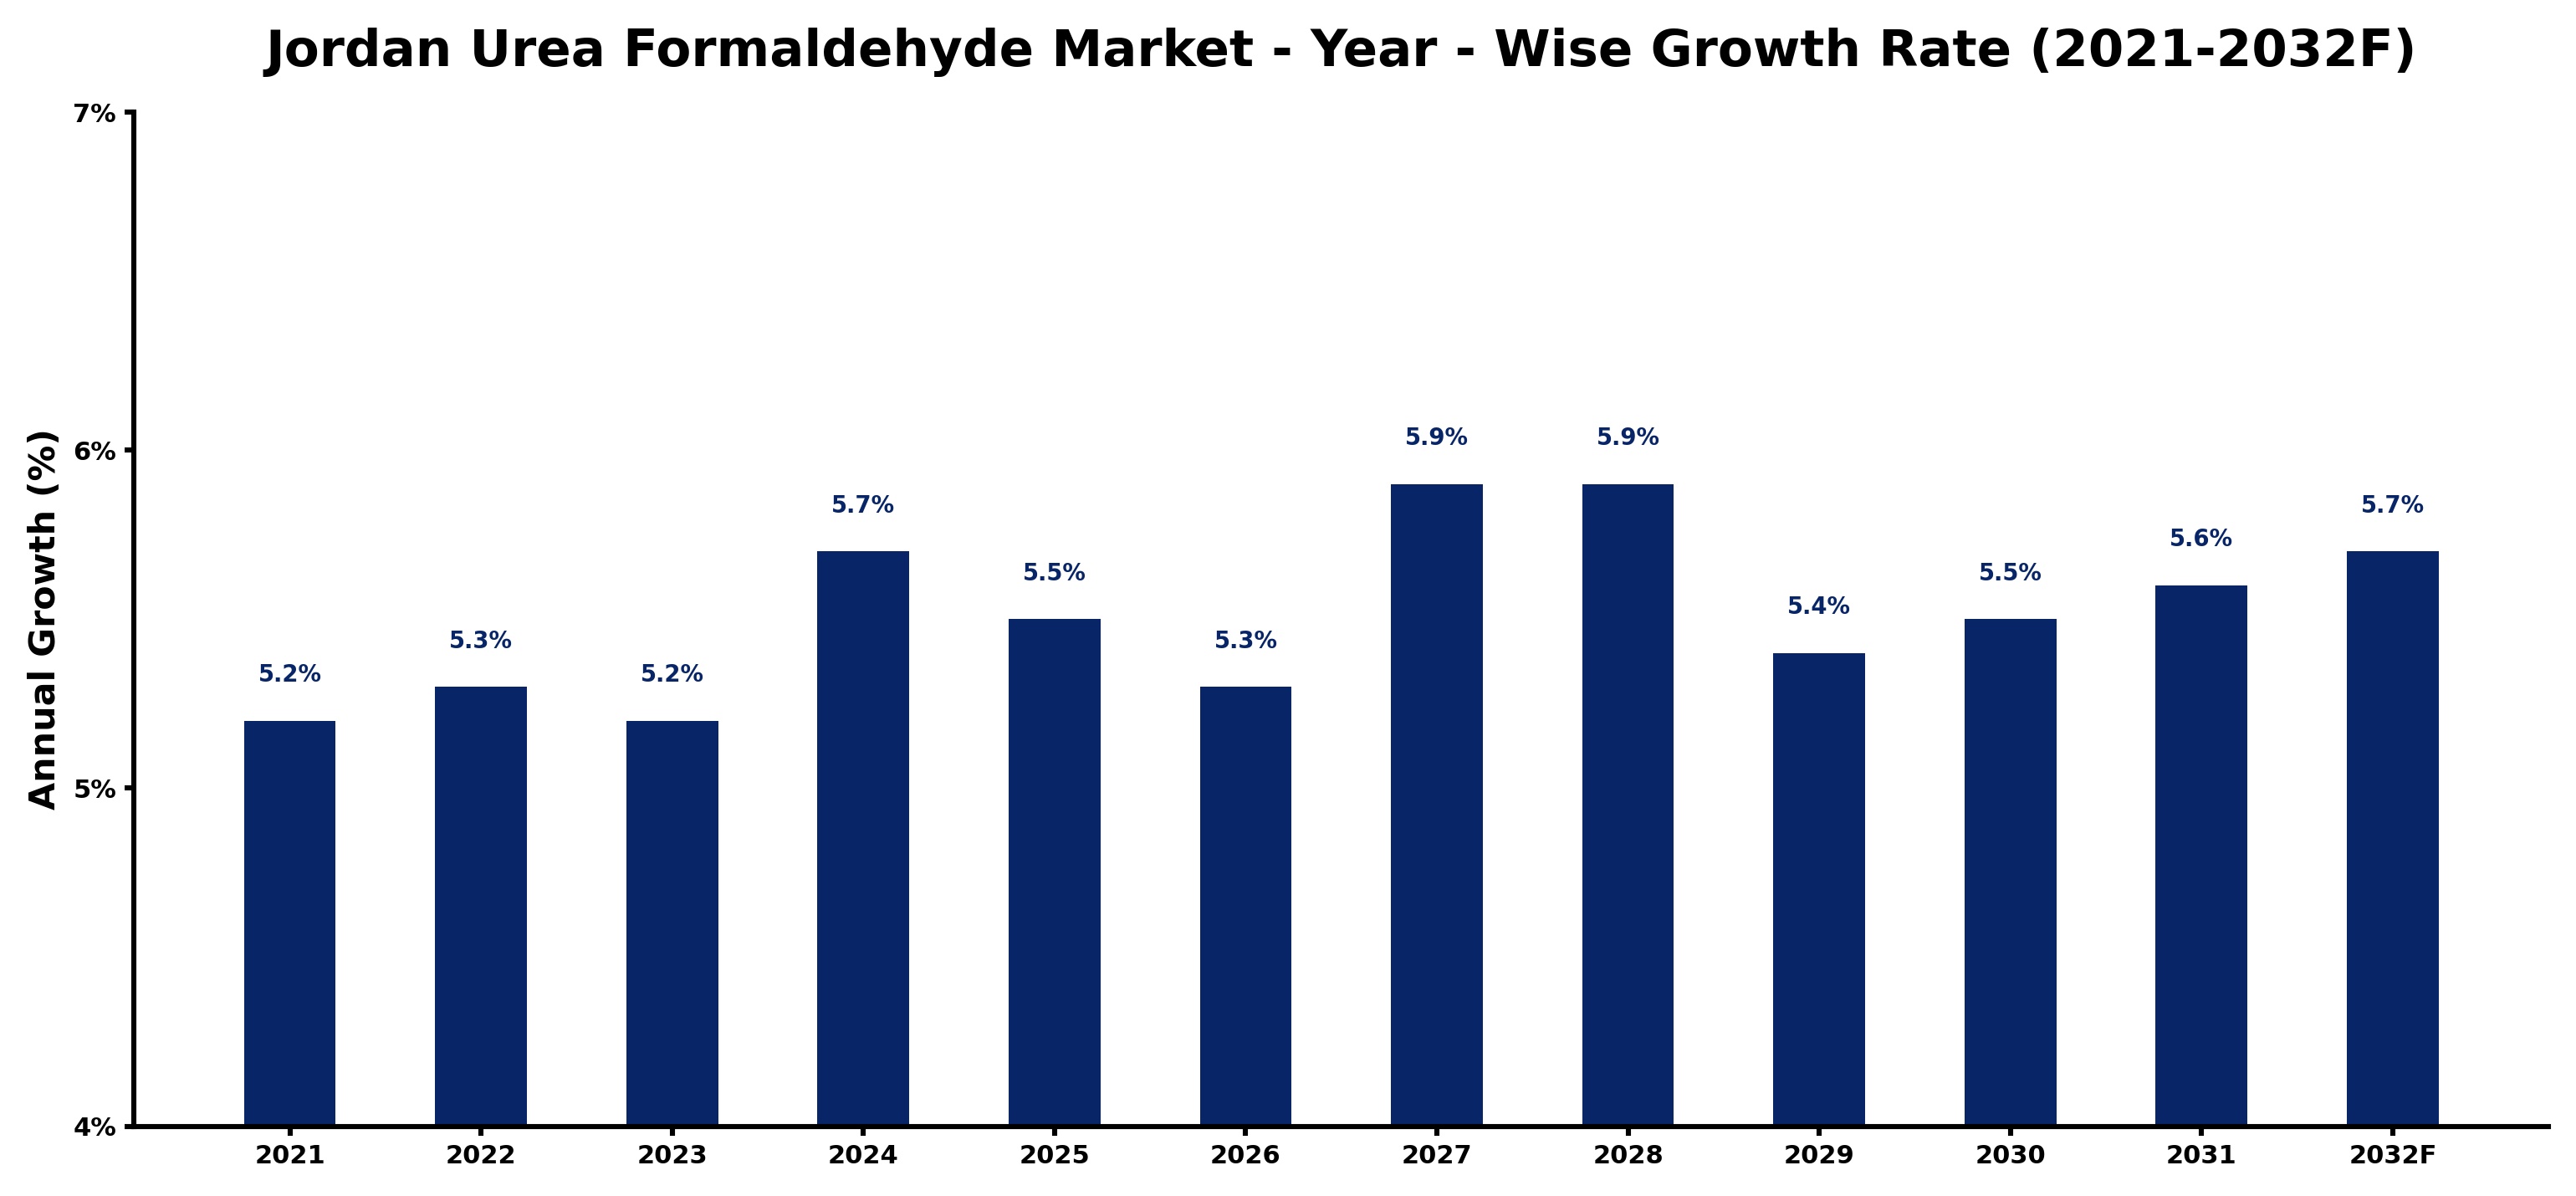
Jordan Urea Formaldehyde Market Growth Rate Analysis (2021-2032)
The Jordan Urea Formaldehyde market reflects a stable growth trend, with an average yearly increase around 5.2% to 5.3% from 2021 to 2023. This moderate expansion has been driven by rising demand in the construction and automotive sectors, where the compound's adhesive properties are highly valued. The market is anticipated to gain momentum, with projections indicating growth rates of 5.7% in 2024 and reaching 5.9% by 2027. Investments in infrastructure and heightened consumer demand for sustainable construction materials have further supported this trend. As digitalization continues to influence production processes and efficiency, the market is well-positioned for sustained developments in the coming years.
Jordan Urea Formaldehyde Market Year-wise Growth Rate and Key Drivers
This graph highlights how the Jordan Urea Formaldehyde Market has steadily grown over the past five years, supported by major growth factors.
The table below presents the year‑wise growth rates along with the key drivers influencing the market
| Year | Growth Rate | Major Drivers |
| 2021 | 5.2% | Manufacturers increase urea formaldehyde production to meet export demand |
| 2022 | 5.3% | Improved domestic construction projects boosted urea formaldehyde resin demand |
| 2023 | 5.2% | Domestic chemical producers boost urea formaldehyde capacity for export |
| 2024 | 5.7% | Technological advancements improved urea formaldehyde production efficiency |
| 2025 | 5.5% | Urea formaldehyde production scale up boosts domestic furniture manufacturing efficiency |
| 2026 | 5.3% | Modernized chemical plants boost urea formaldehyde production capabilities |
| 2027 | 5.9% | Strategic investments in chemical manufacturing enhanced urea formaldehyde production capacity |
| 2028 | 5.9% | Market diversification spurred investment in urea formaldehyde production facilities |
| 2029 | 5.4% | Urea formaldehyde manufacturers invest in higher efficiency production technologies |
| 2030 | 5.5% | Technological upgrades in manufacturing boost urea formaldehyde production capacity |
| 2031 | 5.6% | New plant installations boost local urea formaldehyde production capacity |
| 2032 | 5.7% | New urea formaldehyde plant installations boost local supply capabilities |
Note - Market size estimations and growth projections presented in this report are based on 6Wresearch’s advanced forecasting approach, validated with industry datasets as of June 2026.
Jordan Urea Formaldehyde Market Synopsis
In Jordan, the urea formaldehyde market plays a pivotal role in the production of adhesives and wood-based products. The favorable properties of urea formaldehyde resins, including strong bonding capabilities and affordability, contribute to their widespread acceptance in various manufacturing processes. This growing demand is particularly evident in the construction sector, where these resins are essential for creating durable building materials.
Additionally, the furniture industry’s emphasis on cost-effective materials presents a significant opportunity for growth. As manufacturers seek to balance quality with price, the preference for urea formaldehyde continues to rise. However, this burgeoning market must navigate the challenges posed by environmental regulations regarding formaldehyde emissions.
Jordan Urea Formaldehyde Market Key Takeaways
- The Jordan Urea Formaldehyde Market is on a growth path driven by the construction and furniture sectors.
- Product safety and environmental compliance are increasingly important due to regulatory pressures.
- Innovative formulations are emerging to address concerns about formaldehyde emissions.
- Government policies are incentivizing sustainable practices in resin production and sourcing.
- The market is evolving with a focus on eco-friendly manufacturing technologies.
Evaluation of Restraints in Jordan Urea Formaldehyde Market
The Jordan Urea Formaldehyde Market faces significant constraints, primarily stemming from environmental concerns associated with formaldehyde emissions. As awareness around indoor air quality grows, regulatory bodies are instituting stricter guidelines that manufacturers must comply with to ensure product safety. This challenge necessitates investments in research and development, compelling companies to innovate their resin formulations to minimize environmental impact while maintaining performance. Such transformations often require significant capital, which can be a deterrent for smaller players in the market.
Jordan Urea Formaldehyde Market Trends
A notable trend in the Jordan Urea Formaldehyde Market is the increasing integration of sustainable practices. Manufacturers are actively seeking eco-friendly alternatives and more efficient production processes that can reduce emissions. Concurrently, there is a push towards enhancing the performance characteristics of urea formaldehyde resins, such as increasing their water resistance and reducing curing times. This combination of sustainability and enhanced functionality reflects a broader global shift within the industry.
Jordan Urea Formaldehyde Market Opportunities
Significant opportunities lie ahead for the Jordan Urea Formaldehyde Market, especially in the realm of innovation. Companies that invest in developing advanced resin formulations that address both performance and environmental concerns stand to gain a competitive edge. Additionally, as the regional construction boom continues, there is a ripe opportunity for expansion into new product applications, such as eco-friendly adhesives and composite materials that incorporate urea formaldehyde.
Government Initiatives in the Jordan Urea Formaldehyde Market
The Jordanian government is actively involved in regulating the urea formaldehyde market to enhance product safety and minimize environmental impact. Policies are being developed that set stringent standards for emissions and product quality, ensuring that manufacturers adhere to both safety and performance benchmarks. Additionally, there are initiatives aimed at promoting research and development for alternative resin technologies, alongside incentives for adopting sustainable manufacturing practices.
Future Insights of the Jordan Urea Formaldehyde Market
Looking ahead to the period between 2026 and 2032, the Jordan Urea Formaldehyde Market is poised for notable advancements. As technology evolves, we anticipate a greater emphasis on sustainable practices, including the reduction of harmful emissions and the development of safer products. Moreover, the continuous growth of construction and furniture sectors will fuel demand, creating an environment ripe for innovation and investment in alternative formulations. Stakeholders who adapt swiftly to these changing dynamics will likely seize significant market opportunities.
Jordan Urea Formaldehyde Market Latest Developments (May 2025 - June 2026)
Recent developments in the Jordan Urea Formaldehyde Market indicate a marked shift towards sustainability. Manufacturers are actively exploring new eco-friendly resin formulations to mitigate formaldehyde emissions, aligning with global environmental trends. Concurrently, collaborations between industry stakeholders are emerging, aiming to enhance research into innovative production technologies that reduce costs and improve performance. These initiatives signal a robust response to both market demands and regulatory pressures.
Jordan Urea Formaldehyde Market - Key Attractiveness of the Report
- 10 Years of Market Numbers
- Historical Data Starting from 2022 to 2025
- Base Year: 2025
- Forecast Data until 2032
- Key Performance Indicators Impacting the Market
- Major Upcoming Developments and Projects
Key Highlights of the Report:
- Jordan Urea Formaldehyde Market Outlook
- Market Size of Jordan Urea Formaldehyde Market, 2025
- Forecast of Jordan Urea Formaldehyde Market, 2032
- Historical Data and Forecast of Jordan Urea Formaldehyde Revenues & Volume for the Period 2022-2032F
- Jordan Urea Formaldehyde Market Trend Evolution
- Jordan Urea Formaldehyde Market Drivers and Challenges
- Jordan Urea Formaldehyde Price Trends
- Jordan Urea Formaldehyde Porter's Five Forces
- Jordan Urea Formaldehyde Industry Life Cycle
- Historical Data and Forecast of Jordan Urea Formaldehyde Market Revenues & Volume By End-users for the Period 2022-2032F
- Historical Data and Forecast of Jordan Urea Formaldehyde Market Revenues & Volume By Automobiles for the Period 2022-2032F
- Historical Data and Forecast of Jordan Urea Formaldehyde Market Revenues & Volume By Electrical Appliances for the Period 2022-2032F
- Historical Data and Forecast of Jordan Urea Formaldehyde Market Revenues & Volume By Home Appliances (Furniture) for the Period 2022-2032F
- Historical Data and Forecast of Jordan Urea Formaldehyde Market Revenues & Volume By Agriculture for the Period 2022-2032F
- Historical Data and Forecast of Jordan Urea Formaldehyde Market Revenues & Volume By Others for the Period 2022-2032F
- Historical Data and Forecast of Jordan Urea Formaldehyde Market Revenues & Volume By Applications for the Period 2022-2032F
- Historical Data and Forecast of Jordan Urea Formaldehyde Market Revenues & Volume By Adhesives for the Period 2022-2032F
- Historical Data and Forecast of Jordan Urea Formaldehyde Market Revenues & Volume By Particle board for the Period 2022-2032F
- Historical Data and Forecast of Jordan Urea Formaldehyde Market Revenues & Volume By Plywood for the Period 2022-2032F
- Historical Data and Forecast of Jordan Urea Formaldehyde Market Revenues & Volume By Roofing mats for the Period 2022-2032F
- Historical Data and Forecast of Jordan Urea Formaldehyde Market Revenues & Volume By Others for the Period 2022-2032F
- Jordan Urea Formaldehyde Import Export Trade Statistics
- Market Opportunity Assessment By End-users
- Market Opportunity Assessment By Applications
- Jordan Urea Formaldehyde Top Companies Market Share
- Jordan Urea Formaldehyde Competitive Benchmarking By Technical and Operational Parameters
- Jordan Urea Formaldehyde Company Profiles
- Jordan Urea Formaldehyde Key Strategic Recommendations
Jordan Urea Formaldehyde Market - Frequently Asked Questions
The market is expected to grow from USD 264 Million in 2025 to USD 364 Million by 2032, with a CAGR of 4.7% from 2026 to 2032, indicating robust demand across various sectors.
The expanding construction and furniture industries are significant drivers of demand, as these sectors require high-strength adhesives and materials that urea formaldehyde can effectively provide.
Government initiatives are focused on ensuring product safety and regulating emissions, promoting research into alternative formulations, and incentivizing sustainable practices in production.
There's a clear trend towards sustainability, with manufacturers focusing on eco-friendly production processes and formulations that reduce formaldehyde emissions while maintaining high-performance standards.
Manufacturers must invest in innovative solutions to comply with increasing regulatory demands concerning emissions and product safety, which can require significant R&D investment.
Yes, opportunities exist, particularly for companies that can innovate around sustainable practices and alternative resins to capture the evolving market demand.
6Wresearch actively monitors the Jordan Urea Formaldehyde Market and publishes its comprehensive annual report, highlighting emerging trends, growth drivers, revenue analysis, and forecast outlook. Our insights help businesses to make data-backed strategic decisions with ongoing market dynamics. Our analysts track relevent industries related to the Jordan Urea Formaldehyde Market, allowing our clients with actionable intelligence and reliable forecasts tailored to emerging regional needs.
Yes, we provide customisation as per your requirements. To learn more, feel free to contact us on sales@6wresearch.com
1 Executive Summary |
2 Introduction |
2.1 Key Highlights of the Report |
2.2 Report Description |
2.3 Market Scope & Segmentation |
2.4 Research Methodology |
2.5 Assumptions |
3 Jordan Urea Formaldehyde Market Overview |
3.1 Jordan Country Macro Economic Indicators |
3.2 Jordan Urea Formaldehyde Market Revenues & Volume, 2022 & 2032F |
3.3 Jordan Urea Formaldehyde Market - Industry Life Cycle |
3.4 Jordan Urea Formaldehyde Market - Porter's Five Forces |
3.5 Jordan Urea Formaldehyde Market Revenues & Volume Share, By End-users, 2022 & 2032F |
3.6 Jordan Urea Formaldehyde Market Revenues & Volume Share, By Applications, 2022 & 2032F |
4 Jordan Urea Formaldehyde Market Dynamics |
4.1 Impact Analysis |
4.2 Market Drivers |
4.3 Market Restraints |
5 Jordan Urea Formaldehyde Market Trends |
6 Jordan Urea Formaldehyde Market, By Types |
6.1 Jordan Urea Formaldehyde Market, By End-users |
6.1.1 Overview and Analysis |
6.1.2 Jordan Urea Formaldehyde Market Revenues & Volume, By End-users, 2022-2032F |
6.1.3 Jordan Urea Formaldehyde Market Revenues & Volume, By Automobiles, 2022-2032F |
6.1.4 Jordan Urea Formaldehyde Market Revenues & Volume, By Electrical Appliances, 2022-2032F |
6.1.5 Jordan Urea Formaldehyde Market Revenues & Volume, By Home Appliances (Furniture), 2022-2032F |
6.1.6 Jordan Urea Formaldehyde Market Revenues & Volume, By Agriculture, 2022-2032F |
6.1.7 Jordan Urea Formaldehyde Market Revenues & Volume, By Others, 2022-2032F |
6.2 Jordan Urea Formaldehyde Market, By Applications |
6.2.1 Overview and Analysis |
6.2.2 Jordan Urea Formaldehyde Market Revenues & Volume, By Adhesives, 2022-2032F |
6.2.3 Jordan Urea Formaldehyde Market Revenues & Volume, By Particle board, 2022-2032F |
6.2.4 Jordan Urea Formaldehyde Market Revenues & Volume, By Plywood, 2022-2032F |
6.2.5 Jordan Urea Formaldehyde Market Revenues & Volume, By Roofing mats, 2022-2032F |
6.2.6 Jordan Urea Formaldehyde Market Revenues & Volume, By Others, 2022-2032F |
7 Jordan Urea Formaldehyde Market Import-Export Trade Statistics |
7.1 Jordan Urea Formaldehyde Market Export to Major Countries |
7.2 Jordan Urea Formaldehyde Market Imports from Major Countries |
8 Jordan Urea Formaldehyde Market Key Performance Indicators |
9 Jordan Urea Formaldehyde Market - Opportunity Assessment |
9.1 Jordan Urea Formaldehyde Market Opportunity Assessment, By End-users, 2022 & 2032F |
9.2 Jordan Urea Formaldehyde Market Opportunity Assessment, By Applications, 2022 & 2032F |
10 Jordan Urea Formaldehyde Market - Competitive Landscape |
10.1 Jordan Urea Formaldehyde Market Revenue Share, By Companies, 2025 |
10.2 Jordan Urea Formaldehyde Market Competitive Benchmarking, By Operating and Technical Parameters |
11 Company Profiles |
12 Recommendations |
13 Disclaimer |
Global Go To Market Strategy - 2030
Export potential enables firms to identify high-growth global markets with greater confidence by combining advanced trade intelligence with a structured quantitative methodology. The framework analyzes emerging demand trends and country-level import patterns while integrating macroeconomic and trade datasets such as GDP and population forecasts, bilateral import–export flows, tariff structures, elasticity differentials between developed and developing economies, geographic distance, and import demand projections. Using weighted trade values from 2020–2024 as the base period to project country-to-country export potential for 2030, these inputs are operationalized through calculated drivers such as gravity model parameters, tariff impact factors, and projected GDP per-capita growth. Through an analysis of hidden potentials, demand hotspots, and market conditions that are most favorable to success, this method enables firms to focus on target countries, maximize returns, and global expansion with data, backed by accuracy.
By factoring in the projected importer demand gap that is currently unmet and could be potential opportunity, it identifies the potential for the Exporter (Country) among 190 countries, against the general trade analysis, which identifies the biggest importer or exporter.
To discover high-growth global markets and optimize your business strategy:
Click Here
Pricing
- Single User License$ 1,995
- Department License$ 2,400
- Site License$ 3,120
- Global License$ 3,795

Leadership Perspectives from Industry Events
Search
Thought Leadership and Analyst Meet


Our Clients
6WResearch In News
- India Air Conditioner Market Set for Strong Rebound in 2026 After Weather-Led Correction and GST-Driven Recovery: 6Wresearch
- ADAS in India: How Automatic Emergency Braking, Blind Spot Detection & Driver Monitoring are Transforming Road Safety
- Doha a strategic location for EV manufacturing hub: IPA Qatar
- Demand for luxury TVs surging in the GCC, says Samsung
- Empowering Growth: The Thriving Journey of Bangladesh’s Cable Industry
- Demand for luxury TVs surging in the GCC, says Samsung
Latest Reports
- Poland Fire Protection Systems Market (2026-2032)
- Cape Verde Portable Hand-Thrown Extinguisher Market (2026-2032)
- Canada Portable Hand-Thrown Extinguisher Market (2026-2032)
- Cameroon Portable Hand-Thrown Extinguisher Market (2026-2032)
- Burundi Portable Hand-Thrown Extinguisher Market (2026-2032)
- Burkina Faso Portable Hand-Thrown Extinguisher Market (2026-2032)
- Bulgaria Portable Hand-Thrown Extinguisher Market (2026-2032)
- Brunei Portable Hand-Thrown Extinguisher Market (2026-2032)
- Botswana Portable Hand-Thrown Extinguisher Market (2026-2032)
- Bosnia and Herzegovina Portable Hand-Thrown Extinguisher Market (2026-2032)
Industry Events and Analyst Meet

HIMTEX 2026

India Refining Summit 2026

India EV Show 2026

EV tech India Expo 2026

Auto Tech Asia 2026
Whitepaper
- Middle East & Africa Commercial Security Market Click here to view more.
- Middle East & Africa Fire Safety Systems & Equipment Market Click here to view more.
- GCC Drone Market Click here to view more.
- Middle East Lighting Fixture Market Click here to view more.
- GCC Physical & Perimeter Security Market Click here to view more.