Jordan Water Treatment Market (2026-2032) | Analysis, Growth, Share, Trends, Size, Industry, Forecast, Outlook, Companies, Revenue, COVID-19 IMPACT & Value
Market Forecast By Types (Distillation, Filtration, Disinfection, Reverse Osmosis), By Applications (Residential, Non-Residential), By Installations (Point Of Use , Point Of Entry) And Competitive Landscape
| Product Code: ETC007686 | Publication Date: Sep 2020 | Updated Date: Jun 2026 | Product Type: Report | |
| Publisher: 6Wresearch | Author: Ravi Bhandari | No. of Pages: 70 | No. of Figures: 35 | No. of Tables: 5 |
Jordan Water Treatment Market Summary
The jordan water treatment market was estimated at USD 255 Million in 2025 and is projected to reach USD 336 Million by 2032, growing at a CAGR of 4.8% from 2026 to 2032.
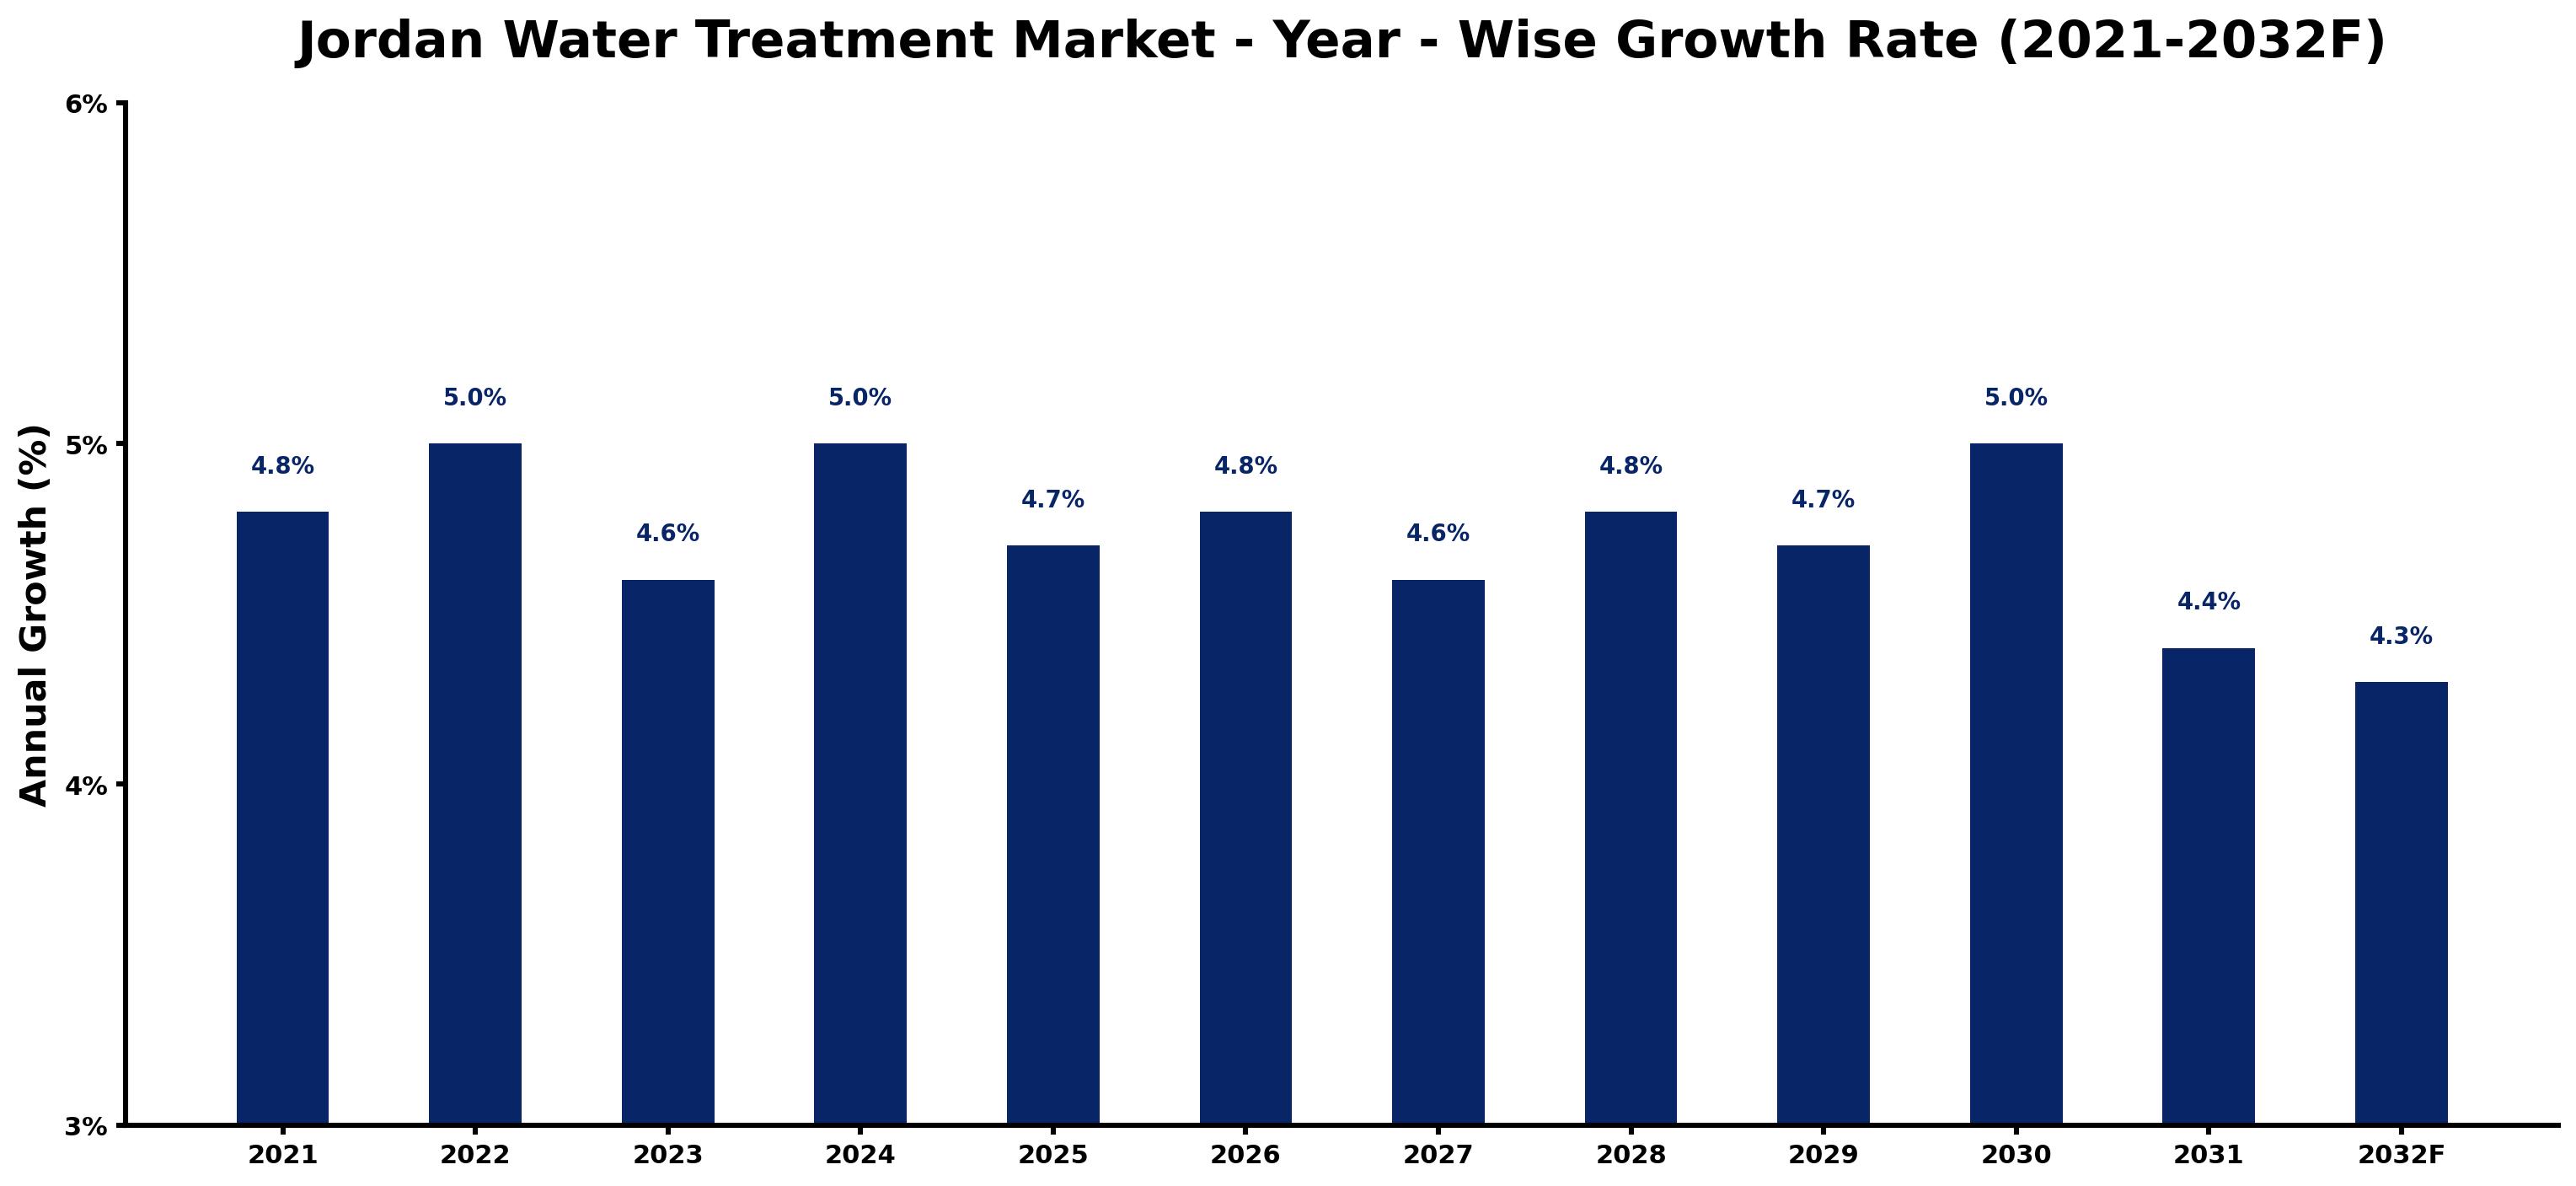
Jordan Water Treatment Market Growth Rate Analysis (2021-2032)
The Jordan Water Treatment market has demonstrated steady growth, with a notable increase of 4.8% in 2021 and 5.0% in 2022, illustrating a growing emphasis on sustainable water management solutions. Fluctuations in growth rates, such as the slight decrease to 4.6% in 2023, can be attributed to shifts in consumer demand and infrastructural challenges. However, the market rebounded to align with a 5.0% growth in 2024, fueled by significant investments in technology and infrastructure aimed at enhancing water quality. As the country continues to face water scarcity issues, annual growth rates hover around 4.6% to 5.0% through 2032, reflecting ongoing policy support and an urgent demand for innovative treatment solutions.
Jordan Water Treatment Market Year-wise Growth Rate and Key Drivers
This graph highlights how the Jordan Water Treatment Market has steadily grown over the past five years, supported by major growth factors.
The table below presents the year wise growth rates along with the key drivers influencing the market
| Year | Growth Rate | Major Drivers |
| 2021 | 4.8% | Water scarcity issues prompted significant investments in innovative treatment technologies. |
| 2022 | 5.0% | Local companies began forming partnerships with international water technology firms for expertise. |
| 2023 | 4.6% | Increased public awareness about water quality influenced consumer preferences toward advanced solutions. |
| 2024 | 5.0% | Construction projects for new housing developments required efficient water management systems. |
| 2025 | 4.7% | Innovative desalination methods became more viable due to regional climate challenges. |
| 2026 | 4.8% | Public-private partnerships emerged to address aging infrastructure and enhance service delivery. |
| 2027 | 4.6% | Environmental sustainability considerations led to a focus on eco-friendly treatment options. |
| 2028 | 4.8% | Significant foreign direct investment targeted the water treatment sector, boosting local infrastructure. |
| 2029 | 4.7% | Technological advancements in filtration increased efficiency and reduced operational costs. |
| 2030 | 5.0% | Community initiatives emphasized public engagement in water conservation and treatment awareness. |
| 2031 | 4.4% | A competitive market landscape encouraged continuous innovation and customer-centric offerings. |
| 2032 | 4.3% | Regional collaboration with neighboring countries improved cross-border water management strategies. |
Note - Market size estimations and growth projections presented in this report are based on 6Wresearch's advanced forecasting approach, validated with industry datasets as of June 2026.
Jordan Water Treatment Market Synopsis
The Jordan Water Treatment Market is projected to reach 4.8% and witness significant growth during the forecast period (2026-2032). This market encompasses an array of technologies and services designed to enhance water quality and ensure safety for consumption and industrial utilization. With the escalating concerns regarding pollution and water scarcity, the demand for effective solutions such as purification, desalination, and wastewater treatment is on the rise. This increasing need provides numerous opportunities for organizations to supply comprehensive water treatment solutions that align with regulatory frameworks and environmental goals in Jordan.
Jordan Water Treatment Market Growth Drivers
A multitude of factors is driving the growth of the Jordan Water Treatment Market. Key drivers include:
- Emerging water scarcity issues necessitating the implementation of efficient water management strategies. As demand for freshwater resources markedly increases, the urgency for innovative treatment solutions becomes evident.
- Stringent regulations focused on improving water quality and safety are compelling industries and governmental bodies to invest in advanced water treatment technologies.
- Public awareness regarding health risks associated with contaminated water sources is prompting consumers and businesses alike to seek reliable purification and treatment solutions.
- Technological advancements in water treatment processes, including membrane filtration and ion exchange technologies, are enhancing the efficiency and cost-effectiveness of treatment systems.
- Increasing public and private sector investments in water treatment infrastructure are bolstering the market's capability to meet growing demand and improve service delivery.
Jordan Water Treatment Market Challenges and Restraints
Despite its growth potential, the Jordan Water Treatment Market faces several challenges that could impede progress. These challenges include:
- Funding constraints are often a significant barrier, as the development and maintenance of water treatment infrastructure necessitate substantial investment from government agencies and utilities.
- Regulatory compliance adds complexity to water treatment processes, requiring constant adjustments to adhere to evolving quality standards and pollution control measures.
- The challenge of addressing emerging contaminants, such as microplastics and pharmaceuticals, necessitates ongoing research and innovation in water treatment technologies.
- Public sector administrative inefficiencies can hinder the timely implementation of essential projects, impacting the overall efficacy of water treatment initiatives.
- Environmental changes, including climate extremes, pose additional obstacles to sustainable water management and treatment efforts.
Jordan Water Treatment Market Government Investment and Initiatives
Government policy plays a crucial role in shaping the landscape of the Jordan Water Treatment Market. Various initiatives and investments are aimed at enhancing access to clean water for all citizens. Key government actions include:
- Establishment of stringent quality standards for water treatment processes to ensure safe and potable water provision across the country.
- Incentives for adopting advanced treatment technologies, facilitating the modernization of existing water treatment facilities.
- Public-private partnerships are being promoted to drive infrastructure development, thereby enhancing the efficiency and effectiveness of water services.
- Funding aimed at research and development in innovative water treatment technologies helps cultivate a more adaptive response to emerging water challenges.
- Regular public awareness campaigns underscore the importance of water treatment, reinforcing community engagement in sustainable practices.
Jordan Water Treatment Market Latest Developments (May 2025 - June 2026)
In the period from May 2025 to June 2026, several developments have shaped the Jordan Water Treatment Market. These include advancements in technology that enhance the efficiency of water purification processes, and increased collaboration between government entities and private sector innovators. The government has redoubled its commitment to improving existing infrastructure, with a focus on sustainability and resilience against climate change impacts. Ongoing initiatives to enhance public awareness regarding water conservation and quality have also gained momentum, fostering a culture of responsible water usage among citizens. Furthermore, significant investments are being channeled into research aimed at developing new treatment methods to address emerging contaminants, reflecting the dynamic nature of this evolving market.
Jordan Water Treatment Market - Key Attractiveness of the Report
- 10 Years of Market Numbers
- Historical Data Starting from 2022 to 2025
- Base Year: 2025
- Forecast Data until 2032
- Key Performance Indicators Impacting the Market
- Major Upcoming Developments and Projects
Key Highlights of the Report:
- Jordan Water Treatment Market Outlook
- Market Size of Jordan Water Treatment Market, 2025
- Forecast of Jordan Water Treatment Market, 2032
- Historical Data and Forecast of Jordan Water Treatment Revenues & Volume for the Period 2022-2032F
- Jordan Water Treatment Market Trend Evolution
- Jordan Water Treatment Market Drivers and Challenges
- Jordan Water Treatment Price Trends
- Jordan Water Treatment Porter's Five Forces
- Jordan Water Treatment Industry Life Cycle
- Historical Data and Forecast of Jordan Water Treatment Market Revenues & Volume By Types for the Period 2022-2032F
- Historical Data and Forecast of Jordan Water Treatment Market Revenues & Volume By Distillation? for the Period 2022-2032F
- Historical Data and Forecast of Jordan Water Treatment Market Revenues & Volume By Filtration? for the Period 2022-2032F
- Historical Data and Forecast of Jordan Water Treatment Market Revenues & Volume By Disinfection for the Period 2022-2032F
- Historical Data and Forecast of Jordan Water Treatment Market Revenues & Volume By Reverse Osmosis for the Period 2022-2032F
- Historical Data and Forecast of Jordan Water Treatment Market Revenues & Volume By Applications for the Period 2022-2032F
- Historical Data and Forecast of Jordan Water Treatment Market Revenues & Volume By Residential? for the Period 2022-2032F
- Historical Data and Forecast of Jordan Water Treatment Market Revenues & Volume By Non-Residential? for the Period 2022-2032F
- Historical Data and Forecast of Jordan Water Treatment Market Revenues & Volume By Installations for the Period 2022-2032F
- Historical Data and Forecast of Jordan Water Treatment Market Revenues & Volume By Point Of Use for the Period 2022-2032F
- Historical Data and Forecast of Jordan Water Treatment Market Revenues & Volume By Point Of Entry for the Period 2022-2032F
- Jordan Water Treatment Import Export Trade Statistics
- Market Opportunity Assessment By Types
- Market Opportunity Assessment By Applications
- Market Opportunity Assessment By Installations
- Jordan Water Treatment Top Companies Market Share
- Jordan Water Treatment Competitive Benchmarking By Technical and Operational Parameters
- Jordan Water Treatment Company Profiles
- Jordan Water Treatment Key Strategic Recommendations
Frequently Asked Questions About the Market Study (FAQs):
The growth is driven by increasing water scarcity, stringent regulations, rising public awareness, advancements in technology, and investments in infrastructure.
The market faces challenges such as funding constraints, regulatory compliance complexities, emerging contaminants, administrative inefficiencies, and environmental changes.
The government is implementing stringent standards, providing incentives for technology adoption, promoting public-private partnerships, funding R&D, and conducting public awareness campaigns.
Key developments include technological advancements, enhanced government commitment to infrastructure improvement, increased private sector collaboration, and a focus on public education regarding water quality.
6Wresearch actively monitors the Jordan Water Treatment Market and publishes its comprehensive annual report, highlighting emerging trends, growth drivers, revenue analysis, and forecast outlook. Our insights help businesses to make data-backed strategic decisions with ongoing market dynamics. Our analysts track relevent industries related to the Jordan Water Treatment Market, allowing our clients with actionable intelligence and reliable forecasts tailored to emerging regional needs.
Yes, we provide customisation as per your requirements. To learn more, feel free to contact us on sales@6wresearch.com
1 Executive Summary |
2 Introduction |
2.1 Key Highlights of the Report |
2.2 Report Description |
2.3 Market Scope & Segmentation |
2.4 Research Methodology |
2.5 Assumptions |
3 Jordan Water Treatment Market Overview |
3.1 Jordan Country Macro Economic Indicators |
3.2 Jordan Water Treatment Market Revenues & Volume, 2022 & 2032F |
3.3 Jordan Water Treatment Market - Industry Life Cycle |
3.4 Jordan Water Treatment Market - Porter's Five Forces |
3.5 Jordan Water Treatment Market Revenues & Volume Share, By Types, 2022 & 2032F |
3.6 Jordan Water Treatment Market Revenues & Volume Share, By Applications, 2022 & 2032F |
3.7 Jordan Water Treatment Market Revenues & Volume Share, By Installations, 2022 & 2032F |
4 Jordan Water Treatment Market Dynamics |
4.1 Impact Analysis |
4.2 Market Drivers |
4.3 Market Restraints |
5 Jordan Water Treatment Market Trends |
6 Jordan Water Treatment Market, By Types |
6.1 Jordan Water Treatment Market, By Types |
6.1.1 Overview and Analysis |
6.1.2 Jordan Water Treatment Market Revenues & Volume, By Types, 2022-2032F |
6.1.3 Jordan Water Treatment Market Revenues & Volume, By Distillation , 2022-2032F |
6.1.4 Jordan Water Treatment Market Revenues & Volume, By Filtration , 2022-2032F |
6.1.5 Jordan Water Treatment Market Revenues & Volume, By Disinfection, 2022-2032F |
6.1.6 Jordan Water Treatment Market Revenues & Volume, By Reverse Osmosis, 2022-2032F |
6.2 Jordan Water Treatment Market, By Applications |
6.2.1 Overview and Analysis |
6.2.2 Jordan Water Treatment Market Revenues & Volume, By Residential , 2022-2032F |
6.2.3 Jordan Water Treatment Market Revenues & Volume, By Non-Residential , 2022-2032F |
6.3 Jordan Water Treatment Market, By Installations |
6.3.1 Overview and Analysis |
6.3.2 Jordan Water Treatment Market Revenues & Volume, By Point Of Use , 2022-2032F |
6.3.3 Jordan Water Treatment Market Revenues & Volume, By Point Of Entry, 2022-2032F |
7 Jordan Water Treatment Market Import-Export Trade Statistics |
7.1 Jordan Water Treatment Market Export to Major Countries |
7.2 Jordan Water Treatment Market Imports from Major Countries |
8 Jordan Water Treatment Market Key Performance Indicators |
9 Jordan Water Treatment Market - Opportunity Assessment |
9.1 Jordan Water Treatment Market Opportunity Assessment, By Types, 2022 & 2032F |
9.2 Jordan Water Treatment Market Opportunity Assessment, By Applications, 2022 & 2032F |
9.3 Jordan Water Treatment Market Opportunity Assessment, By Installations, 2022 & 2032F |
10 Jordan Water Treatment Market - Competitive Landscape |
10.1 Jordan Water Treatment Market Revenue Share, By Companies, 2025 |
10.2 Jordan Water Treatment Market Competitive Benchmarking, By Operating and Technical Parameters |
11 Company Profiles |
12 Recommendations |
13 Disclaimer |
Global Go To Market Strategy - 2030
Export potential enables firms to identify high-growth global markets with greater confidence by combining advanced trade intelligence with a structured quantitative methodology. The framework analyzes emerging demand trends and country-level import patterns while integrating macroeconomic and trade datasets such as GDP and population forecasts, bilateral import–export flows, tariff structures, elasticity differentials between developed and developing economies, geographic distance, and import demand projections. Using weighted trade values from 2020–2024 as the base period to project country-to-country export potential for 2030, these inputs are operationalized through calculated drivers such as gravity model parameters, tariff impact factors, and projected GDP per-capita growth. Through an analysis of hidden potentials, demand hotspots, and market conditions that are most favorable to success, this method enables firms to focus on target countries, maximize returns, and global expansion with data, backed by accuracy.
By factoring in the projected importer demand gap that is currently unmet and could be potential opportunity, it identifies the potential for the Exporter (Country) among 190 countries, against the general trade analysis, which identifies the biggest importer or exporter.
To discover high-growth global markets and optimize your business strategy:
Click Here
Pricing
- Single User License$ 1,995
- Department License$ 2,400
- Site License$ 3,120
- Global License$ 3,795

Leadership Perspectives from Industry Events
Search
Thought Leadership and Analyst Meet


Our Clients
6WResearch In News
- India Air Conditioner Market Set for Strong Rebound in 2026 After Weather-Led Correction and GST-Driven Recovery: 6Wresearch
- ADAS in India: How Automatic Emergency Braking, Blind Spot Detection & Driver Monitoring are Transforming Road Safety
- Doha a strategic location for EV manufacturing hub: IPA Qatar
- Demand for luxury TVs surging in the GCC, says Samsung
- Empowering Growth: The Thriving Journey of Bangladesh’s Cable Industry
- Demand for luxury TVs surging in the GCC, says Samsung
Latest Reports
- Nicaragua RPG Gaming Market (2026-2032)
- New Zealand RPG Gaming Market (2026-2032)
- Netherlands RPG Gaming Market (2026-2032)
- Nauru RPG Gaming Market (2026-2032)
- Namibia RPG Gaming Market (2026-2032)
- Mozambique RPG Gaming Market (2026-2032)
- Montenegro RPG Gaming Market (2026-2032)
- Mongolia RPG Gaming Market (2026-2032)
- Monaco RPG Gaming Market (2026-2032)
- Micronesia RPG Gaming Market (2026-2032)
Industry Events and Analyst Meet

HIMTEX 2026

India Refining Summit 2026

India EV Show 2026

EV tech India Expo 2026

Auto Tech Asia 2026
Whitepaper
- Middle East & Africa Commercial Security Market Click here to view more.
- Middle East & Africa Fire Safety Systems & Equipment Market Click here to view more.
- GCC Drone Market Click here to view more.
- Middle East Lighting Fixture Market Click here to view more.
- GCC Physical & Perimeter Security Market Click here to view more.