Kazakhstan Energy Saving & Fluorescent Market (2026-2032) | Outlook, Growth, Trends, Forecast, Analysis, Companies, Share, Value, Size, Revenue & Industry
Market Forecast By Sources (High-Intensity Discharge Lamps (HID), Linear Fluorescent Lamps (LFL), Light Emitting Diodes (LED)), By Applications (Commercial, Residential, Government) And Competitive Landscape
| Product Code: ETC005118 | Publication Date: Sep 2020 | Updated Date: Jun 2026 | Product Type: Report | |
| Publisher: 6Wresearch | Author: Ravi Bhandari | No. of Pages: 70 | No. of Figures: 35 | No. of Tables: 5 |
Kazakhstan Energy Saving & Fluorescent Market Summary
The kazakhstan energy saving & fluorescent market was estimated at USD 263 Million in 2025 and is projected to reach USD 353 Million by 2032, growing at a CAGR of 5.1% from 2026 to 2032.
Kazakhstan Energy Saving & Fluorescent Market Growth Rate Analysis (2021-2032)
The Kazakhstan Energy Saving & Fluorescent Market has seen a stable growth trajectory, with annual growth rates of 4.9% in 2021, increasing to 5.2% in 2022, and peaking at 5.3% in 2023. This growth can be attributed to rising consumer demand for energy-efficient solutions and government policies promoting energy conservation. While growth rates fluctuate slightly over the subsequent years—declining to 4.9% in 2025 before recovering to 5.4% in 2028—the overall trend remains positive. Investments in infrastructure upgrades and advancements in lighting technology are also critical factors driving the market forward. As Kazakhstan transitions towards sustainable energy practices, this sector is likely to play a pivotal role in its economic landscape.
Kazakhstan Energy Saving & Fluorescent Market Year-wise Growth Rate and Key Drivers
This graph highlights how the Kazakhstan Energy Saving & Fluorescent Market has steadily grown over the past five years, supported by major growth factors.
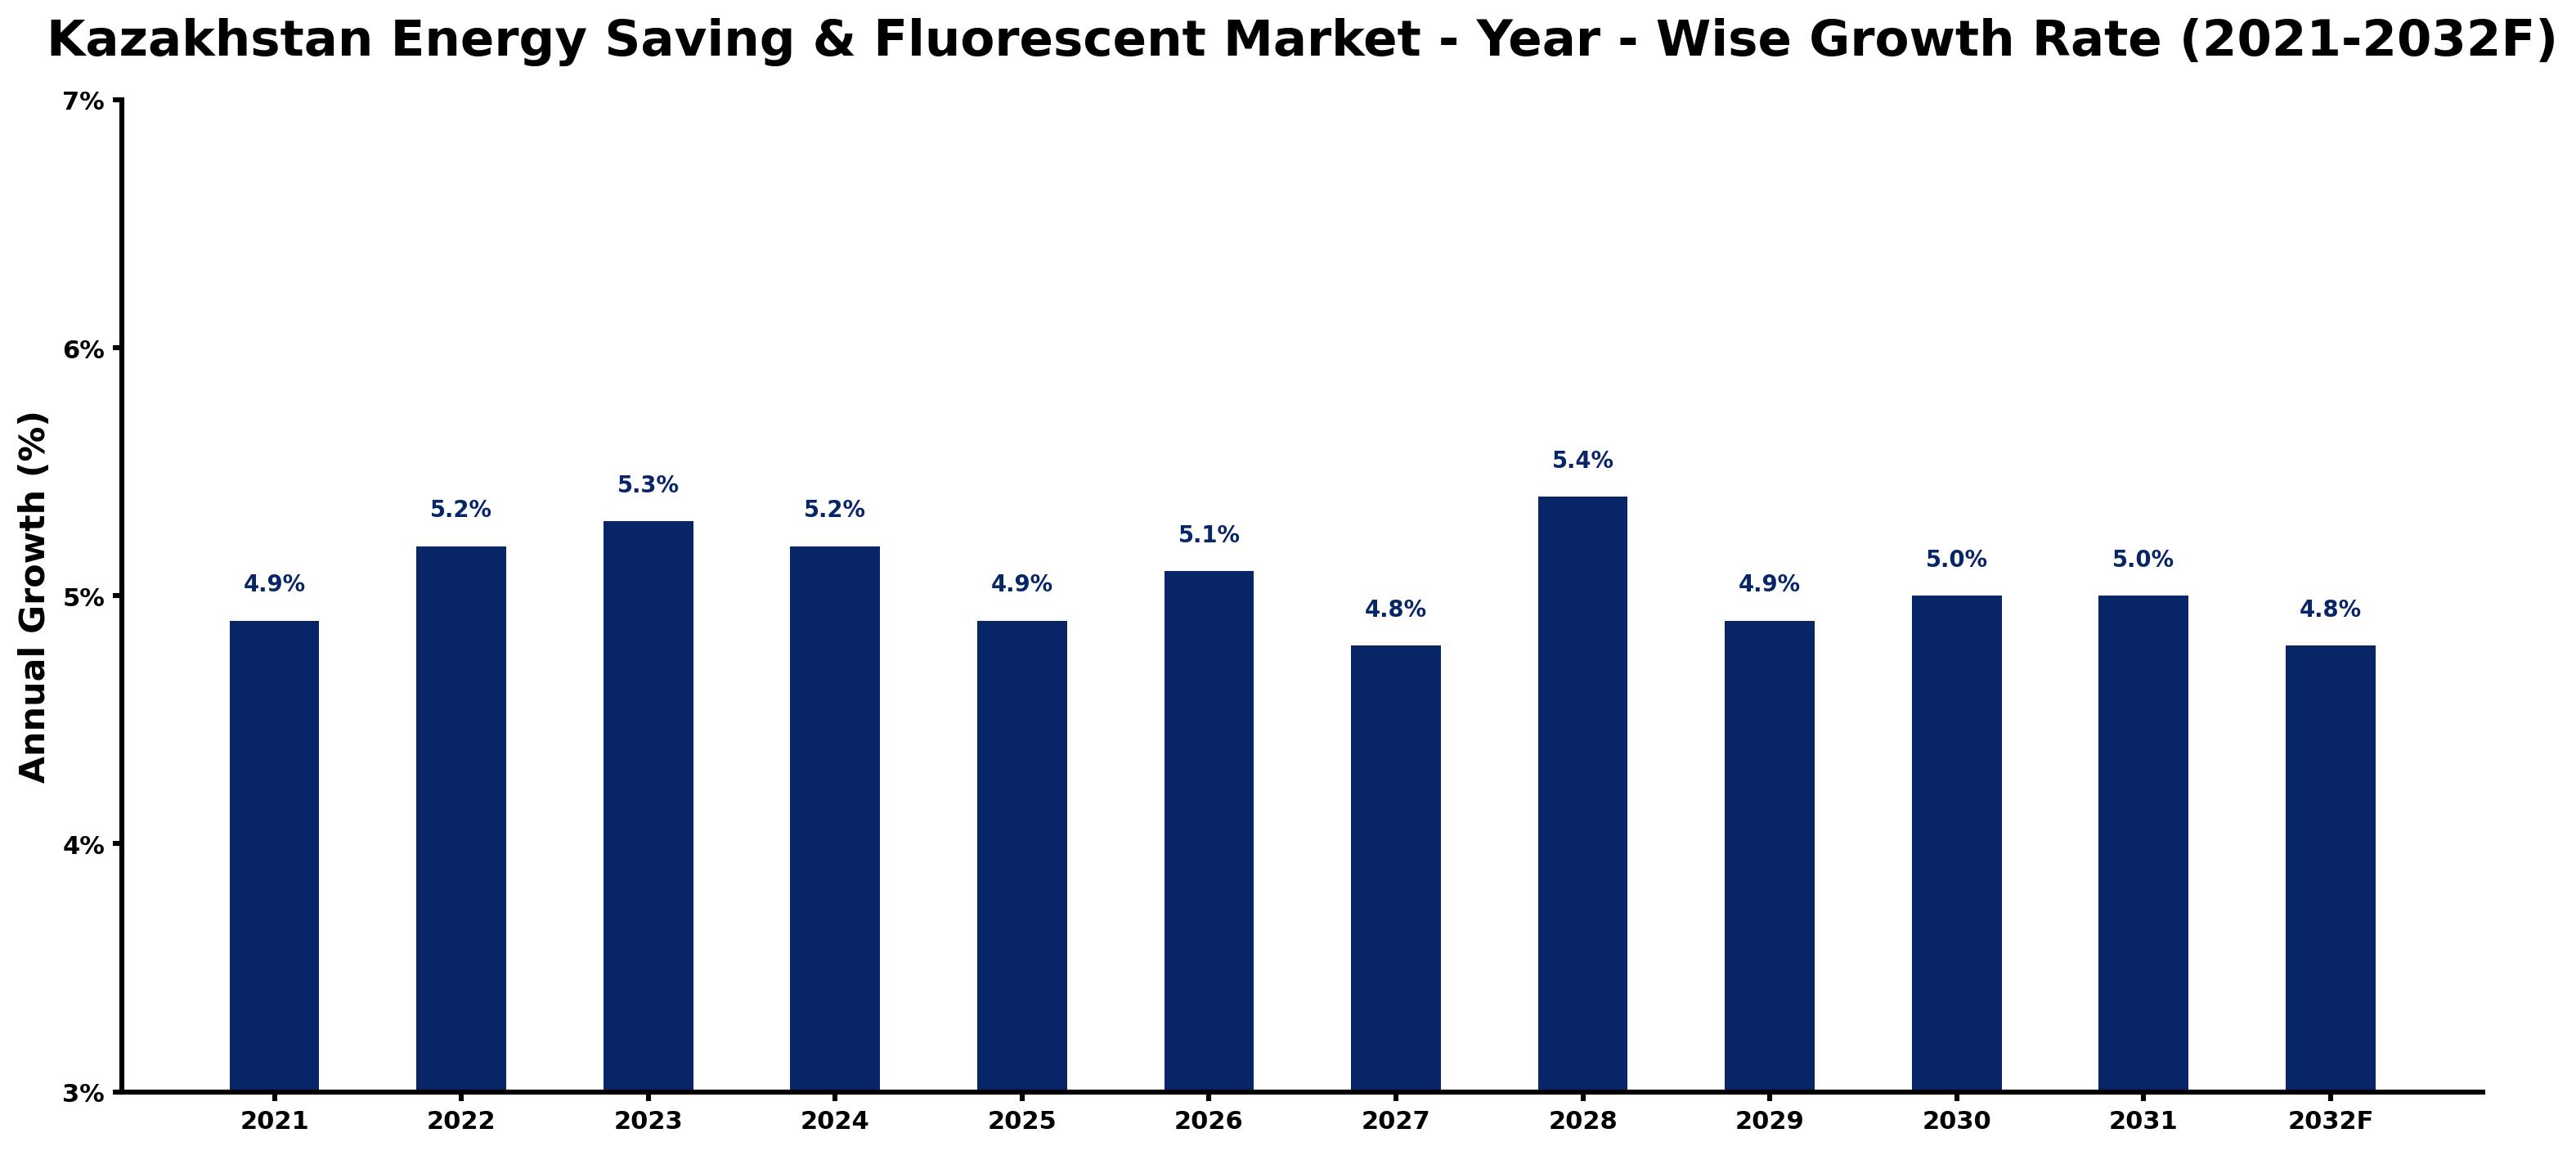
The table below presents the year wise growth rates along with the key drivers influencing the market
| Year | Growth Rate | Major Drivers |
| 2021 | 4.9% | Post-pandemic recovery efforts triggered investments in energy-efficient technologies across Kazakhstan. |
| 2022 | 5.2% | Local manufacturers began producing energy-saving bulbs to meet increasing consumer expectations. |
| 2023 | 5.3% | Competitive pricing strategies from suppliers improved access to energy-efficient lighting solutions. |
| 2024 | 5.2% | Infrastructure upgrades in urban areas created demand for modernized lighting systems. |
| 2025 | 4.9% | Public awareness about energy conservation influenced consumer choices towards fluorescent alternatives. |
| 2026 | 5.1% | Growing emphasis on sustainability led corporations to seek energy-efficient lighting solutions. |
| 2027 | 4.8% | Technological innovations in fluorescent lighting increased efficiency and reduced operational costs. |
| 2028 | 5.4% | Corporate social responsibility initiatives pushed companies to adopt greener energy practices. |
| 2029 | 4.9% | Expansion of commercial spaces prompted greater investments in energy-saving technologies. |
| 2030 | 5.0% | Regional collaborations focused on energy efficiency set benchmarks for industry standards. |
| 2031 | 5.0% | Urbanization trends drove the need for sustainable energy solutions in city planning. |
| 2032 | 4.8% | Technological convergence enabled smarter energy management systems in urban environments. |
Note - Market size estimations and growth projections presented in this report are based on 6Wresearch's advanced forecasting approach, validated with industry datasets as of June 2026.
Key Highlights of the Report:
- Kazakhstan Energy Saving & Fluorescent Market Outlook
- Market Size of Kazakhstan Energy Saving & Fluorescent Market, 2025
- Forecast of Kazakhstan Energy Saving & Fluorescent Market, 2032F
- Historical Data and Forecast of Kazakhstan Energy Saving & Fluorescent Revenues & Volume for the Period 2022-2032F
- Kazakhstan Energy Saving & Fluorescent Market Trend Evolution
- Kazakhstan Energy Saving & Fluorescent Market Drivers and Challenges
- Kazakhstan Energy Saving & Fluorescent Price Trends
- Kazakhstan Energy Saving & Fluorescent Porter's Five Forces
- Kazakhstan Energy Saving & Fluorescent Industry Life Cycle
- Historical Data and Forecast of Kazakhstan Energy Saving & Fluorescent Market Revenues & Volume By Sources for the Period 2022-2032F
- Historical Data and Forecast of Kazakhstan Energy Saving & Fluorescent Market Revenues & Volume By High-Intensity Discharge Lamps (HID) for the Period 2022-2032F
- Historical Data and Forecast of Kazakhstan Energy Saving & Fluorescent Market Revenues & Volume By Linear Fluorescent Lamps (LFL) for the Period 2022-2032F
- Historical Data and Forecast of Kazakhstan Energy Saving & Fluorescent Market Revenues & Volume By Light Emitting Diodes (LED) for the Period 2022-2032F
- Historical Data and Forecast of Kazakhstan Energy Saving & Fluorescent Market Revenues & Volume By Applications for the Period 2022-2032F
- Historical Data and Forecast of Kazakhstan Energy Saving & Fluorescent Market Revenues & Volume By Commercial for the Period 2022-2032F
- Historical Data and Forecast of Kazakhstan Energy Saving & Fluorescent Market Revenues & Volume By Residential for the Period 2022-2032F
- Historical Data and Forecast of Kazakhstan Energy Saving & Fluorescent Market Revenues & Volume By Government for the Period 2022-2032F
- Kazakhstan Energy Saving & Fluorescent Import Export Trade Statistics
- Market Opportunity Assessment By Sources
- Market Opportunity Assessment By Applications
- Kazakhstan Energy Saving & Fluorescent Top Companies Market Share
- Kazakhstan Energy Saving & Fluorescent Competitive Benchmarking By Technical and Operational Parameters
- Kazakhstan Energy Saving & Fluorescent Company Profiles
- Kazakhstan Energy Saving & Fluorescent Key Strategic Recommendations
Frequently Asked Questions About the Market Study (FAQs):
6Wresearch actively monitors the Kazakhstan Energy Saving & Fluorescent Market and publishes its comprehensive annual report, highlighting emerging trends, growth drivers, revenue analysis, and forecast outlook. Our insights help businesses to make data-backed strategic decisions with ongoing market dynamics. Our analysts track relevent industries related to the Kazakhstan Energy Saving & Fluorescent Market, allowing our clients with actionable intelligence and reliable forecasts tailored to emerging regional needs.
Yes, we provide customisation as per your requirements. To learn more, feel free to contact us on sales@6wresearch.com
1 Executive Summary |
2 Introduction |
2.1 Key Highlights of the Report |
2.2 Report Description |
2.3 Market Scope & Segmentation |
2.4 Research Methodology |
2.5 Assumptions |
3 Kazakhstan Energy Saving & Fluorescent Market Overview |
3.1 Kazakhstan Country Macro Economic Indicators |
3.2 Kazakhstan Energy Saving & Fluorescent Market Revenues & Volume, 2022 & 2032F |
3.3 Kazakhstan Energy Saving & Fluorescent Market - Industry Life Cycle |
3.4 Kazakhstan Energy Saving & Fluorescent Market - Porter's Five Forces |
3.5 Kazakhstan Energy Saving & Fluorescent Market Revenues & Volume Share, By Sources, 2022 & 2032F |
3.6 Kazakhstan Energy Saving & Fluorescent Market Revenues & Volume Share, By Applications, 2022 & 2032F |
4 Kazakhstan Energy Saving & Fluorescent Market Dynamics |
4.1 Impact Analysis |
4.2 Market Drivers |
4.3 Market Restraints |
5 Kazakhstan Energy Saving & Fluorescent Market Trends |
6 Kazakhstan Energy Saving & Fluorescent Market, By Types |
6.1 Kazakhstan Energy Saving & Fluorescent Market, By Sources |
6.1.1 Overview and Analysis |
6.1.2 Kazakhstan Energy Saving & Fluorescent Market Revenues & Volume, By Sources, 2022 - 2032F |
6.1.3 Kazakhstan Energy Saving & Fluorescent Market Revenues & Volume, By High-Intensity Discharge Lamps (HID), 2022 - 2032F |
6.1.4 Kazakhstan Energy Saving & Fluorescent Market Revenues & Volume, By Linear Fluorescent Lamps (LFL), 2022 - 2032F |
6.1.5 Kazakhstan Energy Saving & Fluorescent Market Revenues & Volume, By Light Emitting Diodes (LED), 2022 - 2032F |
6.2 Kazakhstan Energy Saving & Fluorescent Market, By Applications |
6.2.1 Overview and Analysis |
6.2.2 Kazakhstan Energy Saving & Fluorescent Market Revenues & Volume, By Commercial, 2022 - 2032F |
6.2.3 Kazakhstan Energy Saving & Fluorescent Market Revenues & Volume, By Residential, 2022 - 2032F |
6.2.4 Kazakhstan Energy Saving & Fluorescent Market Revenues & Volume, By Government, 2022 - 2032F |
7 Kazakhstan Energy Saving & Fluorescent Market Import-Export Trade Statistics |
7.1 Kazakhstan Energy Saving & Fluorescent Market Export to Major Countries |
7.2 Kazakhstan Energy Saving & Fluorescent Market Imports from Major Countries |
8 Kazakhstan Energy Saving & Fluorescent Market Key Performance Indicators |
9 Kazakhstan Energy Saving & Fluorescent Market - Opportunity Assessment |
9.1 Kazakhstan Energy Saving & Fluorescent Market Opportunity Assessment, By Sources, 2022 & 2032F |
9.2 Kazakhstan Energy Saving & Fluorescent Market Opportunity Assessment, By Applications, 2022 & 2032F |
10 Kazakhstan Energy Saving & Fluorescent Market - Competitive Landscape |
10.1 Kazakhstan Energy Saving & Fluorescent Market Revenue Share, By Companies, 2025 |
10.2 Kazakhstan Energy Saving & Fluorescent Market Competitive Benchmarking, By Operating and Technical Parameters |
11 Company Profiles |
12 Recommendations |
13 Disclaimer |
Global Go To Market Strategy - 2030
Export potential enables firms to identify high-growth global markets with greater confidence by combining advanced trade intelligence with a structured quantitative methodology. The framework analyzes emerging demand trends and country-level import patterns while integrating macroeconomic and trade datasets such as GDP and population forecasts, bilateral import–export flows, tariff structures, elasticity differentials between developed and developing economies, geographic distance, and import demand projections. Using weighted trade values from 2020–2024 as the base period to project country-to-country export potential for 2030, these inputs are operationalized through calculated drivers such as gravity model parameters, tariff impact factors, and projected GDP per-capita growth. Through an analysis of hidden potentials, demand hotspots, and market conditions that are most favorable to success, this method enables firms to focus on target countries, maximize returns, and global expansion with data, backed by accuracy.
By factoring in the projected importer demand gap that is currently unmet and could be potential opportunity, it identifies the potential for the Exporter (Country) among 190 countries, against the general trade analysis, which identifies the biggest importer or exporter.
To discover high-growth global markets and optimize your business strategy:
Click Here
Pricing
- Single User License$ 1,995
- Department License$ 2,400
- Site License$ 3,120
- Global License$ 3,795

Leadership Perspectives from Industry Events
Search
Thought Leadership and Analyst Meet


Our Clients
6WResearch In News
- India Air Conditioner Market Set for Strong Rebound in 2026 After Weather-Led Correction and GST-Driven Recovery: 6Wresearch
- ADAS in India: How Automatic Emergency Braking, Blind Spot Detection & Driver Monitoring are Transforming Road Safety
- Doha a strategic location for EV manufacturing hub: IPA Qatar
- Demand for luxury TVs surging in the GCC, says Samsung
- Empowering Growth: The Thriving Journey of Bangladesh’s Cable Industry
- Demand for luxury TVs surging in the GCC, says Samsung
Latest Reports
- Nicaragua RPG Gaming Market (2026-2032)
- New Zealand RPG Gaming Market (2026-2032)
- Netherlands RPG Gaming Market (2026-2032)
- Nauru RPG Gaming Market (2026-2032)
- Namibia RPG Gaming Market (2026-2032)
- Mozambique RPG Gaming Market (2026-2032)
- Montenegro RPG Gaming Market (2026-2032)
- Mongolia RPG Gaming Market (2026-2032)
- Monaco RPG Gaming Market (2026-2032)
- Micronesia RPG Gaming Market (2026-2032)
Industry Events and Analyst Meet

HIMTEX 2026

India Refining Summit 2026

India EV Show 2026

EV tech India Expo 2026

Auto Tech Asia 2026
Whitepaper
- Middle East & Africa Commercial Security Market Click here to view more.
- Middle East & Africa Fire Safety Systems & Equipment Market Click here to view more.
- GCC Drone Market Click here to view more.
- Middle East Lighting Fixture Market Click here to view more.
- GCC Physical & Perimeter Security Market Click here to view more.