Kenya 3D Holographic Display and Services Market (2026-2032) Outlook | Industry, Revenue, Analysis, Size, Value, Trends, Share, Companies, Forecast, Growth
Market Forecast By End-users (Media and Entertainment, Consumer Electronics, Healthcare, Automotive, Retail, Others) And Competitive Landscape
| Product Code: ETC066789 | Publication Date: Aug 2021 | Updated Date: Jun 2026 | Product Type: Report | |
| Publisher: 6Wresearch | Author: Dhaval Chaurasia | No. of Pages: 70 | No. of Figures: 35 | No. of Tables: 5 |
Kenya 3D Holographic Display and Services Market Size, Share & Growth Rate
The Kenya 3D Holographic Display and Services Market was estimated at USD 232 Million in 2025 and is projected to reach USD 319 Million by 2032, growing at a CAGR of 4.7% from 2026 to 2032. This growth trajectory is primarily fueled by technological advancements and a growing demand for innovative marketing strategies across diverse sectors. As businesses increasingly leverage holographic displays for more engaging advertising, educational, and entertainment experiences, we anticipate sustained momentum in this vibrant market.
Kenya 3D Holographic Display and Services Market Year-wise Growth Rate and Key Drivers
This graph highlights how the Kenya 3D Holographic Display and Services Market has steadily grown over the years, supported by major growth factors.
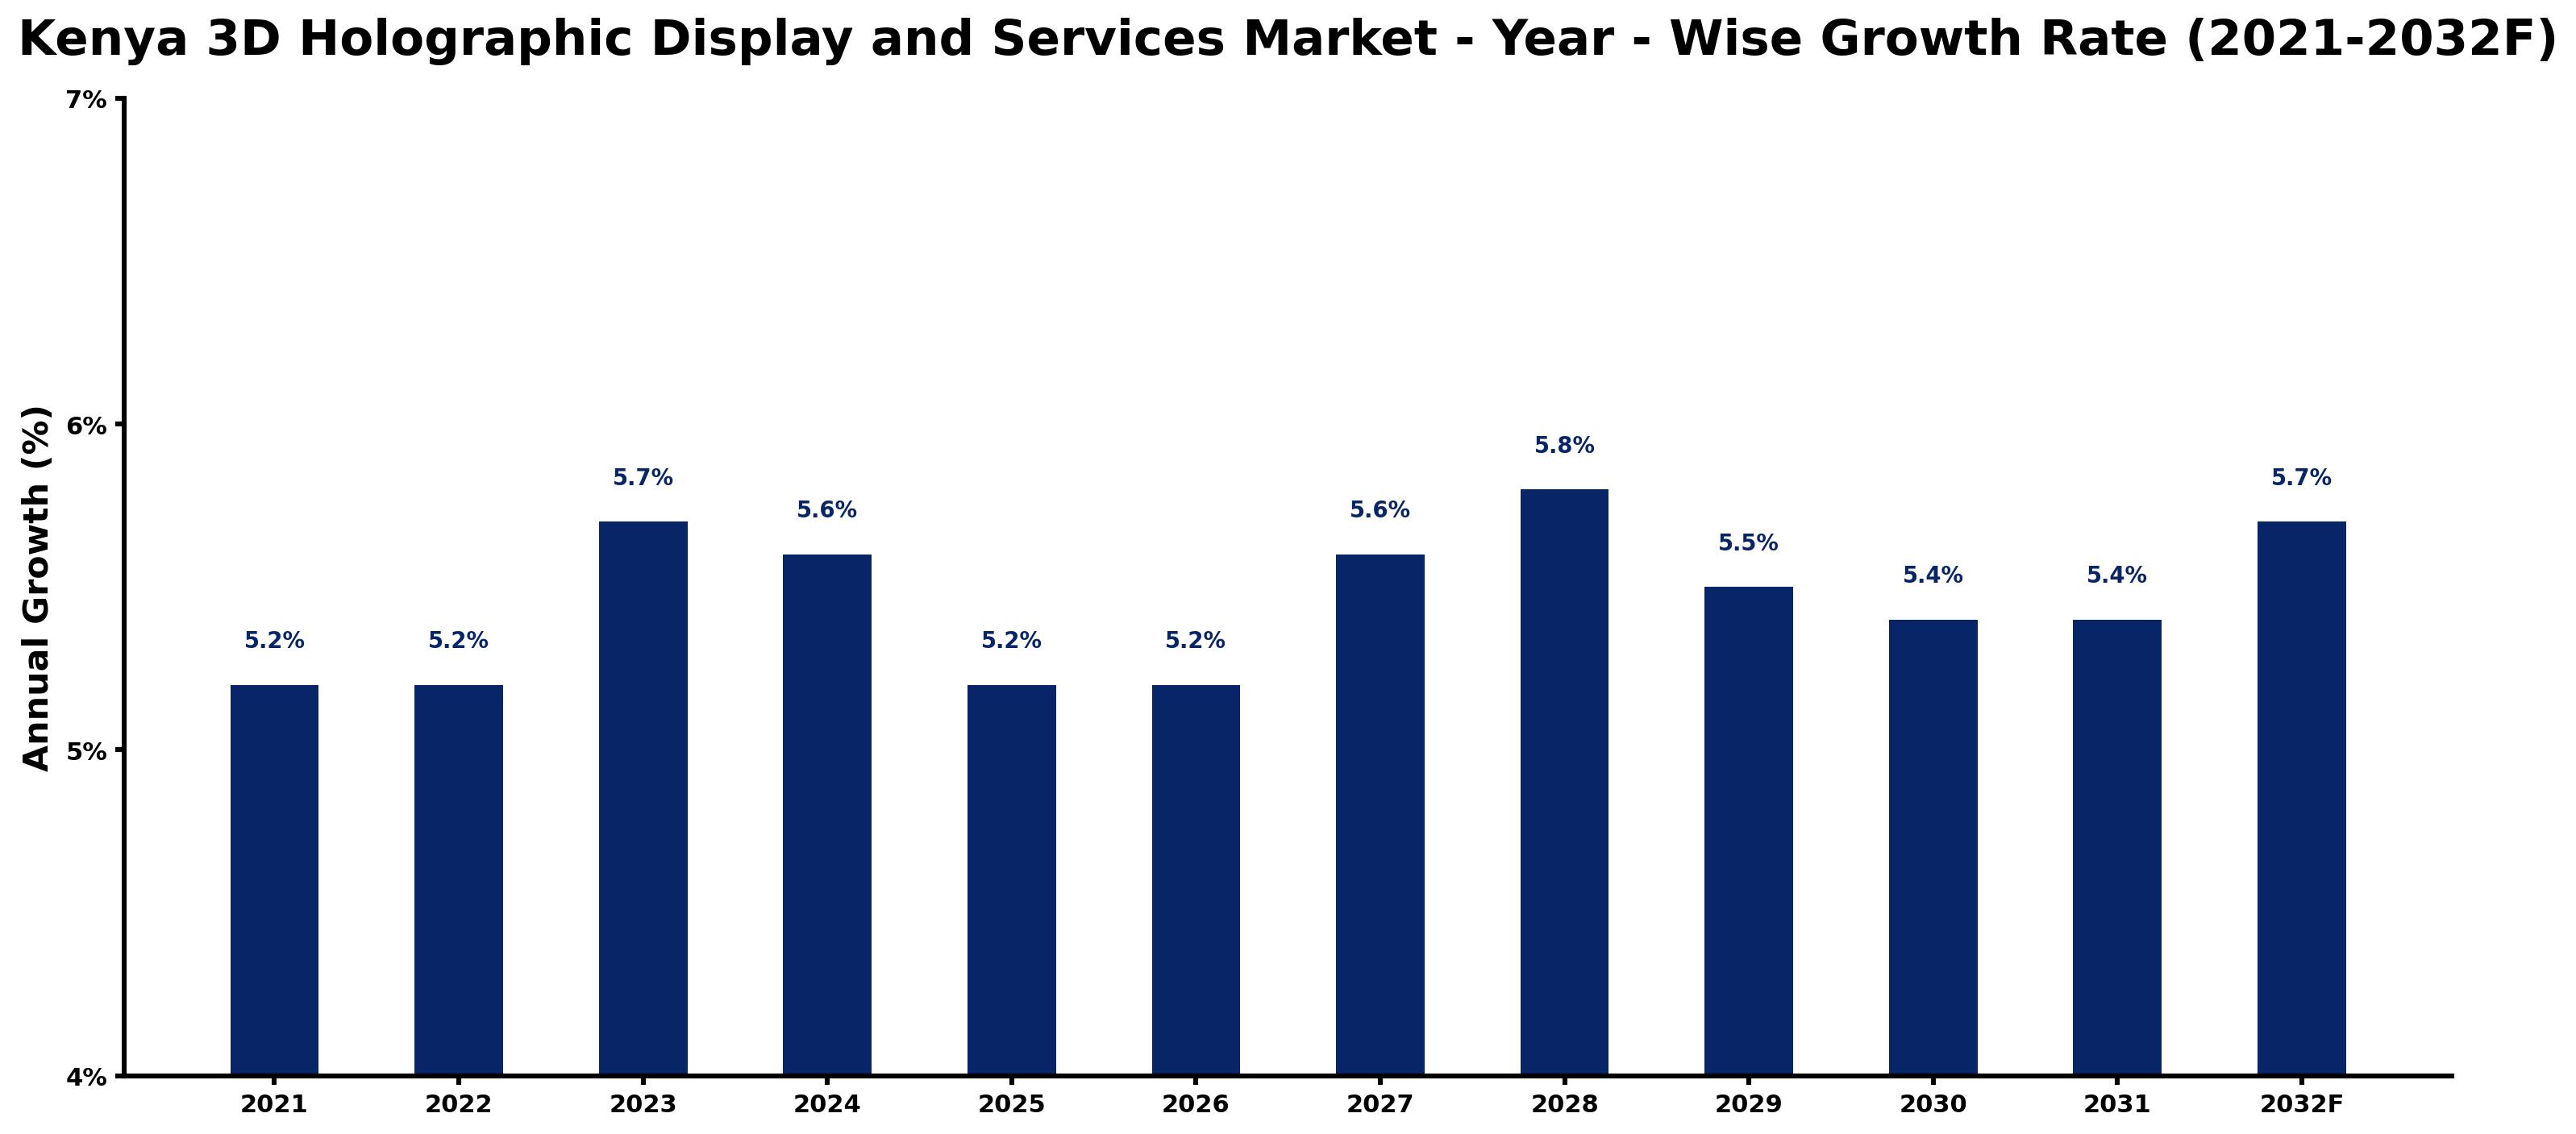
The table below presents the year‑wise growth rates along with the key drivers influencing the market
| Year | Growth Rate | Major Drivers |
| 2021 | 5.2% | Expansion of manufacturing activities |
| 2022 | 5.2% | Rapid growth in telecom and data center sectors |
| 2023 | 5.7% | Growing urbanization and commercial development |
| 2024 | 5.6% | Increasing adoption of advanced technologies |
| 2025 | 5.2% | Expansion of transportation and logistics networks |
| 2026 | 5.2% | Rapid growth in telecom and data center sectors |
| 2027 | 5.6% | Increasing adoption of advanced technologies |
| 2028 | 5.8% | Increasing smart city development projects |
| 2029 | 5.5% | Increasing smart city development projects |
| 2030 | 5.4% | Expansion of transportation and logistics networks |
| 2031 | 5.4% | Increasing industrial automation investments |
| 2032 | 5.7% | Expansion of commercial construction activities |
Note - Market size estimations and growth projections presented in this report are based on 6Wresearch’s advanced forecasting approach, validated with industry datasets as of June 2026.
Kenya 3D Holographic Display and Services Market Synopsis
The most influential force shaping the Kenya 3D holographic display and services market currently is the surge in demand for immersive advertising solutions. As brands strive to captivate consumers with unique experiences, holographic displays have emerged as an effective tool for enhancing customer engagement and brand visibility.
Additionally, the integration of augmented and virtual reality technologies is setting a new standard for visual experiences. This fusion is not only expanding the market's potential applications but is also attracting investments aimed at developing tailored holographic solutions across various sectors, including retail and healthcare.
Kenya 3D Holographic Display and Services Market Key Takeaways
- The market is projected to grow significantly, reaching USD 319 Million by 2032.
- Technological advancements are enhancing the interactivity and realism of holographic content.
- Key industries benefiting from holographic displays include retail, education, and healthcare.
- Customized holographic solutions are increasingly sought after to engage consumers effectively.
- The government's push towards technological innovation is facilitating market growth.
Evaluation of Restraints in Kenya 3D Holographic Display and Services Market
Despite the promising prospects, the Kenya 3D holographic display and services market faces notable restraints. A prevalent issue is the limited consumer awareness surrounding the technology, which often hampers widespread adoption. Coupled with this is the high cost associated with implementing such advanced systems, posing significant challenges for small to medium enterprises. The scarcity of skilled professionals proficient in this technology is another barrier, impacting the operational effectiveness of 3D holographic displays. Additionally, infrastructural issues such as inconsistent internet connectivity and power supply further complicate the market landscape.
Kenya 3D Holographic Display and Services Market Trends
The current trends in the Kenya 3D holographic display and services market revolve around innovation and enhanced user experiences. There is a notable rise in holographic projection mapping, particularly for events and exhibitions, reflecting a shift towards more engaging and visually appealing experiences. Furthermore, the integration of artificial intelligence in the development of holographic content is enabling more realistic interactions. As consumers seek captivating experiences, businesses are increasingly adopting these technologies to stay competitive and relevant.
Kenya 3D Holographic Display and Services Market Opportunities
The Kenya 3D holographic display and services market is rife with investment opportunities, especially in sectors where immersive technology is gaining traction. The healthcare industry, for instance, is beginning to explore holographic displays for training and patient engagement. Additionally, there is a growing demand for customized solutions tailored to specific advertising and marketing needs. Investing in research and development to enhance existing technologies and exploring strategic partnerships can position stakeholders favorably within this expanding landscape.
Government Initiatives in the Kenya 3D Holographic Display and Services Market
The Kenyan government has not yet established specific policies targeting the 3D holographic display and services market; however, various initiatives aim to foster a conducive environment for technological advancements. The National ICT Policy and Vision 2030 focus on enhancing the country's digital infrastructure and promoting innovation. Efforts to bolster local manufacturing and entrepreneurship, such as the "Buy Kenya, Build Kenya" policy, may also benefit the growth of domestic providers within the holographic display sector.
Future Insights of the Kenya 3D Holographic Display and Services Market
Looking ahead to 2026-2032, the Kenya 3D holographic display and services market is set for robust growth fueled by the increasing adoption of advanced technologies in key sectors. As more industries embrace innovative visual solutions for advertising and engagement, the market will likely experience an influx of investments and product developments. The merging of holographic technology with virtual and augmented reality is expected to create exciting opportunities, further enhancing the overall user experience and market expansion.
Kenya 3D Holographic Display and Services Market Latest Developments (May 2025 - June 2026)
In recent months, the Kenya 3D holographic display and services market has witnessed notable advancements in technology and application. There has been increased interest in holographic solutions for virtual events and trade shows, particularly as businesses seek unique ways to engage audiences remotely. Additionally, various stakeholders are actively exploring partnerships to develop customized holographic content, enhancing overall customer interaction and satisfaction.
Kenya 3D Holographic Display and Services Market - Key Attractiveness of the Report
- 10 Years of Market Numbers
- Historical Data Starting from 2022 to 2025
- Base Year: 2025
- Forecast Data until 2032
- Key Performance Indicators Impacting the Market
- Major Upcoming Developments and Projects
Key Highlights of the Report:
- Kenya 3D Holographic Display and Services Market Outlook
- Market Size of Kenya 3D Holographic Display and Services Market, 2025
- Forecast of Kenya 3D Holographic Display and Services Market, 2032
- Historical Data and Forecast of Kenya 3D Holographic Display and Services Revenues & Volume for the Period 2022-2032F
- Kenya 3D Holographic Display and Services Market Trend Evolution
- Kenya 3D Holographic Display and Services Market Drivers and Challenges
- Kenya 3D Holographic Display and Services Price Trends
- Kenya 3D Holographic Display and Services Porter's Five Forces
- Kenya 3D Holographic Display and Services Industry Life Cycle
- Historical Data and Forecast of Kenya 3D Holographic Display and Services Market Revenues & Volume By End-users for the Period 2022-2032F
- Historical Data and Forecast of Kenya 3D Holographic Display and Services Market Revenues & Volume By Media and Entertainment for the Period 2022-2032F
- Historical Data and Forecast of Kenya 3D Holographic Display and Services Market Revenues & Volume By Consumer Electronics for the Period 2022-2032F
- Historical Data and Forecast of Kenya 3D Holographic Display and Services Market Revenues & Volume By Healthcare for the Period 2022-2032F
- Historical Data and Forecast of Kenya 3D Holographic Display and Services Market Revenues & Volume By Automotive for the Period 2022-2032F
- Historical Data and Forecast of Kenya 3D Holographic Display and Services Market Revenues & Volume By Retail for the Period 2022-2032F
- Historical Data and Forecast of Kenya 3D Holographic Display and Services Market Revenues & Volume By Others for the Period 2022-2032F
- Kenya 3D Holographic Display and Services Import Export Trade Statistics
- Market Opportunity Assessment By End-users
- Kenya 3D Holographic Display and Services Top Companies Market Share
- Kenya 3D Holographic Display and Services Competitive Benchmarking By Technical and Operational Parameters
- Kenya 3D Holographic Display and Services Company Profiles
- Kenya 3D Holographic Display and Services Key Strategic Recommendations
Kenya 3D Holographic Display and Services Market - Frequently Asked Questions
The Kenya 3D holographic display market is anticipated to grow significantly, with projections showing it reaching USD 319 Million by 2032, growing at a CAGR of 4.7% from 2026 to 2032. This growth is driven by increasing demand across various sectors for engaging visual solutions.
Key industries adopting 3D holographic displays include retail, education, healthcare, and entertainment. These sectors leverage this technology to create immersive experiences, attracting consumer attention and enhancing engagement.
Significant challenges include limited consumer awareness of the technology, high costs of implementation, and a shortage of skilled professionals in the field. Addressing these challenges is essential for broader market adoption.
Businesses are increasingly using 3D holographic displays for product launches, virtual events, and experiential marketing campaigns to create memorable customer experiences and stand out in competitive markets.
Although specific policies for the 3D holographic display market are lacking, broader initiatives aimed at promoting technology and innovation in Kenya create a supportive environment for growth and development in this sector.
6Wresearch actively monitors the Kenya 3D Holographic Display and Services Market and publishes its comprehensive annual report, highlighting emerging trends, growth drivers, revenue analysis, and forecast outlook. Our insights help businesses to make data-backed strategic decisions with ongoing market dynamics. Our analysts track relevent industries related to the Kenya 3D Holographic Display and Services Market, allowing our clients with actionable intelligence and reliable forecasts tailored to emerging regional needs.
Yes, we provide customisation as per your requirements. To learn more, feel free to contact us on sales@6wresearch.com
1 Executive Summary |
2 Introduction |
2.1 Key Highlights of the Report |
2.2 Report Description |
2.3 Market Scope & Segmentation |
2.4 Research Methodology |
2.5 Assumptions |
3 Kenya 3D Holographic Display and Services Market Overview |
3.1 Kenya Country Macro Economic Indicators |
3.2 Kenya 3D Holographic Display and Services Market Revenues & Volume, 2022 & 2032F |
3.3 Kenya 3D Holographic Display and Services Market - Industry Life Cycle |
3.4 Kenya 3D Holographic Display and Services Market - Porter's Five Forces |
3.5 Kenya 3D Holographic Display and Services Market Revenues & Volume Share, By End-users, 2022 & 2032F |
4 Kenya 3D Holographic Display and Services Market Dynamics |
4.1 Impact Analysis |
4.2 Market Drivers |
4.3 Market Restraints |
5 Kenya 3D Holographic Display and Services Market Trends |
6 Kenya 3D Holographic Display and Services Market, By Types |
6.1 Kenya 3D Holographic Display and Services Market, By End-users |
6.1.1 Overview and Analysis |
6.1.2 Kenya 3D Holographic Display and Services Market Revenues & Volume, By End-users, 2022-2032F |
6.1.3 Kenya 3D Holographic Display and Services Market Revenues & Volume, By Media and Entertainment, 2022-2032F |
6.1.4 Kenya 3D Holographic Display and Services Market Revenues & Volume, By Consumer Electronics, 2022-2032F |
6.1.5 Kenya 3D Holographic Display and Services Market Revenues & Volume, By Healthcare, 2022-2032F |
6.1.6 Kenya 3D Holographic Display and Services Market Revenues & Volume, By Automotive, 2022-2032F |
6.1.7 Kenya 3D Holographic Display and Services Market Revenues & Volume, By Retail, 2022-2032F |
6.1.8 Kenya 3D Holographic Display and Services Market Revenues & Volume, By Others, 2022-2032F |
7 Kenya 3D Holographic Display and Services Market Import-Export Trade Statistics |
7.1 Kenya 3D Holographic Display and Services Market Export to Major Countries |
7.2 Kenya 3D Holographic Display and Services Market Imports from Major Countries |
8 Kenya 3D Holographic Display and Services Market Key Performance Indicators |
9 Kenya 3D Holographic Display and Services Market - Opportunity Assessment |
9.1 Kenya 3D Holographic Display and Services Market Opportunity Assessment, By End-users, 2022 & 2032F |
10 Kenya 3D Holographic Display and Services Market - Competitive Landscape |
10.1 Kenya 3D Holographic Display and Services Market Revenue Share, By Companies, 2025 |
10.2 Kenya 3D Holographic Display and Services Market Competitive Benchmarking, By Operating and Technical Parameters |
11 Company Profiles |
12 Recommendations |
13 Disclaimer |
Global Go To Market Strategy - 2030
Export potential enables firms to identify high-growth global markets with greater confidence by combining advanced trade intelligence with a structured quantitative methodology. The framework analyzes emerging demand trends and country-level import patterns while integrating macroeconomic and trade datasets such as GDP and population forecasts, bilateral import–export flows, tariff structures, elasticity differentials between developed and developing economies, geographic distance, and import demand projections. Using weighted trade values from 2020–2024 as the base period to project country-to-country export potential for 2030, these inputs are operationalized through calculated drivers such as gravity model parameters, tariff impact factors, and projected GDP per-capita growth. Through an analysis of hidden potentials, demand hotspots, and market conditions that are most favorable to success, this method enables firms to focus on target countries, maximize returns, and global expansion with data, backed by accuracy.
By factoring in the projected importer demand gap that is currently unmet and could be potential opportunity, it identifies the potential for the Exporter (Country) among 190 countries, against the general trade analysis, which identifies the biggest importer or exporter.
To discover high-growth global markets and optimize your business strategy:
Click Here
Pricing
- Single User License$ 1,995
- Department License$ 2,400
- Site License$ 3,120
- Global License$ 3,795

Leadership Perspectives from Industry Events
Search
Thought Leadership and Analyst Meet


Our Clients
6WResearch In News
- India Air Conditioner Market Set for Strong Rebound in 2026 After Weather-Led Correction and GST-Driven Recovery: 6Wresearch
- ADAS in India: How Automatic Emergency Braking, Blind Spot Detection & Driver Monitoring are Transforming Road Safety
- Doha a strategic location for EV manufacturing hub: IPA Qatar
- Demand for luxury TVs surging in the GCC, says Samsung
- Empowering Growth: The Thriving Journey of Bangladesh’s Cable Industry
- Demand for luxury TVs surging in the GCC, says Samsung
Latest Reports
- Nicaragua RPG Gaming Market (2026-2032)
- New Zealand RPG Gaming Market (2026-2032)
- Netherlands RPG Gaming Market (2026-2032)
- Nauru RPG Gaming Market (2026-2032)
- Namibia RPG Gaming Market (2026-2032)
- Mozambique RPG Gaming Market (2026-2032)
- Montenegro RPG Gaming Market (2026-2032)
- Mongolia RPG Gaming Market (2026-2032)
- Monaco RPG Gaming Market (2026-2032)
- Micronesia RPG Gaming Market (2026-2032)
Industry Events and Analyst Meet

EV India Expo 2026

HIMTEX 2026

India Refining Summit 2026

India EV Show 2026

EV tech India Expo 2026
Whitepaper
- Middle East & Africa Commercial Security Market Click here to view more.
- Middle East & Africa Fire Safety Systems & Equipment Market Click here to view more.
- GCC Drone Market Click here to view more.
- Middle East Lighting Fixture Market Click here to view more.
- GCC Physical & Perimeter Security Market Click here to view more.