Kenya Alternators Market (2026-2032) Outlook | Value, Forecast, Trends, Industry, Growth, Share, Revenue, Size, Companies & Analysis
Market Forecast By Type (Electro-Magnet (Induction) Alternators, Permanent Magnet Alternators, Others Alternators), By Voltage (220V-440V Alternators, More than 440V Alternators, Less than 220V Alternators), By Rated Power (<1kW, 1 kW-5 kW, 5 kW-50 kW, <50KW-500 kW, 500KW-1500 kW, 1500KW-5000 kW, >5000KW), By Application (Industrial Applications, Automotive and Transportation, Power Generation, Standby Power, Others), By Speed (Low Speed Alternators, Medium Speed Alternators, High Speed Alternators, Ultra High-Speed Alternators), By Weight (Low Weight Alternators, Medium Weight Alternators, High Weight Alternators), By End-Use Sector (Industrial, Commercial, Residential), By Fuel Used (Fossil fuel, Natural) And Competitive Landscape
| Product Code: ETC257090 | Publication Date: Aug 2022 | Updated Date: Jul 2026 | Product Type: Market Research Report | |
| Publisher: 6Wresearch | Author: Sachin Kumar Rai | No. of Pages: 75 | No. of Figures: 35 | No. of Tables: 20 |
Kenya Alternators Market Size, Share & Growth Rate
The Kenya Alternators Market was estimated at USD 207 Million in 2025 and is projected to reach USD 274 Million by 2032, growing at a CAGR of 4.1% from 2026 to 2032. This growth trajectory is fueled by a burgeoning demand across sectors like automotive and construction, driven by infrastructure advancements and increased industrial activities. Furthermore, the shift towards renewable energy solutions is augmenting the need for reliable power generation, thereby propelling the alternators market in Kenya.
Kenya Alternators Market Year-wise Growth Rate and Key Drivers
This graph highlights how the Kenya Alternators Market has steadily grown over the years, supported by major growth factors.
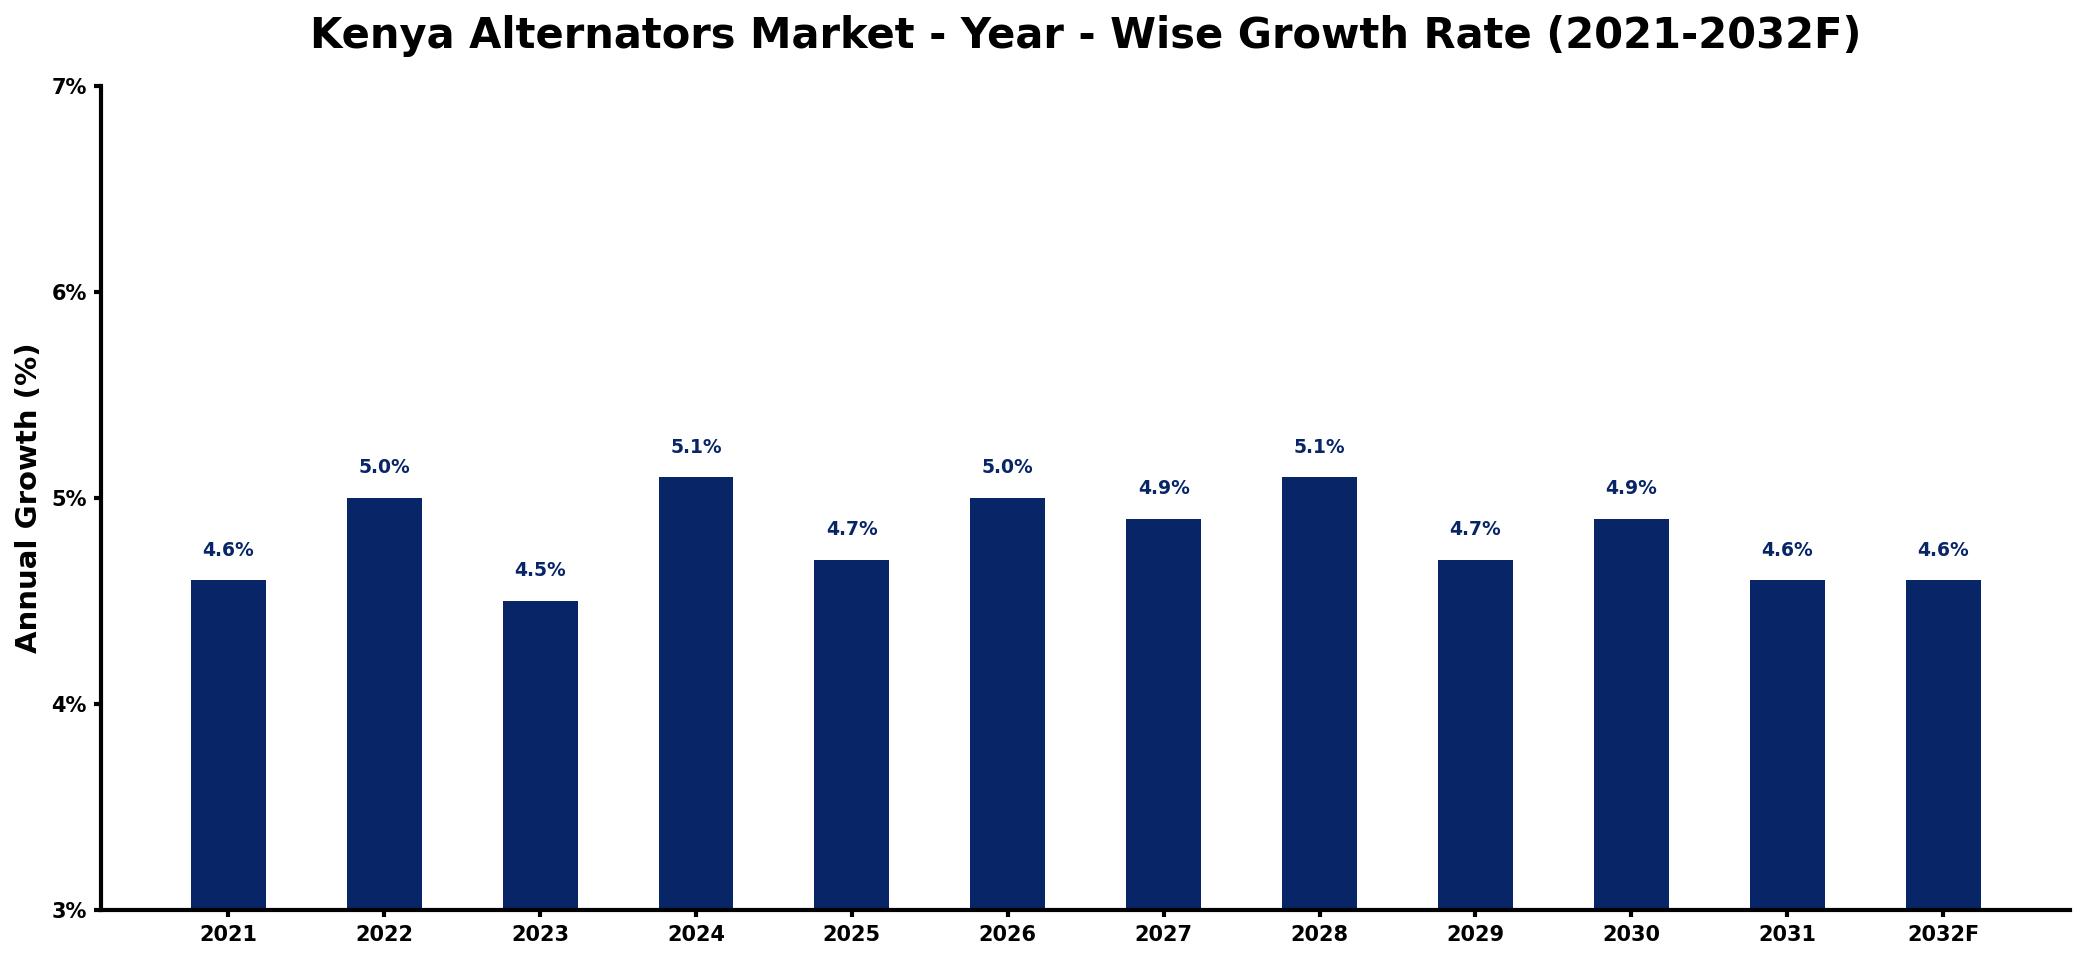
The table below presents the year‑wise growth rates along with the key drivers influencing the market
| Year | Growth Rate | Major Drivers |
| 2021 | 4.6% | Rising demand for renewable energy |
| 2022 | 5.0% | Increased automotive production rates |
| 2023 | 4.5% | Growth in construction sector investments |
| 2024 | 5.1% | Expansion of telecommunications infrastructure |
| 2025 | 4.7% | Boost in agricultural mechanization efforts |
| 2026 | 5.0% | Surge in electric vehicle adoption |
| 2027 | 4.9% | rising end-use demand growth |
| 2028 | 5.1% | Increasing urbanization and electrification |
| 2029 | 4.7% | Enhanced manufacturing capabilities emerging |
| 2030 | 4.9% | Development of smart grid technologies |
| 2031 | 4.6% | Rising focus on energy efficiency |
| 2032 | 4.6% | Strengthening of regional trade agreements |
Note: Market size estimations and growth projections presented in this report are based on 6Wresearch's proprietary forecasting methodology, utilizing the latest available industry data, government publications, and primary research inputs.
Kenya Alternators Market Synopsis
In recent years, there has been a notable increase in the installation of alternators within the automotive sector, as manufacturers emphasize enhanced performance and fuel efficiency. The construction industry's expansion is also a critical demand driver, as it requires dependable power sources to support heavy machinery and equipment.
Moreover, advancements in technology have led to a greater focus on energy-efficient and environmentally sustainable alternators. As businesses recognize the benefits of lower operational costs and reduced environmental impact, the appetite for innovative products continues to grow.
Kenya Alternators Market Key Takeaways
- The market is projected to grow steadily due to increasing demand from key sectors like automotive and construction.
- Energy efficiency and sustainability are becoming paramount in alternator design and manufacturing.
- Digital technologies are being integrated into alternators, enhancing monitoring and maintenance capabilities.
- Government initiatives are supporting local manufacturing, driving market competitiveness.
- Investment in renewable energy sources will significantly influence future market developments.
Evaluation of Restraints in Kenya Alternators Market
Despite its promising growth, the Kenya alternators market faces several barriers. Intense competition from both local and international manufacturers often results in price wars, impacting profitability. The inconsistent power supply and voltage fluctuations prevalent in the region can undermine the operational reliability of alternators, leading to increased maintenance costs for users. Additionally, the proliferation of counterfeit products poses a significant threat, eroding consumer trust and complicating the market landscape. Navigating stringent regulatory requirements further challenges suppliers, necessitating robust strategies to maintain compliance and quality.
Kenya Alternators Market Trends
The Kenya alternators market is currently influenced by several notable trends. A significant focus on energy efficiency has led manufacturers to innovate, creating products with enhanced efficiency ratings. Additionally, the adoption of digital technologies for remote monitoring and predictive maintenance is gaining momentum, allowing for reduced downtime and increased reliability. Theres also a clear trend towards customization in products, addressing the specific needs of various industries, thereby further driving market dynamics.
Kenya Alternators Market Opportunities
Investment opportunities abound in the Kenya alternators market, particularly in sectors demanding reliable power solutions, such as telecommunications and manufacturing. The shift towards renewable energy also opens avenues for alternators designed for integration in solar and wind applications. Investors can explore partnerships with local businesses and government initiatives that promote sustainability, capitalizing on a growing trend that aligns with global environmental goals.
Government Initiatives in the Kenya Alternators Market
The Kenyan government is actively promoting the alternators market through various policies aimed at enhancing local manufacturing capabilities. Incentives such as tax breaks and subsidies encourage investment in domestic production, while the Kenya Bureau of Standards (KEBS) ensures compliance with quality regulations. Additionally, financial assistance programs target sectors like construction and agriculture, fostering the use of alternators to improve productivity and energy reliability.
Future Insights of the Kenya Alternators Market
Looking ahead to 2026-2032, the Kenya alternators market is poised for continuous growth. Increased investment in infrastructure development and industrialization will remain primary growth catalysts. Additionally, as the emphasis on renewable energy sources escalates, the demand for alternators compatible with these technologies is set to rise. Overall, the market is on a trajectory towards expansion, creating a landscape ripe for both domestic and international investment.
Kenya Alternators Market Latest Developments (2025 - 2026)
Recent industry movements indicate a strong trend towards the integration of smart technologies in alternators, aimed at improving efficiency and user experience. The market has seen heightened collaboration between manufacturers and technology firms, focusing on enhancing product reliability through innovation. Additionally, the push for greener technologies is prompting manufacturers to explore eco-friendly materials and production processes.
Kenya Alternators Market - Key Attractiveness of the Report
- 10 Years of Market Numbers
- Historical Data Starting from 2022 to 2025
- Base Year: 2025
- Forecast Data until 2032
- Key Performance Indicators Impacting the Market
- Major Upcoming Developments and Projects
Key Highlights of the Report:
- Kenya Alternators Market Outlook
- Market Size of Kenya Alternators Market, 2025
- Forecast of Kenya Alternators Market, 2032
- Historical Data and Forecast of Kenya Alternators Revenues & Volume for the Period 2022-2032F
- Kenya Alternators Market Trend Evolution
- Kenya Alternators Market Drivers and Challenges
- Kenya Alternators Price Trends
- Kenya Alternators Porter's Five Forces
- Kenya Alternators Industry Life Cycle
- Historical Data and Forecast of Kenya Alternators Market Revenues & Volume By Type for the Period 2022-2032F
- Historical Data and Forecast of Kenya Alternators Market Revenues & Volume By Electro-Magnet (Induction) Alternators for the Period 2022-2032F
- Historical Data and Forecast of Kenya Alternators Market Revenues & Volume By Permanent Magnet Alternators for the Period 2022-2032F
- Historical Data and Forecast of Kenya Alternators Market Revenues & Volume By Others Alternators for the Period 2022-2032F
- Historical Data and Forecast of Kenya Alternators Market Revenues & Volume By Voltage for the Period 2022-2032F
- Historical Data and Forecast of Kenya Alternators Market Revenues & Volume By 220V-440V Alternators for the Period 2022-2032F
- Historical Data and Forecast of Kenya Alternators Market Revenues & Volume By More than 440V Alternators for the Period 2022-2032F
- Historical Data and Forecast of Kenya Alternators Market Revenues & Volume By Less than 220V Alternators for the Period 2022-2032F
- Historical Data and Forecast of Kenya Alternators Market Revenues & Volume By Rated Power for the Period 2022-2032F
- Historical Data and Forecast of Kenya Alternators Market Revenues & Volume By <1kW for the Period 2022-2032F
- Historical Data and Forecast of Kenya Alternators Market Revenues & Volume By 1 kW-5 kW for the Period 2022-2032F
- Historical Data and Forecast of Kenya Alternators Market Revenues & Volume By 5 kW-50 kW for the Period 2022-2032F
- Historical Data and Forecast of Kenya Alternators Market Revenues & Volume By <50KW-500 kW for the Period 2022-2032F
- Historical Data and Forecast of Kenya Alternators Market Revenues & Volume By 500KW-1500 kW for the Period 2022-2032F
- Historical Data and Forecast of Kenya Alternators Market Revenues & Volume By 1500KW-5000 kW for the Period 2022-2032F
- Historical Data and Forecast of Kenya Alternators Market Revenues & Volume By >5000KW for the Period 2022-2032F
- Historical Data and Forecast of Kenya Alternators Market Revenues & Volume By Application for the Period 2022-2032F
- Historical Data and Forecast of Kenya Alternators Market Revenues & Volume By Industrial Applications for the Period 2022-2032F
- Historical Data and Forecast of Kenya Alternators Market Revenues & Volume By Automotive and Transportation for the Period 2022-2032F
- Historical Data and Forecast of Kenya Alternators Market Revenues & Volume By Power Generation for the Period 2022-2032F
- Historical Data and Forecast of Kenya Alternators Market Revenues & Volume By Standby Power for the Period 2022-2032F
- Historical Data and Forecast of Kenya Alternators Market Revenues & Volume By Others for the Period 2022-2032F
- Historical Data and Forecast of Kenya Alternators Market Revenues & Volume By Speed for the Period 2022-2032F
- Historical Data and Forecast of Kenya Alternators Market Revenues & Volume By Low Speed Alternators for the Period 2022-2032F
- Historical Data and Forecast of Kenya Alternators Market Revenues & Volume By Medium Speed Alternators for the Period 2022-2032F
- Historical Data and Forecast of Kenya Alternators Market Revenues & Volume By High Speed Alternators for the Period 2022-2032F
- Historical Data and Forecast of Kenya Alternators Market Revenues & Volume By Ultra High-Speed Alternators for the Period 2022-2032F
- Historical Data and Forecast of Kenya Alternators Market Revenues & Volume By Weight for the Period 2022-2032F
- Historical Data and Forecast of Kenya Alternators Market Revenues & Volume By Low Weight Alternators for the Period 2022-2032F
- Historical Data and Forecast of Kenya Alternators Market Revenues & Volume By Medium Weight Alternators for the Period 2022-2032F
- Historical Data and Forecast of Kenya Alternators Market Revenues & Volume By High Weight Alternators for the Period 2022-2032F
- Historical Data and Forecast of Kenya Alternators Market Revenues & Volume By End-Use Sector for the Period 2022-2032F
- Historical Data and Forecast of Kenya Alternators Market Revenues & Volume By Industrial for the Period 2022-2032F
- Historical Data and Forecast of Kenya Alternators Market Revenues & Volume By Commercial for the Period 2022-2032F
- Historical Data and Forecast of Kenya Alternators Market Revenues & Volume By Residential for the Period 2022-2032F
- Historical Data and Forecast of Kenya Alternators Market Revenues & Volume By Fuel Used for the Period 2022-2032F
- Historical Data and Forecast of Kenya Alternators Market Revenues & Volume By Fossil fuel for the Period 2022-2032F
- Historical Data and Forecast of Kenya Alternators Market Revenues & Volume By Natural for the Period 2022-2032F
- Kenya Alternators Import Export Trade Statistics
- Market Opportunity Assessment By Type
- Market Opportunity Assessment By Voltage
- Market Opportunity Assessment By Rated Power
- Market Opportunity Assessment By Application
- Market Opportunity Assessment By Speed
- Market Opportunity Assessment By Weight
- Market Opportunity Assessment By End-Use Sector
- Market Opportunity Assessment By Fuel Used
- Kenya Alternators Top Companies Market Share
- Kenya Alternators Competitive Benchmarking By Technical and Operational Parameters
- Kenya Alternators Company Profiles
- Kenya Alternators Key Strategic Recommendations
Frequently Asked Questions About the Market Study (FAQs):
The Kenya Alternators Market was estimated at USD 207 Million in 2025 and is projected to reach USD 274 Million by 2032, growing at a CAGR of 4.1% from 2026 to 2032.
Government initiatives are designed to bolster local manufacturing through tax incentives and quality regulations, fostering a competitive environment while ensuring high standards in production.
Key sectors such as automotive, construction, and telecommunications are significantly driving demand, with increasing infrastructure development and industrialization playing pivotal roles.
Energy efficiency is becoming crucial as businesses seek to minimize operational costs and reduce their environmental footprint, prompting manufacturers to innovate towards more sustainable alternatives.
Trends such as the adoption of digital technologies, customization of products, and the focus on renewable energy integration are shaping the future landscape of this market.
6Wresearch actively monitors the Kenya Alternators Market and publishes its comprehensive annual report, highlighting emerging trends, growth drivers, revenue analysis, and forecast outlook. Our insights help businesses to make data-backed strategic decisions with ongoing market dynamics. Our analysts track relevent industries related to the Kenya Alternators Market, allowing our clients with actionable intelligence and reliable forecasts tailored to emerging regional needs.
Yes, we provide customisation as per your requirements. To learn more, feel free to contact us on sales@6wresearch.com
1 Executive Summary |
2 Introduction |
2.1 Key Highlights of the Report |
2.2 Report Description |
2.3 Market Scope & Segmentation |
2.4 Research Methodology |
2.5 Assumptions |
3 Kenya Alternators Market Overview |
3.1 Kenya Country Macro Economic Indicators |
3.2 Kenya Alternators Market Revenues & Volume, 2022 & 2032F |
3.3 Kenya Alternators Market - Industry Life Cycle |
3.4 Kenya Alternators Market - Porter's Five Forces |
3.5 Kenya Alternators Market Revenues & Volume Share, By Type, 2022 & 2032F |
3.6 Kenya Alternators Market Revenues & Volume Share, By Voltage, 2022 & 2032F |
3.7 Kenya Alternators Market Revenues & Volume Share, By Rated Power, 2022 & 2032F |
3.8 Kenya Alternators Market Revenues & Volume Share, By Application, 2022 & 2032F |
3.9 Kenya Alternators Market Revenues & Volume Share, By Speed, 2022 & 2032F |
3.10 Kenya Alternators Market Revenues & Volume Share, By Weight, 2022 & 2032F |
3.11 Kenya Alternators Market Revenues & Volume Share, By End-Use Sector, 2022 & 2032F |
4 Kenya Alternators Market Dynamics |
4.1 Impact Analysis |
4.2 Market Drivers |
4.2.1 Increasing demand for reliable power sources in Kenya |
4.2.2 Growth in the automotive and manufacturing industries |
4.2.3 Government initiatives promoting renewable energy sources |
4.3 Market Restraints |
4.3.1 High initial investment costs for alternators |
4.3.2 Lack of technical expertise in maintenance and installation |
4.3.3 Competition from cheaper imported alternators |
5 Kenya Alternators Market Trends |
6 Kenya Alternators Market, By Types |
6.1 Kenya Alternators Market, By Type |
6.1.1 Overview and Analysis |
6.1.2 Kenya Alternators Market Revenues & Volume, By Type, 2022-2032F |
6.1.3 Kenya Alternators Market Revenues & Volume, By Electro-Magnet (Induction) Alternators, 2022-2032F |
6.1.4 Kenya Alternators Market Revenues & Volume, By Permanent Magnet Alternators, 2022-2032F |
6.1.5 Kenya Alternators Market Revenues & Volume, By Others Alternators, 2022-2032F |
6.2 Kenya Alternators Market, By Voltage |
6.2.1 Overview and Analysis |
6.2.2 Kenya Alternators Market Revenues & Volume, By 220V-440V Alternators, 2022-2032F |
6.2.3 Kenya Alternators Market Revenues & Volume, By More than 440V Alternators, 2022-2032F |
6.2.4 Kenya Alternators Market Revenues & Volume, By Less than 220V Alternators, 2022-2032F |
6.3 Kenya Alternators Market, By Rated Power |
6.3.1 Overview and Analysis |
6.3.2 Kenya Alternators Market Revenues & Volume, By <1kW, 2022-2032F |
6.3.3 Kenya Alternators Market Revenues & Volume, By 1 kW-5 kW, 2022-2032F |
6.3.4 Kenya Alternators Market Revenues & Volume, By 5 kW-50 kW, 2022-2032F |
6.3.5 Kenya Alternators Market Revenues & Volume, By <50KW-500 kW, 2022-2032F |
6.3.6 Kenya Alternators Market Revenues & Volume, By 500KW-1500 kW, 2022-2032F |
6.3.7 Kenya Alternators Market Revenues & Volume, By 1500KW-5000 kW, 2022-2032F |
6.4 Kenya Alternators Market, By Application |
6.4.1 Overview and Analysis |
6.4.2 Kenya Alternators Market Revenues & Volume, By Industrial Applications, 2022-2032F |
6.4.3 Kenya Alternators Market Revenues & Volume, By Automotive and Transportation, 2022-2032F |
6.4.4 Kenya Alternators Market Revenues & Volume, By Power Generation, 2022-2032F |
6.4.5 Kenya Alternators Market Revenues & Volume, By Standby Power, 2022-2032F |
6.4.6 Kenya Alternators Market Revenues & Volume, By Others, 2022-2032F |
6.5 Kenya Alternators Market, By Speed |
6.5.1 Overview and Analysis |
6.5.2 Kenya Alternators Market Revenues & Volume, By Low Speed Alternators, 2022-2032F |
6.5.3 Kenya Alternators Market Revenues & Volume, By Medium Speed Alternators, 2022-2032F |
6.5.4 Kenya Alternators Market Revenues & Volume, By High Speed Alternators, 2022-2032F |
6.5.5 Kenya Alternators Market Revenues & Volume, By Ultra High-Speed Alternators, 2022-2032F |
6.6 Kenya Alternators Market, By Weight |
6.6.1 Overview and Analysis |
6.6.2 Kenya Alternators Market Revenues & Volume, By Low Weight Alternators, 2022-2032F |
6.6.3 Kenya Alternators Market Revenues & Volume, By Medium Weight Alternators, 2022-2032F |
6.6.4 Kenya Alternators Market Revenues & Volume, By High Weight Alternators, 2022-2032F |
6.7 Kenya Alternators Market, By End-Use Sector |
6.7.1 Overview and Analysis |
6.7.2 Kenya Alternators Market Revenues & Volume, By Industrial, 2022-2032F |
6.7.3 Kenya Alternators Market Revenues & Volume, By Commercial, 2022-2032F |
6.7.4 Kenya Alternators Market Revenues & Volume, By , 2022-2032F |
6.8 Kenya Alternators Market, By Fuel Used |
6.8.1 Overview and Analysis |
6.8.2 Kenya Alternators Market Revenues & Volume, By Fossil fuel, 2022-2032F |
6.8.3 Kenya Alternators Market Revenues & Volume, By Natural, 2022-2032F |
7 Kenya Alternators Market Import-Export Trade Statistics |
7.1 Kenya Alternators Market Export to Major Countries |
7.2 Kenya Alternators Market Imports from Major Countries |
8 Kenya Alternators Market Key Performance Indicators |
8.1 Number of new renewable energy projects in Kenya |
8.2 Growth rate of the automotive and manufacturing sectors |
8.3 Adoption rate of energy-efficient technologies in the country |
8.4 Frequency of power outages in Kenya |
8.5 Number of skilled technicians trained in alternator maintenance |
9 Kenya Alternators Market - Opportunity Assessment |
9.1 Kenya Alternators Market Opportunity Assessment, By Type, 2022 & 2032F |
9.2 Kenya Alternators Market Opportunity Assessment, By Voltage, 2022 & 2032F |
9.3 Kenya Alternators Market Opportunity Assessment, By Rated Power, 2022 & 2032F |
9.4 Kenya Alternators Market Opportunity Assessment, By Application, 2022 & 2032F |
9.5 Kenya Alternators Market Opportunity Assessment, By Speed, 2022 & 2032F |
9.6 Kenya Alternators Market Opportunity Assessment, By Weight, 2022 & 2032F |
9.7 Kenya Alternators Market Opportunity Assessment, By End-Use Sector, 2022 & 2032F |
9.7 Kenya Alternators Market Opportunity Assessment, By Fuel Used, 2022 & 2032F |
10 Kenya Alternators Market - Competitive Landscape |
10.1 Kenya Alternators Market Revenue Share, By Companies, 2025 |
10.2 Kenya Alternators Market Competitive Benchmarking, By Operating and Technical Parameters |
11 Company Profiles |
12 Recommendations |
13 Disclaimer |
Global Go To Market Strategy - 2030
Export potential enables firms to identify high-growth global markets with greater confidence by combining advanced trade intelligence with a structured quantitative methodology. The framework analyzes emerging demand trends and country-level import patterns while integrating macroeconomic and trade datasets such as GDP and population forecasts, bilateral import–export flows, tariff structures, elasticity differentials between developed and developing economies, geographic distance, and import demand projections. Using weighted trade values from 2020–2024 as the base period to project country-to-country export potential for 2030, these inputs are operationalized through calculated drivers such as gravity model parameters, tariff impact factors, and projected GDP per-capita growth. Through an analysis of hidden potentials, demand hotspots, and market conditions that are most favorable to success, this method enables firms to focus on target countries, maximize returns, and global expansion with data, backed by accuracy.
By factoring in the projected importer demand gap that is currently unmet and could be potential opportunity, it identifies the potential for the Exporter (Country) among 190 countries, against the general trade analysis, which identifies the biggest importer or exporter.
To discover high-growth global markets and optimize your business strategy:
Click Here
Pricing
- Single User License$ 1,995
- Department License$ 2,400
- Site License$ 3,120
- Global License$ 3,795

Leadership Perspectives from Industry Events
Search
Thought Leadership and Analyst Meet


Our Clients
6WResearch In News
- India Air Conditioner Market Set for Strong Rebound in 2026 After Weather-Led Correction and GST-Driven Recovery: 6Wresearch
- ADAS in India: How Automatic Emergency Braking, Blind Spot Detection & Driver Monitoring are Transforming Road Safety
- Doha a strategic location for EV manufacturing hub: IPA Qatar
- Demand for luxury TVs surging in the GCC, says Samsung
- Empowering Growth: The Thriving Journey of Bangladesh’s Cable Industry
- Demand for luxury TVs surging in the GCC, says Samsung
Latest Reports
- Nicaragua RPG Gaming Market (2026-2032)
- New Zealand RPG Gaming Market (2026-2032)
- Netherlands RPG Gaming Market (2026-2032)
- Nauru RPG Gaming Market (2026-2032)
- Namibia RPG Gaming Market (2026-2032)
- Mozambique RPG Gaming Market (2026-2032)
- Montenegro RPG Gaming Market (2026-2032)
- Mongolia RPG Gaming Market (2026-2032)
- Monaco RPG Gaming Market (2026-2032)
- Micronesia RPG Gaming Market (2026-2032)
Industry Events and Analyst Meet

EV India Expo 2026

HIMTEX 2026

India Refining Summit 2026

India EV Show 2026

EV tech India Expo 2026
Whitepaper
- Middle East & Africa Commercial Security Market Click here to view more.
- Middle East & Africa Fire Safety Systems & Equipment Market Click here to view more.
- GCC Drone Market Click here to view more.
- Middle East Lighting Fixture Market Click here to view more.
- GCC Physical & Perimeter Security Market Click here to view more.