Kenya Caps & Closures Market Outlook | Industry, Size, Revenue, Forecast, Trends, Growth, Value, Analysis, COVID-19 IMPACT, Share & Companies
Market Forecast By Raw Material (Plastic, Metals, Others), By Type (Plastics Caps & Closures, Metal Caps & Closures , Other Caps & Closures), By End-Use (Food, Beverage, Healthcare, Cosmetics & toiletries, Others) And Competitive Landscape
| Product Code: ETC317030 | Publication Date: Aug 2022 | Updated Date: Aug 2025 | Product Type: Market Research Report | |
| Publisher: 6Wresearch | Author: Sumit Sagar | No. of Pages: 75 | No. of Figures: 35 | No. of Tables: 20 |
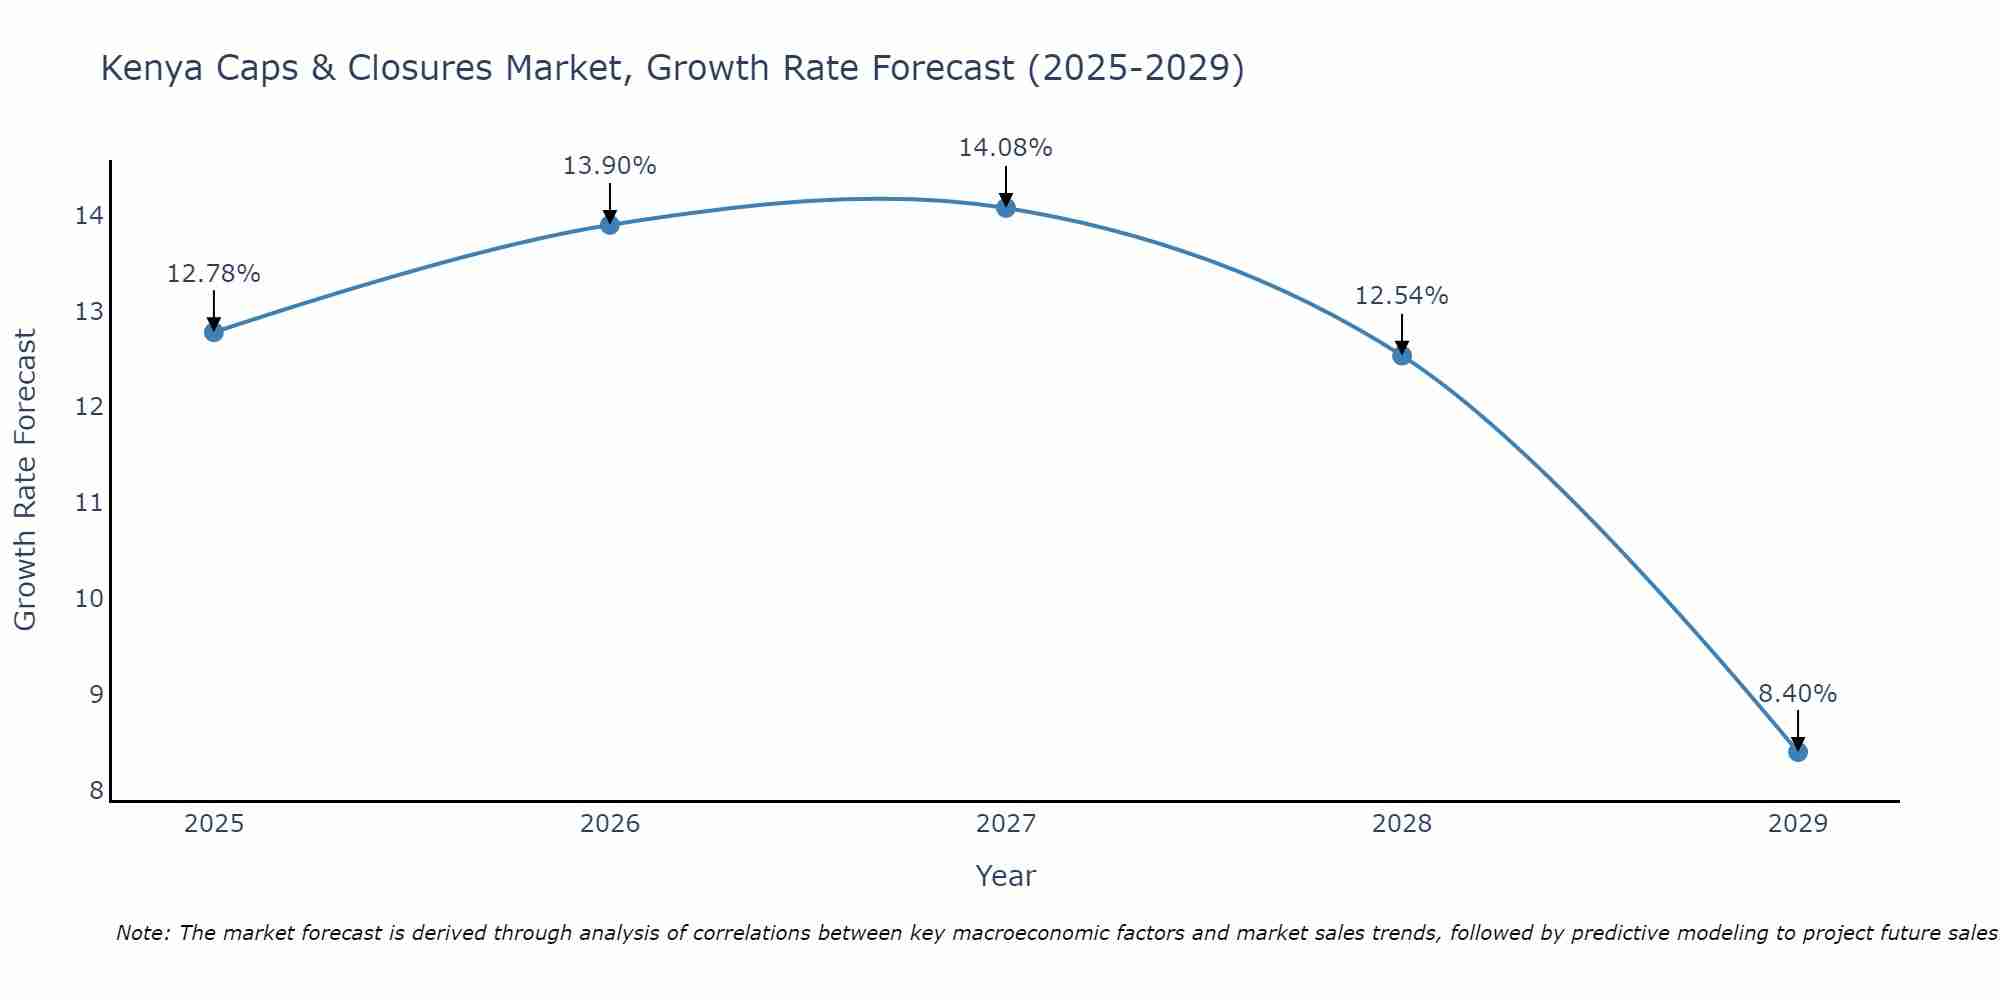
Kenya Caps & Closures Market Size Growth Rate
The Kenya Caps & Closures Market is projected to witness mixed growth rate patterns during 2025 to 2029. Starting at 12.78% in 2025, the market peaks at 14.08% in 2027, and settles at 8.40% by 2029.
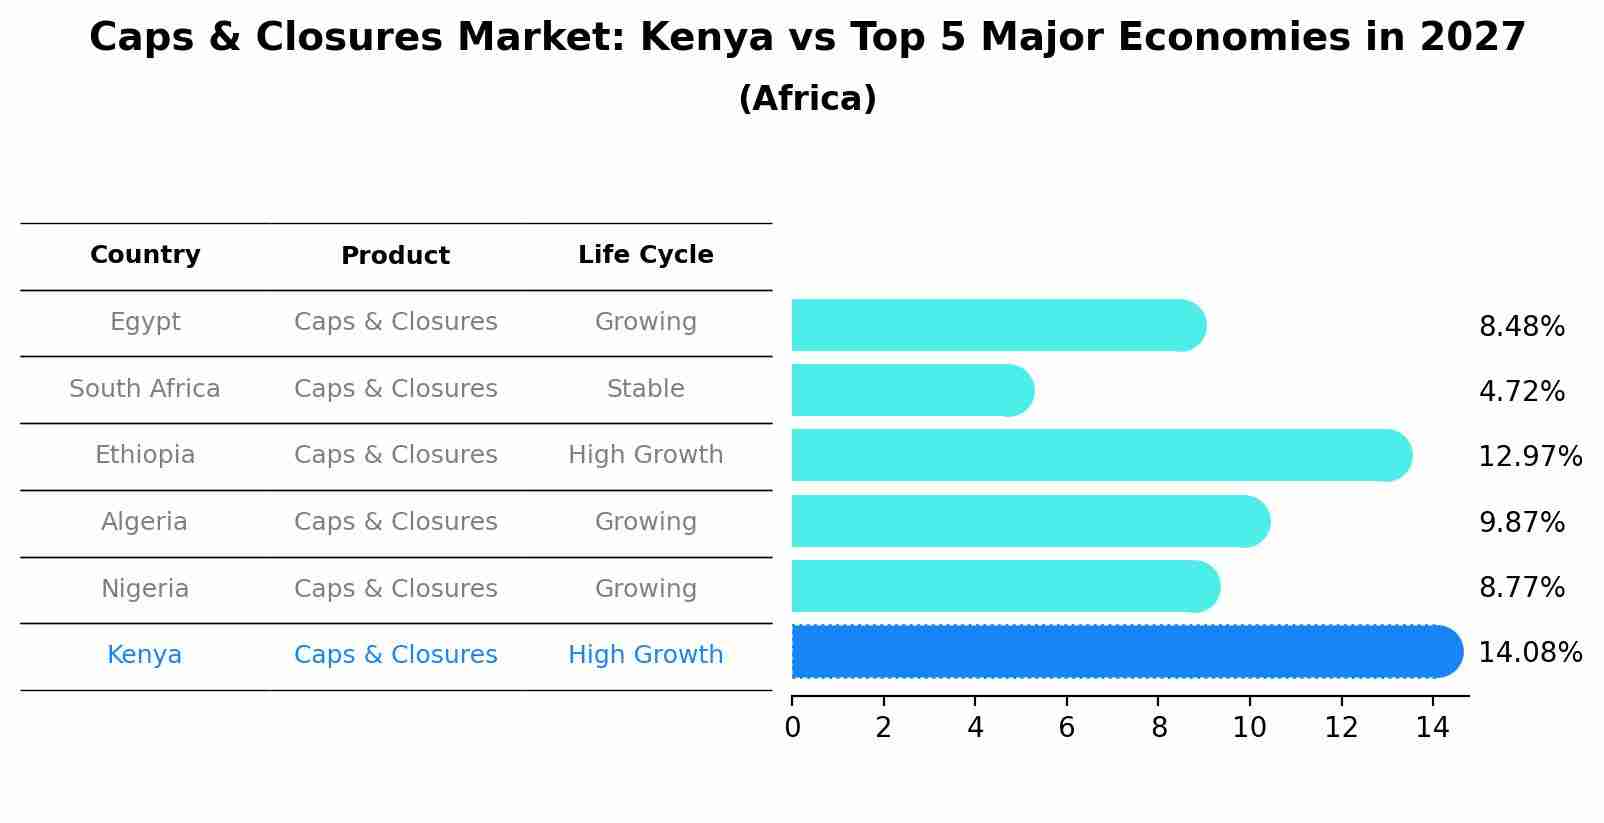
Caps & Closures Market: Kenya vs Top 5 Major Economies in 2027 (Africa)
By 2027, the Caps & Closures market in Kenya is anticipated to reach a growth rate of 14.08%, as part of an increasingly competitive Africa region, where Egypt remains at the forefront, supported by South Africa, Ethiopia, Algeria and Nigeria, driving innovations and market adoption across sectors.
Kenya Caps & Closures Market Synopsis
The Kenya caps and closures market is experiencing steady growth driven by the expanding food and beverage industry, pharmaceutical sector, and increasing demand for packaging solutions. The market is witnessing a shift towards innovative and sustainable closures to meet consumer preferences for convenience and environmental sustainability. Key players in the market are focusing on developing tamper-evident and child-resistant closures, as well as offering customizable solutions to cater to diverse product packaging needs. With the rising awareness of hygiene and product safety, there is a growing demand for high-quality caps and closures that ensure product integrity and prolong shelf life. The market is characterized by intense competition, leading to continuous product innovation and strategic partnerships among manufacturers to enhance their market presence and cater to evolving consumer demands.
Kenya Caps & Closures Market Trends
The Kenya Caps & Closures market is experiencing growth driven by increasing demand in the food and beverage industry, particularly in the dairy and bottled water sectors. Consumers are increasingly seeking convenience and sustainability, leading to a rise in the use of innovative caps and closures that offer easy opening and resealing features. Additionally, there is a growing emphasis on product safety and hygiene, prompting manufacturers to invest in tamper-evident and leak-proof closures. The market is also witnessing a shift towards eco-friendly materials such as biodegradable and recyclable plastics, in response to the rising environmental concerns. Overall, the Kenya Caps & Closures market is expected to continue expanding as companies focus on meeting evolving consumer preferences and regulatory requirements.
Kenya Caps & Closures Market Challenges
In the Kenya Caps & Closures Market, some of the key challenges faced include intense competition among local and international manufacturers, fluctuating raw material prices, and the need for constant innovation to meet changing consumer preferences. Additionally, issues related to counterfeit products and regulatory compliance pose significant hurdles for companies operating in this market. The high cost of production, transportation, and distribution also impact profitability for players in the caps and closures industry in Kenya. Overall, companies in this market need to navigate these challenges effectively through strategic pricing, product differentiation, and efficient supply chain management to stay competitive and ensure sustainable growth.
Kenya Caps & Closures Market Investment Opportunities
The Kenya caps and closures market presents promising investment opportunities driven by the country`s growing beverage, pharmaceutical, and cosmetic industries. With increasing demand for packaged goods, there is a need for high-quality caps and closures to ensure product safety and freshness. Investing in the production and distribution of innovative caps and closures that cater to specific industry requirements can be lucrative. Additionally, focusing on eco-friendly and sustainable packaging solutions aligns with the global trend towards environmental consciousness, offering a competitive edge in the market. Collaborating with local manufacturers and suppliers to streamline production processes and reduce costs can further enhance investment prospects in the Kenya caps and closures market.
Jordan Agar Market Government Policies
The Kenyan government has implemented various policies affecting the Caps & Closures Market, including the ban on single-use plastics in protected areas and the requirement for manufacturers to comply with standards set by the Kenya Bureau of Standards (KEBS). Additionally, there are regulations on labeling and packaging materials to ensure consumer safety and product information transparency. The government also encourages local production through initiatives like the Buy Kenya, Build Kenya policy, aimed at promoting domestic manufacturing and reducing reliance on imports. These policies aim to promote sustainability, quality control, and support local industries within the Caps & Closures Market in Kenya.
Kenya Caps & Closures Market Future Outlook
The future outlook for the Kenya Caps & Closures Market appears promising with steady growth anticipated in the coming years. Factors such as increasing demand for packaged goods, growth in the food and beverage industry, and rising disposable incomes are expected to drive the market. Additionally, the emphasis on sustainable packaging solutions and innovations in closure technologies are likely to further boost market growth. With a growing focus on convenience and hygiene, the demand for advanced caps and closures is expected to rise, presenting opportunities for manufacturers to expand their product offerings and cater to evolving consumer preferences. Overall, the Kenya Caps & Closures Market is poised for expansion, driven by changing consumer habits and industry trends.
Key Highlights of the Report:
- Kenya Caps & Closures Market Outlook
- Market Size of Kenya Caps & Closures Market, 2021
- Forecast of Kenya Caps & Closures Market, 2031
- Historical Data and Forecast of Kenya Caps & Closures Revenues & Volume for the Period 2018 - 2031
- Kenya Caps & Closures Market Trend Evolution
- Kenya Caps & Closures Market Drivers and Challenges
- Kenya Caps & Closures Price Trends
- Kenya Caps & Closures Porter's Five Forces
- Kenya Caps & Closures Industry Life Cycle
- Historical Data and Forecast of Kenya Caps & Closures Market Revenues & Volume By Raw Material for the Period 2018 - 2031
- Historical Data and Forecast of Kenya Caps & Closures Market Revenues & Volume By Plastic for the Period 2018 - 2031
- Historical Data and Forecast of Kenya Caps & Closures Market Revenues & Volume By Metals for the Period 2018 - 2031
- Historical Data and Forecast of Kenya Caps & Closures Market Revenues & Volume By Others for the Period 2018 - 2031
- Historical Data and Forecast of Kenya Caps & Closures Market Revenues & Volume By Type for the Period 2018 - 2031
- Historical Data and Forecast of Kenya Caps & Closures Market Revenues & Volume By Plastics Caps & Closures for the Period 2018 - 2031
- Historical Data and Forecast of Kenya Caps & Closures Market Revenues & Volume By Metal Caps & Closures for the Period 2018 - 2031
- Historical Data and Forecast of Kenya Caps & Closures Market Revenues & Volume By Other Caps & Closures for the Period 2018 - 2031
- Historical Data and Forecast of Kenya Caps & Closures Market Revenues & Volume By End-Use for the Period 2018 - 2031
- Historical Data and Forecast of Kenya Caps & Closures Market Revenues & Volume By Food for the Period 2018 - 2031
- Historical Data and Forecast of Kenya Caps & Closures Market Revenues & Volume By Beverage for the Period 2018 - 2031
- Historical Data and Forecast of Kenya Caps & Closures Market Revenues & Volume By Healthcare for the Period 2018 - 2031
- Historical Data and Forecast of Kenya Caps & Closures Market Revenues & Volume By Cosmetics & toiletries for the Period 2018 - 2031
- Historical Data and Forecast of Kenya Caps & Closures Market Revenues & Volume By Others for the Period 2018 - 2031
- Kenya Caps & Closures Import Export Trade Statistics
- Market Opportunity Assessment By Raw Material
- Market Opportunity Assessment By Type
- Market Opportunity Assessment By End-Use
- Kenya Caps & Closures Top Companies Market Share
- Kenya Caps & Closures Competitive Benchmarking By Technical and Operational Parameters
- Kenya Caps & Closures Company Profiles
- Kenya Caps & Closures Key Strategic Recommendations
Frequently Asked Questions About the Market Study (FAQs):
6Wresearch actively monitors the Kenya Caps & Closures Market and publishes its comprehensive annual report, highlighting emerging trends, growth drivers, revenue analysis, and forecast outlook. Our insights help businesses to make data-backed strategic decisions with ongoing market dynamics. Our analysts track relevent industries related to the Kenya Caps & Closures Market, allowing our clients with actionable intelligence and reliable forecasts tailored to emerging regional needs.
Yes, we provide customisation as per your requirements. To learn more, feel free to contact us on sales@6wresearch.com
1 Executive Summary |
2 Introduction |
2.1 Key Highlights of the Report |
2.2 Report Description |
2.3 Market Scope & Segmentation |
2.4 Research Methodology |
2.5 Assumptions |
3 Kenya Caps & Closures Market Overview |
3.1 Kenya Country Macro Economic Indicators |
3.2 Kenya Caps & Closures Market Revenues & Volume, 2021 & 2031F |
3.3 Kenya Caps & Closures Market - Industry Life Cycle |
3.4 Kenya Caps & Closures Market - Porter's Five Forces |
3.5 Kenya Caps & Closures Market Revenues & Volume Share, By Raw Material, 2021 & 2031F |
3.6 Kenya Caps & Closures Market Revenues & Volume Share, By Type, 2021 & 2031F |
3.7 Kenya Caps & Closures Market Revenues & Volume Share, By End-Use, 2021 & 2031F |
4 Kenya Caps & Closures Market Dynamics |
4.1 Impact Analysis |
4.2 Market Drivers |
4.2.1 Increasing demand for packaged goods in Kenya |
4.2.2 Growth in the pharmaceutical and healthcare sectors |
4.2.3 Rising adoption of advanced packaging solutions and technologies |
4.3 Market Restraints |
4.3.1 Fluctuating raw material prices |
4.3.2 Stringent regulations and standards for packaging materials in Kenya |
5 Kenya Caps & Closures Market Trends |
6 Kenya Caps & Closures Market, By Types |
6.1 Kenya Caps & Closures Market, By Raw Material |
6.1.1 Overview and Analysis |
6.1.2 Kenya Caps & Closures Market Revenues & Volume, By Raw Material, 2021-2031F |
6.1.3 Kenya Caps & Closures Market Revenues & Volume, By Plastic, 2021-2031F |
6.1.4 Kenya Caps & Closures Market Revenues & Volume, By Metals, 2021-2031F |
6.1.5 Kenya Caps & Closures Market Revenues & Volume, By Others, 2021-2031F |
6.2 Kenya Caps & Closures Market, By Type |
6.2.1 Overview and Analysis |
6.2.2 Kenya Caps & Closures Market Revenues & Volume, By Plastics Caps & Closures, 2021-2031F |
6.2.3 Kenya Caps & Closures Market Revenues & Volume, By Metal Caps & Closures , 2021-2031F |
6.2.4 Kenya Caps & Closures Market Revenues & Volume, By Other Caps & Closures, 2021-2031F |
6.3 Kenya Caps & Closures Market, By End-Use |
6.3.1 Overview and Analysis |
6.3.2 Kenya Caps & Closures Market Revenues & Volume, By Food, 2021-2031F |
6.3.3 Kenya Caps & Closures Market Revenues & Volume, By Beverage, 2021-2031F |
6.3.4 Kenya Caps & Closures Market Revenues & Volume, By Healthcare, 2021-2031F |
6.3.5 Kenya Caps & Closures Market Revenues & Volume, By Cosmetics & toiletries, 2021-2031F |
6.3.6 Kenya Caps & Closures Market Revenues & Volume, By Others, 2021-2031F |
7 Kenya Caps & Closures Market Import-Export Trade Statistics |
7.1 Kenya Caps & Closures Market Export to Major Countries |
7.2 Kenya Caps & Closures Market Imports from Major Countries |
8 Kenya Caps & Closures Market Key Performance Indicators |
8.1 Number of new product launches in the packaging industry in Kenya |
8.2 Investment in research and development for caps and closures in Kenya |
8.3 Adoption rate of sustainable and eco-friendly packaging solutions in Kenya's market |
9 Kenya Caps & Closures Market - Opportunity Assessment |
9.1 Kenya Caps & Closures Market Opportunity Assessment, By Raw Material, 2021 & 2031F |
9.2 Kenya Caps & Closures Market Opportunity Assessment, By Type, 2021 & 2031F |
9.3 Kenya Caps & Closures Market Opportunity Assessment, By End-Use, 2021 & 2031F |
10 Kenya Caps & Closures Market - Competitive Landscape |
10.1 Kenya Caps & Closures Market Revenue Share, By Companies, 2021 |
10.2 Kenya Caps & Closures Market Competitive Benchmarking, By Operating and Technical Parameters |
11 Company Profiles |
12 Recommendations |
13 Disclaimer |
Global Go To Market Strategy - 2030
Export potential enables firms to identify high-growth global markets with greater confidence by combining advanced trade intelligence with a structured quantitative methodology. The framework analyzes emerging demand trends and country-level import patterns while integrating macroeconomic and trade datasets such as GDP and population forecasts, bilateral import–export flows, tariff structures, elasticity differentials between developed and developing economies, geographic distance, and import demand projections. Using weighted trade values from 2020–2024 as the base period to project country-to-country export potential for 2030, these inputs are operationalized through calculated drivers such as gravity model parameters, tariff impact factors, and projected GDP per-capita growth. Through an analysis of hidden potentials, demand hotspots, and market conditions that are most favorable to success, this method enables firms to focus on target countries, maximize returns, and global expansion with data, backed by accuracy.
By factoring in the projected importer demand gap that is currently unmet and could be potential opportunity, it identifies the potential for the Exporter (Country) among 190 countries, against the general trade analysis, which identifies the biggest importer or exporter.
To discover high-growth global markets and optimize your business strategy:
Click Here
Pricing
- Single User License$ 1,995
- Department License$ 2,400
- Site License$ 3,120
- Global License$ 3,795

Leadership Perspectives from Industry Events
Search
Thought Leadership and Analyst Meet


Our Clients
6WResearch In News
- India Air Conditioner Market Set for Strong Rebound in 2026 After Weather-Led Correction and GST-Driven Recovery: 6Wresearch
- ADAS in India: How Automatic Emergency Braking, Blind Spot Detection & Driver Monitoring are Transforming Road Safety
- Doha a strategic location for EV manufacturing hub: IPA Qatar
- Demand for luxury TVs surging in the GCC, says Samsung
- Empowering Growth: The Thriving Journey of Bangladesh’s Cable Industry
- Demand for luxury TVs surging in the GCC, says Samsung
Latest Reports
- Nicaragua RPG Gaming Market (2026-2032)
- New Zealand RPG Gaming Market (2026-2032)
- Netherlands RPG Gaming Market (2026-2032)
- Nauru RPG Gaming Market (2026-2032)
- Namibia RPG Gaming Market (2026-2032)
- Mozambique RPG Gaming Market (2026-2032)
- Montenegro RPG Gaming Market (2026-2032)
- Mongolia RPG Gaming Market (2026-2032)
- Monaco RPG Gaming Market (2026-2032)
- Micronesia RPG Gaming Market (2026-2032)
Industry Events and Analyst Meet

EV India Expo 2026

HIMTEX 2026

India Refining Summit 2026

India EV Show 2026

EV tech India Expo 2026
Whitepaper
- Middle East & Africa Commercial Security Market Click here to view more.
- Middle East & Africa Fire Safety Systems & Equipment Market Click here to view more.
- GCC Drone Market Click here to view more.
- Middle East Lighting Fixture Market Click here to view more.
- GCC Physical & Perimeter Security Market Click here to view more.