Kenya Cassava Market | Revenue, Value, Analysis, Growth, Trends, Forecast, Companies, Size, Industry, COVID-19 IMPACT & Share
Market Forecast By Category (Organic, Conventional), By Form (Solid, Liquid), By Application (Food & Beverages, Animal Feed, Others) And Competitive Landscape
| Product Code: ETC176829 | Publication Date: Jan 2022 | Updated Date: Aug 2025 | Product Type: Market Research Report | |
| Publisher: 6Wresearch | Author: Ravi Bhandari | No. of Pages: 70 | No. of Figures: 35 | No. of Tables: 5 |
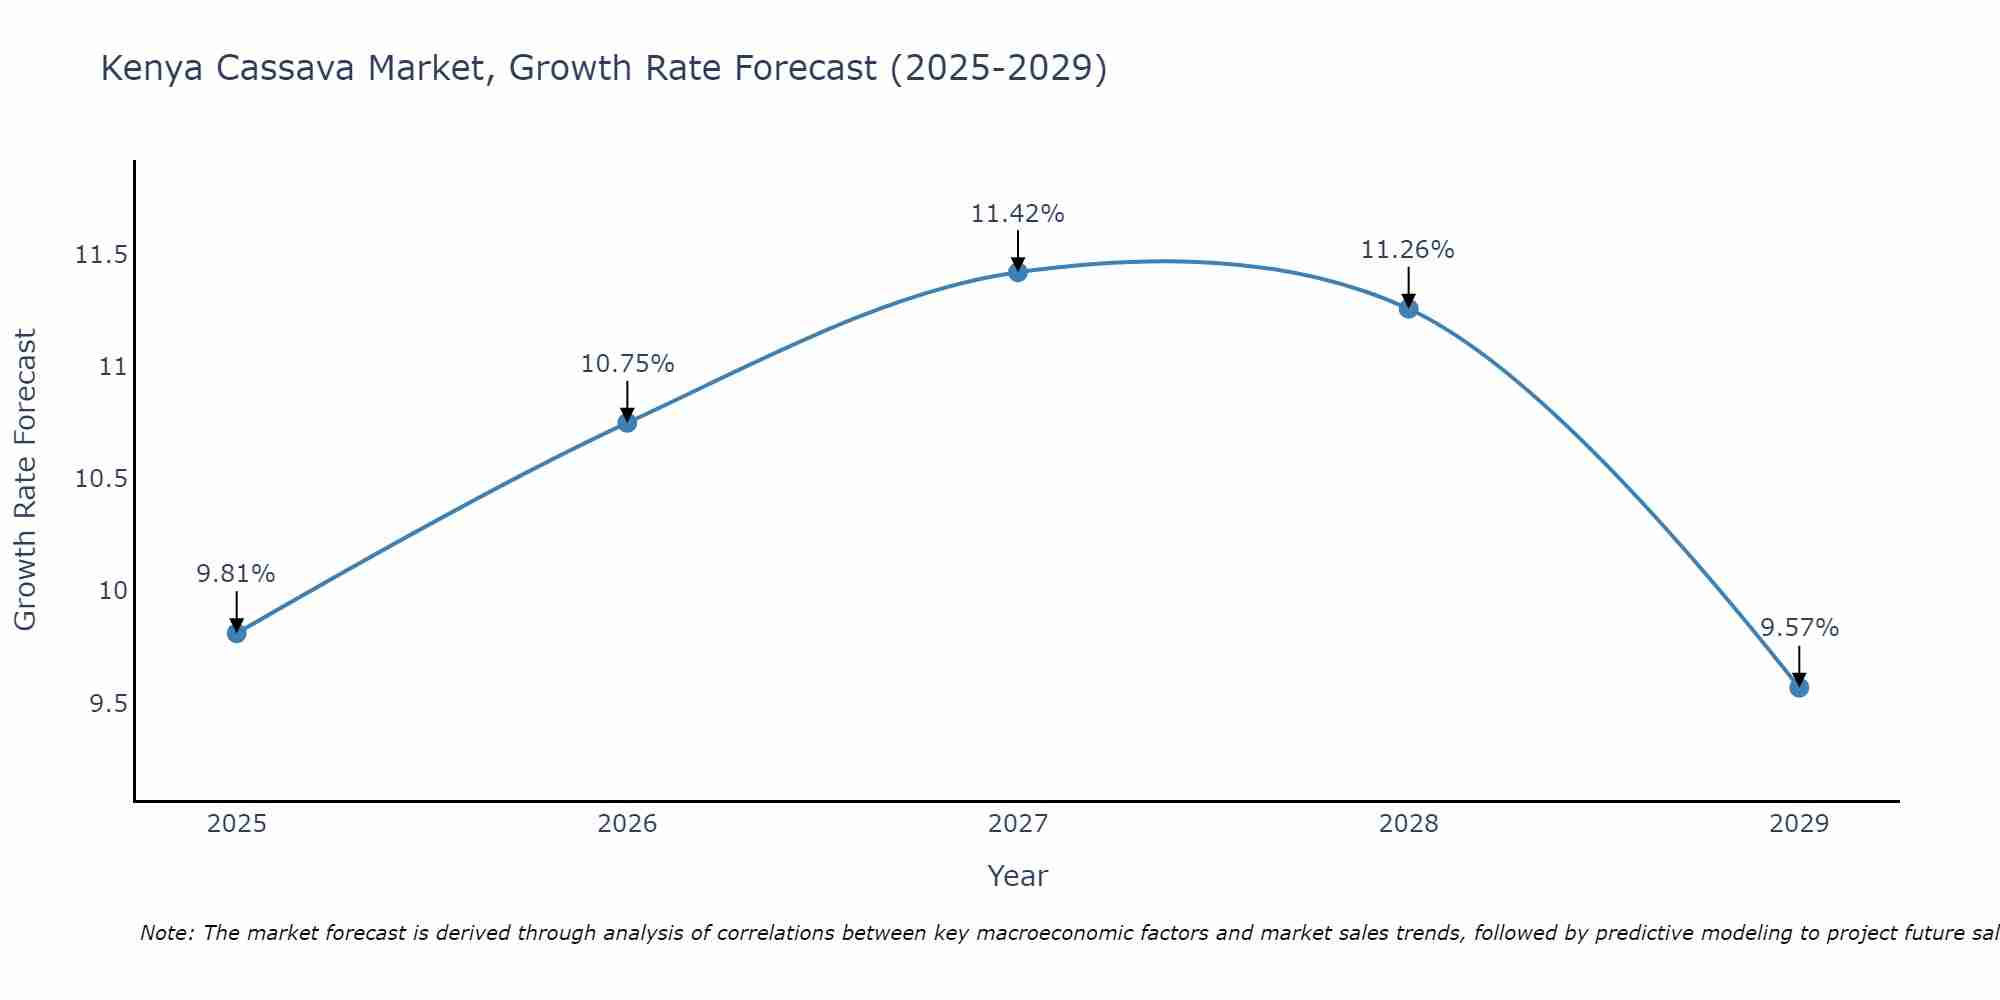
Kenya Cassava Market Size Growth Rate
The Kenya Cassava Market is projected to witness mixed growth rate patterns during 2025 to 2029. Starting at 9.81% in 2025, the market peaks at 11.42% in 2027, and settles at 9.57% by 2029.
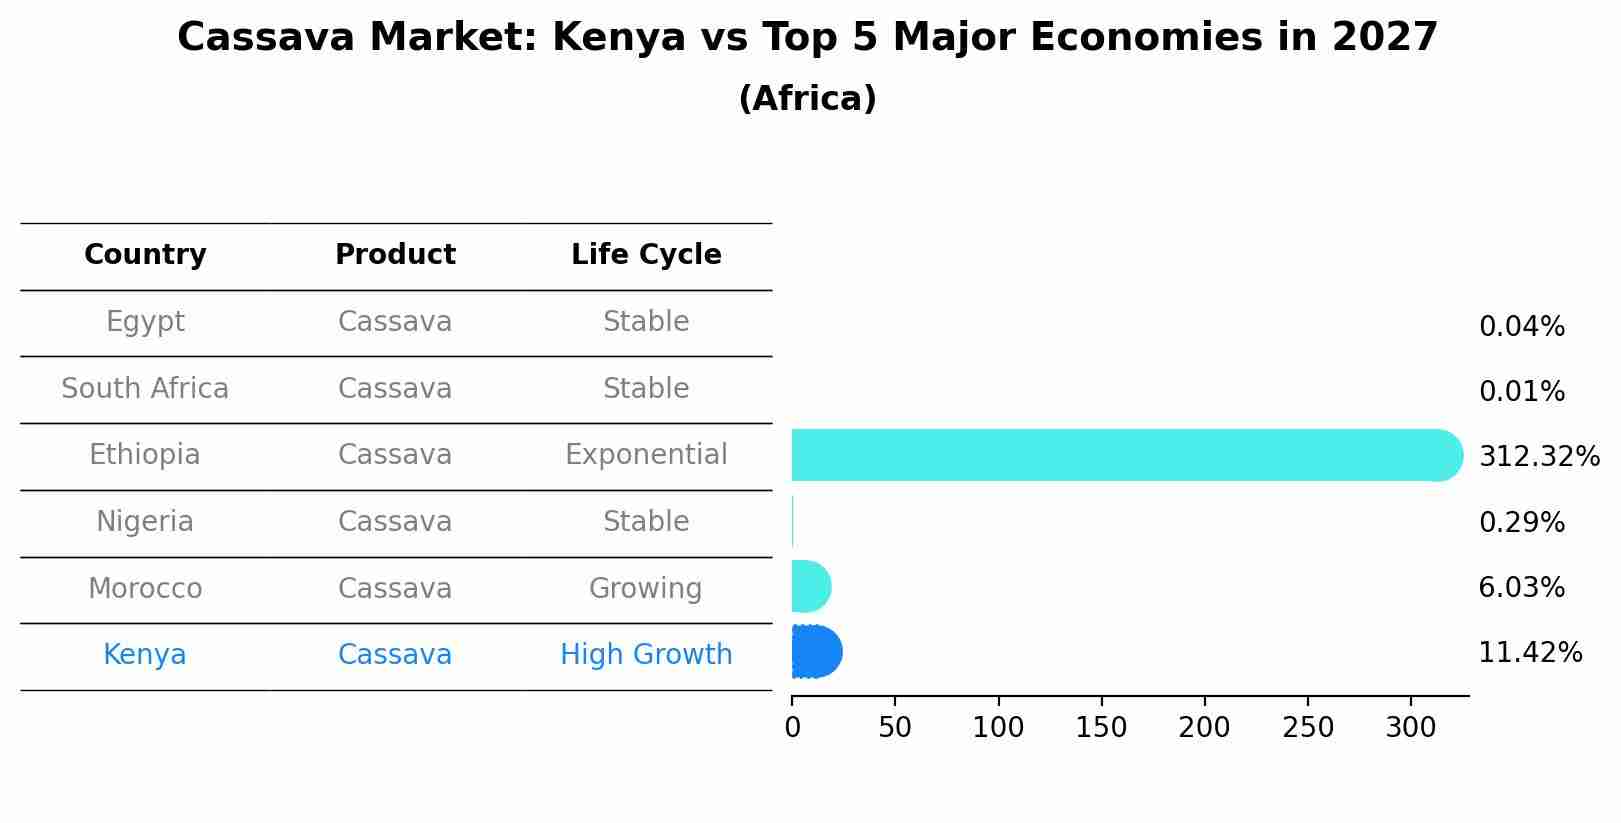
Cassava Market: Kenya vs Top 5 Major Economies in 2027 (Africa)
Kenya's Cassava market is anticipated to experience a high growth rate of 11.42% by 2027, reflecting trends observed in the largest economy Egypt, followed by South Africa, Ethiopia, Nigeria and Morocco.
Kenya Cassava Market Overview
Kenya Cassava Market is significant due to the crop`s role as a staple food and its industrial applications. Cassava is crucial for food security and provides raw material for industries producing starch, ethanol, and animal feed. Efforts to improve cassava cultivation, processing, and value addition are enhancing market prospects.
Drivers of the market
The Kenya cassava market is primarily driven by the increasing demand for cassava-based products both domestically and internationally. Cassava, being a versatile crop, finds applications in various industries such as food processing, animal feed production, and manufacturing of starch and flour. The rising population in Kenya coupled with changing dietary preferences towards convenience foods has led to a surge in the consumption of cassava-based products. Additionally, government initiatives promoting cassava cultivation as a means of enhancing food security and rural livelihoods further bolster the market growth.
Challenges of the market
The Kenya Cassava Market confronts several challenges. Firstly, addressing productivity constraints and yield limitations in cassava cultivation poses challenges for meeting growing demand and ensuring food security. Secondly, improving post-harvest handling and processing techniques is essential for reducing losses and enhancing product quality in the cassava value chain. Additionally, addressing market access and distribution challenges for smallholder cassava farmers requires investments in infrastructure and market linkages. Moreover, raising awareness about the nutritional benefits and versatile applications of cassava products is essential for stimulating demand and market growth. Finally, fostering research and development initiatives to improve cassava varieties and agronomic practices can help unlock the full potential of the crop in Kenya agriculture sector.
Government Policy of the market
The Kenya government has prioritized the development of the cassava market as part of its food security and rural development strategies. Policies include providing subsidies for cassava farming, investing in research to develop high-yield and disease-resistant varieties, and promoting value-added processing to increase market value. The government also facilitates access to domestic and international markets through trade agreements and infrastructure improvements.
Key Highlights of the Report:
- Kenya Cassava Market Outlook
- Market Size of Kenya Cassava Market, 2021
- Forecast of Kenya Cassava Market, 2028
- Historical Data and Forecast of Kenya Cassava Revenues & Volume for the Period 2018 - 2028
- Kenya Cassava Market Trend Evolution
- Kenya Cassava Market Drivers and Challenges
- Kenya Cassava Price Trends
- Kenya Cassava Porter's Five Forces
- Kenya Cassava Industry Life Cycle
- Historical Data and Forecast of Kenya Cassava Market Revenues & Volume By Category for the Period 2018 - 2028
- Historical Data and Forecast of Kenya Cassava Market Revenues & Volume By Organic for the Period 2018 - 2028
- Historical Data and Forecast of Kenya Cassava Market Revenues & Volume By Conventional for the Period 2018 - 2028
- Historical Data and Forecast of Kenya Cassava Market Revenues & Volume By Form for the Period 2018 - 2028
- Historical Data and Forecast of Kenya Cassava Market Revenues & Volume By Solid for the Period 2018 - 2028
- Historical Data and Forecast of Kenya Cassava Market Revenues & Volume By Liquid for the Period 2018 - 2028
- Historical Data and Forecast of Kenya Cassava Market Revenues & Volume By Application for the Period 2018 - 2028
- Historical Data and Forecast of Kenya Cassava Market Revenues & Volume By Food & Beverages for the Period 2018 - 2028
- Historical Data and Forecast of Kenya Cassava Market Revenues & Volume By Animal Feed for the Period 2018 - 2028
- Historical Data and Forecast of Kenya Cassava Market Revenues & Volume By Others for the Period 2018 - 2028
- Kenya Cassava Import Export Trade Statistics
- Market Opportunity Assessment By Category
- Market Opportunity Assessment By Form
- Market Opportunity Assessment By Application
- Kenya Cassava Top Companies Market Share
- Kenya Cassava Competitive Benchmarking By Technical and Operational Parameters
- Kenya Cassava Company Profiles
- Kenya Cassava Key Strategic Recommendations
Frequently Asked Questions About the Market Study (FAQs):
6Wresearch actively monitors the Kenya Cassava Market and publishes its comprehensive annual report, highlighting emerging trends, growth drivers, revenue analysis, and forecast outlook. Our insights help businesses to make data-backed strategic decisions with ongoing market dynamics. Our analysts track relevent industries related to the Kenya Cassava Market, allowing our clients with actionable intelligence and reliable forecasts tailored to emerging regional needs.
Yes, we provide customisation as per your requirements. To learn more, feel free to contact us on sales@6wresearch.com
1 Executive Summary |
2 Introduction |
2.1 Key Highlights of the Report |
2.2 Report Description |
2.3 Market Scope & Segmentation |
2.4 Research Methodology |
2.5 Assumptions |
3 Kenya Cassava Market Overview |
3.1 Kenya Country Macro Economic Indicators |
3.2 Kenya Cassava Market Revenues & Volume, 2021 & 2028F |
3.3 Kenya Cassava Market - Industry Life Cycle |
3.4 Kenya Cassava Market - Porter's Five Forces |
3.5 Kenya Cassava Market Revenues & Volume Share, By Category, 2021 & 2028F |
3.6 Kenya Cassava Market Revenues & Volume Share, By Form, 2021 & 2028F |
3.7 Kenya Cassava Market Revenues & Volume Share, By Application, 2021 & 2028F |
4 Kenya Cassava Market Dynamics |
4.1 Impact Analysis |
4.2 Market Drivers |
4.2.1 Increasing demand for gluten-free and healthier food alternatives |
4.2.2 Growing awareness about the nutritional benefits of cassava |
4.2.3 Government initiatives to promote cassava cultivation and processing |
4.3 Market Restraints |
4.3.1 Lack of infrastructure for efficient cassava production and distribution |
4.3.2 Vulnerability to climate change and pest infestations |
4.3.3 Limited access to technology and modern farming practices |
5 Kenya Cassava Market Trends |
6 Kenya Cassava Market, By Types |
6.1 Kenya Cassava Market, By Category |
6.1.1 Overview and Analysis |
6.1.2 Kenya Cassava Market Revenues & Volume, By Category, 2018 - 2028F |
6.1.3 Kenya Cassava Market Revenues & Volume, By Organic, 2018 - 2028F |
6.1.4 Kenya Cassava Market Revenues & Volume, By Conventional, 2018 - 2028F |
6.2 Kenya Cassava Market, By Form |
6.2.1 Overview and Analysis |
6.2.2 Kenya Cassava Market Revenues & Volume, By Solid, 2018 - 2028F |
6.2.3 Kenya Cassava Market Revenues & Volume, By Liquid, 2018 - 2028F |
6.3 Kenya Cassava Market, By Application |
6.3.1 Overview and Analysis |
6.3.2 Kenya Cassava Market Revenues & Volume, By Food & Beverages , 2018 - 2028F |
6.3.3 Kenya Cassava Market Revenues & Volume, By Animal Feed, 2018 - 2028F |
6.3.4 Kenya Cassava Market Revenues & Volume, By Others, 2018 - 2028F |
7 Kenya Cassava Market Import-Export Trade Statistics |
7.1 Kenya Cassava Market Export to Major Countries |
7.2 Kenya Cassava Market Imports from Major Countries |
8 Kenya Cassava Market Key Performance Indicators |
8.1 Average yield per hectare of cassava cultivation |
8.2 Adoption rate of improved cassava varieties |
8.3 Percentage of cassava farmers using sustainable farming practices |
8.4 Number of cassava processing facilities established |
8.5 Percentage increase in cassava value addition activities |
9 Kenya Cassava Market - Opportunity Assessment |
9.1 Kenya Cassava Market Opportunity Assessment, By Category, 2021 & 2028F |
9.2 Kenya Cassava Market Opportunity Assessment, By Form, 2021 & 2028F |
9.3 Kenya Cassava Market Opportunity Assessment, By Application, 2021 & 2028F |
10 Kenya Cassava Market - Competitive Landscape |
10.1 Kenya Cassava Market Revenue Share, By Companies, 2021 |
10.2 Kenya Cassava Market Competitive Benchmarking, By Operating and Technical Parameters |
11 Company Profiles |
12 Recommendations |
13 Disclaimer |
Global Go To Market Strategy - 2030
Export potential enables firms to identify high-growth global markets with greater confidence by combining advanced trade intelligence with a structured quantitative methodology. The framework analyzes emerging demand trends and country-level import patterns while integrating macroeconomic and trade datasets such as GDP and population forecasts, bilateral import–export flows, tariff structures, elasticity differentials between developed and developing economies, geographic distance, and import demand projections. Using weighted trade values from 2020–2024 as the base period to project country-to-country export potential for 2030, these inputs are operationalized through calculated drivers such as gravity model parameters, tariff impact factors, and projected GDP per-capita growth. Through an analysis of hidden potentials, demand hotspots, and market conditions that are most favorable to success, this method enables firms to focus on target countries, maximize returns, and global expansion with data, backed by accuracy.
By factoring in the projected importer demand gap that is currently unmet and could be potential opportunity, it identifies the potential for the Exporter (Country) among 190 countries, against the general trade analysis, which identifies the biggest importer or exporter.
To discover high-growth global markets and optimize your business strategy:
Click Here
Pricing
- Single User License$ 1,995
- Department License$ 2,400
- Site License$ 3,120
- Global License$ 3,795

Leadership Perspectives from Industry Events
Search
Thought Leadership and Analyst Meet


Our Clients
6WResearch In News
- Doha a strategic location for EV manufacturing hub: IPA Qatar
- Demand for luxury TVs surging in the GCC, says Samsung
- Empowering Growth: The Thriving Journey of Bangladesh’s Cable Industry
- Demand for luxury TVs surging in the GCC, says Samsung
- Video call with a traditional healer? Once unthinkable, it’s now common in South Africa
- Intelligent Buildings To Smooth GCC’s Path To Net Zero
Latest Reports
- Cape Verde Portable Hand-Thrown Extinguisher Market (2026-2032)
- Canada Portable Hand-Thrown Extinguisher Market (2026-2032)
- Cameroon Portable Hand-Thrown Extinguisher Market (2026-2032)
- Burundi Portable Hand-Thrown Extinguisher Market (2026-2032)
- Burkina Faso Portable Hand-Thrown Extinguisher Market (2026-2032)
- Bulgaria Portable Hand-Thrown Extinguisher Market (2026-2032)
- Brunei Portable Hand-Thrown Extinguisher Market (2026-2032)
- Botswana Portable Hand-Thrown Extinguisher Market (2026-2032)
- Bosnia and Herzegovina Portable Hand-Thrown Extinguisher Market (2026-2032)
- Bolivia Portable Hand-Thrown Extinguisher Market (2026-2032)
Industry Events and Analyst Meet

HIMTEX 2026

India Refining Summit 2026

India EV Show 2026

EV tech India Expo 2026

Auto Tech Asia 2026
Whitepaper
- Middle East & Africa Commercial Security Market Click here to view more.
- Middle East & Africa Fire Safety Systems & Equipment Market Click here to view more.
- GCC Drone Market Click here to view more.
- Middle East Lighting Fixture Market Click here to view more.
- GCC Physical & Perimeter Security Market Click here to view more.