Kenya Chemotherapy Market (2026-2032) | Growth, Forecast, Size, Share, Industry, Companies, Analysis, Trends, Revenue, Outlook & Value
Market Forecast By Drug Class (Alkylating Agents, Mitotic Inhibitors, Antimetabolites, Topoisomerase Inhibitors, Antitumor Antibiotic), By Indication (Lung Cancer, Breast Cancer, Colorectal Cancer, Prostate Cancer, Stomach Cancer, Lymphoma, Leukemia, Ovarian Cancer), By Route of Drug Administration (Intravenous, Oral, Subcutaneous, Intra-Muscular, Intravesicular, Topical, Intraperitoneal, Intraventricular/Intrathecal), By End-Users (Specialty Centers, Hospitals & Clinics) And Competitive Landscape
| Product Code: ETC044970 | Publication Date: Jan 2021 | Updated Date: Jun 2026 | Product Type: Report | |
| Publisher: 6Wresearch | Author: Summon Dutta | No. of Pages: 70 | No. of Figures: 35 | No. of Tables: 5 |
Kenya Chemotherapy Market Summary
The kenya chemotherapy market was estimated at USD 462 Million in 2025 and is projected to reach USD 661 Million by 2032, growing at a CAGR of 6.3% from 2026 to 2032.
Kenya Chemotherapy Market Growth Rate Analysis (2021-2032)
The Kenya chemotherapy market has exhibited stable growth, with annual increases fluctuating around the 6% mark. In 2021, the market grew by 6.4%, driven largely by heightened cancer awareness and the expansion of healthcare infrastructure. This annual growth rate remained steady at 6.0% in both 2022 and 2023, as investments in technology and training for healthcare professionals supported improved treatment accessibility. Anticipated growth continues, with 6.4% expected in 2024, reflecting ongoing government initiatives and increasing consumer demand for effective cancer treatments. However, a slight dip to 5.8% by 2027 indicates potential pressures from fluctuating economic conditions. Projections suggest renewed momentum, with a rise to 6.5% in 2032, supported by advancements in digital health solutions and pharmaceutical innovations.
Kenya Chemotherapy Market Year-wise Growth Rate and Key Drivers
This graph highlights how the Kenya Chemotherapy Market has steadily grown over the past five years, supported by major growth factors.
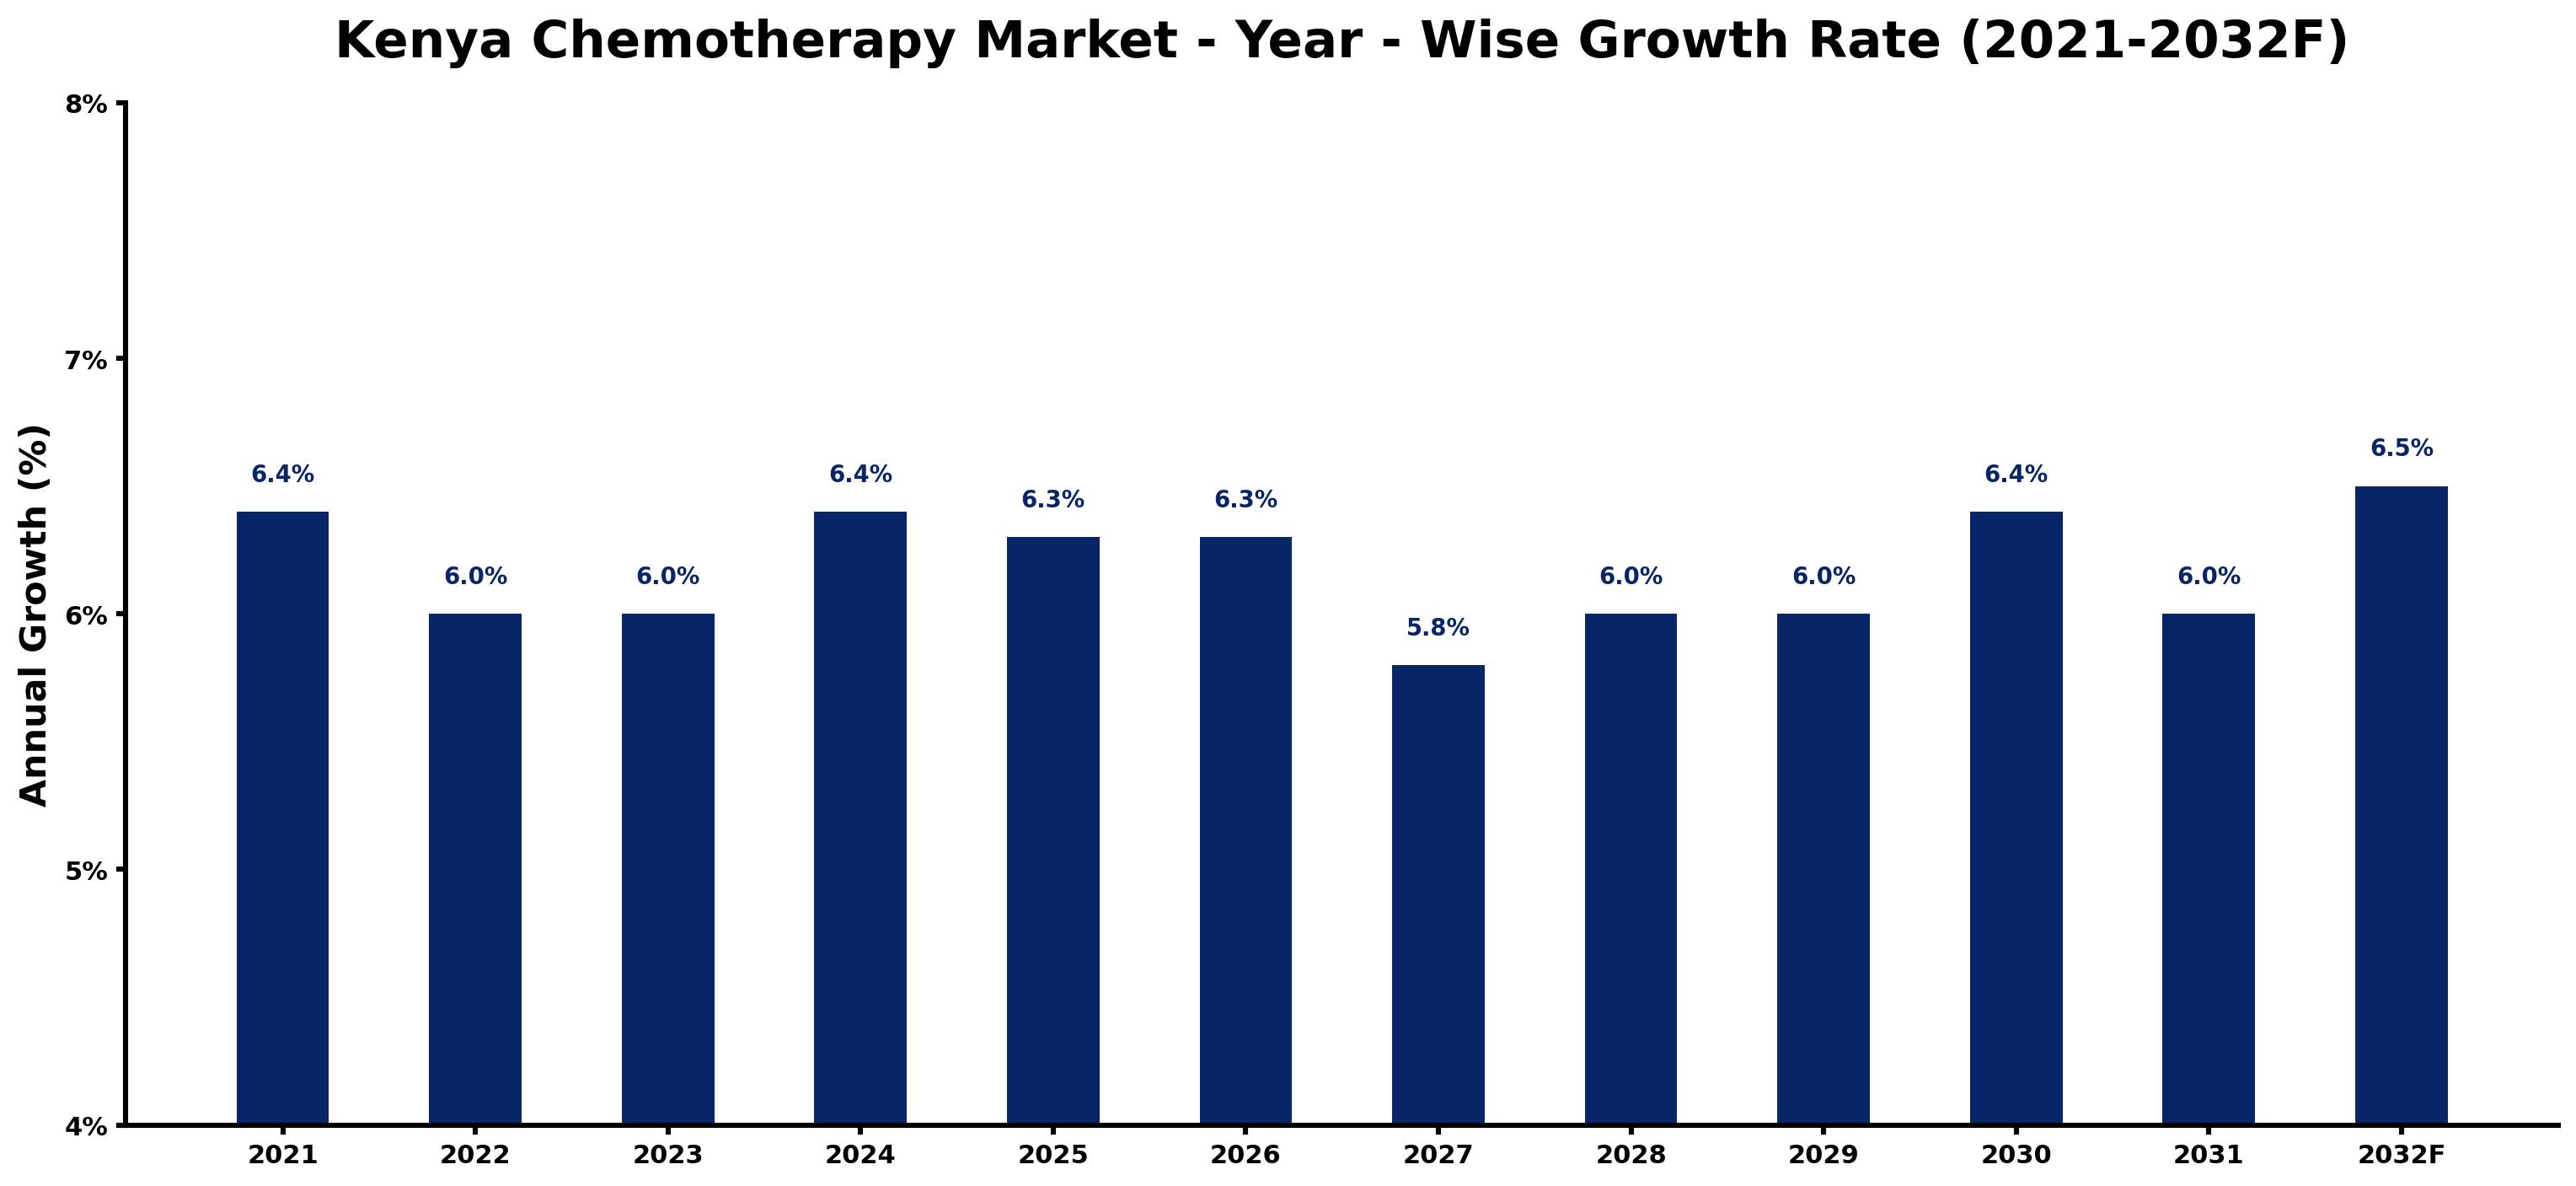
The table below presents the year wise growth rates along with the key drivers influencing the market
| Year | Growth Rate | Major Drivers |
| 2021 | 6.4% | Increased awareness of cancer treatment options has fostered patient engagement in Kenya. |
| 2022 | 6.0% | Local pharmaceutical companies introduced affordable chemotherapy drugs, enhancing patient accessibility. |
| 2023 | 6.0% | The growth of public-private partnerships is streamlining chemotherapy service delivery. |
| 2024 | 6.4% | Healthcare infrastructure improvements are crucial for supporting comprehensive cancer treatment. |
| 2025 | 6.3% | Telemedicine services are bridging gaps between patients and oncologists in remote areas. |
| 2026 | 6.3% | Emerging research institutions are contributing to innovative cancer treatment methodologies. |
| 2027 | 5.8% | The local production of chemotherapy agents is reducing dependency on imports significantly. |
| 2028 | 6.0% | A growing insurance penetration rate is improving financial coverage for oncology treatments. |
| 2029 | 6.0% | Patient advocacy groups are amplifying voices for better healthcare policies and support. |
| 2030 | 6.4% | Technological integration in hospitals enhances treatment protocols and patient management systems. |
| 2031 | 6.0% | International collaborations are facilitating knowledge transfer and best practices in oncology. |
| 2032 | 6.5% | Public awareness campaigns effectively educate communities about early diagnosis and treatment. |
Note - Market size estimations and growth projections presented in this report are based on 6Wresearch's advanced forecasting approach, validated with industry datasets as of June 2026.
Kenya Chemotherapy Market Synopsis
The Kenya Chemotherapy Market is projected to reach 6.3% and witness significant growth during the forecast period (2026-2032). This growth can be attributed to the escalating incidence rates of cancer, enhanced healthcare infrastructure, and heightened awareness regarding the efficacy of chemotherapy as a treatment modality for various cancer types. The demand for chemotherapy drugs, equipment, and related services is primarily fueled by the increasing number of cancer patients, necessitating a comprehensive approach to oncology care.
Kenya Chemotherapy Market Growth Drivers
Several key factors are propelling the expansion of the Kenya chemotherapy market. Firstly, the rising cancer prevalence, attributed to lifestyle changes and environmental factors, is creating an urgent need for effective treatment options. Additionally, significant improvements in healthcare facilities, coupled with better access to medical services, have enhanced patient outcomes. Furthermore, the increased awareness among patients and healthcare providers about the role of chemotherapy in cancer treatment has led to a surge in demand for relevant therapies.
Kenya Chemotherapy Market Trends and Opportunities
The Kenya chemotherapy market is witnessing transformative trends that present numerous opportunities for growth. One prominent trend is the growing adoption of targeted therapies, which are designed to attack cancer cells more precisely while minimizing collateral damage to healthy tissue. Alongside this, personalized medicine is gaining traction, emphasizing the importance of genetic profiling to tailor treatment to individual patient needs. Moreover, the demand for oral chemotherapy has been increasing, as these treatments offer enhanced convenience for patients, allowing them to manage their regimens more easily.
Additionally, advancements in research and technology are facilitating the introduction of innovative treatment protocols, further driving the market. As healthcare expenditure continues to rise, there is ample opportunity for stakeholders to invest in developing new drugs and therapies that meet local needs.
Kenya Chemotherapy Market Challenges and Restraints
Despite the favorable growth trajectory, the Kenya chemotherapy market faces several challenges that could impede its progress. Foremost among these is the high cost of chemotherapy drugs, making treatment inaccessible for a significant portion of the population. Many patients find themselves unable to afford necessary medications, which contributes to subpar health outcomes.
Additionally, the shortage of trained healthcare professionals, especially in rural areas, limits the availability of specialized oncology care. The lack of comprehensive cancer screening programs further exacerbates late-stage diagnoses, which can reduce the effectiveness of chemotherapy treatment. Addressing these challenges requires systemic investment in healthcare infrastructure, ensuring that therapies are both affordable and accessible to all segments of the population.
Kenya Chemotherapy Market Government Investment and Initiatives
The Kenyan government is actively engaged in establishing a robust framework to support the chemotherapy market. The National Cancer Control Strategy represents a pivotal initiative aimed at enhancing cancer prevention, diagnosis, treatment, and palliative care services. This includes a significant emphasis on chemotherapy services to ensure that patients receive timely and effective treatment.
Moreover, the establishment of the National Cancer Institute plays a crucial role in coordinating cancer control measures, promoting research, and facilitating training for healthcare providers in oncology. Regulatory oversight provided by the Pharmacy and Poisons Board ensures that the importation, distribution, and utilization of chemotherapy drugs adhere to stringent quality and safety standards. Collectively, these initiatives reflect the government's commitment to addressing the growing cancer burden and improving healthcare outcomes across the nation.
Kenya Chemotherapy Market Latest Developments (May 2025 - June 2026)
In the period from May 2025 to June 2026, the Kenya chemotherapy market has seen notable developments that signal a progressive shift in the industry. The government has expanded funding for cancer-related healthcare initiatives, resulting in improved access to chemotherapy treatments for underserved populations. Hospitals and clinics have begun implementing cutting-edge treatment regimens that incorporate both traditional chemotherapy and newer modalities, such as immunotherapy.
Furthermore, educational campaigns aimed at raising awareness about cancer prevention and treatment options have been intensified, contributing to earlier diagnoses and better patient outcomes. The collaboration between public and private sectors has also strengthened, fostering innovation and ensuring that patients receive the latest therapeutic advancements in the oncology field.
Kenya Chemotherapy Market - Key Attractiveness of the Report
- 10 Years of Market Numbers
- Historical Data Starting from 2022 to 2025
- Base Year: 2025
- Forecast Data until 2032
- Key Performance Indicators Impacting the Market
- Major Upcoming Developments and Projects
Key Highlights of the Report:
- Kenya Chemotherapy? Market Outlook
- Market Size of Kenya Chemotherapy? Market, 2025
- Forecast of Kenya Chemotherapy? Market, 2032
- Historical Data and Forecast of Kenya Chemotherapy? Revenues & Volume for the Period 2022-2032F
- Kenya Chemotherapy? Market Trend Evolution
- Kenya Chemotherapy? Market Drivers and Challenges
- Kenya Chemotherapy? Price Trends
- Kenya Chemotherapy? Porter's Five Forces
- Kenya Chemotherapy? Industry Life Cycle
- Historical Data and Forecast of Kenya Chemotherapy? Market Revenues & Volume By Drug Class for the Period 2022-2032F
- Historical Data and Forecast of Kenya Chemotherapy? Market Revenues & Volume By Alkylating Agents for the Period 2022-2032F
- Historical Data and Forecast of Kenya Chemotherapy? Market Revenues & Volume By Mitotic Inhibitors for the Period 2022-2032F
- Historical Data and Forecast of Kenya Chemotherapy? Market Revenues & Volume By Antimetabolites for the Period 2022-2032F
- Historical Data and Forecast of Kenya Chemotherapy? Market Revenues & Volume By Topoisomerase Inhibitors for the Period 2022-2032F
- Historical Data and Forecast of Kenya Chemotherapy? Market Revenues & Volume By Antitumor Antibiotic for the Period 2022-2032F
- Historical Data and Forecast of Kenya Chemotherapy? Market Revenues & Volume By Indication for the Period 2022-2032F
- Historical Data and Forecast of Kenya Chemotherapy? Market Revenues & Volume By Lung Cancer for the Period 2022-2032F
- Historical Data and Forecast of Kenya Chemotherapy? Market Revenues & Volume By Breast Cancer for the Period 2022-2032F
- Historical Data and Forecast of Kenya Chemotherapy? Market Revenues & Volume By Colorectal Cancer for the Period 2022-2032F
- Historical Data and Forecast of Kenya Chemotherapy? Market Revenues & Volume By Prostate Cancer for the Period 2022-2032F
- Historical Data and Forecast of Kenya Chemotherapy? Market Revenues & Volume By Stomach Cancer for the Period 2022-2032F
- Historical Data and Forecast of Kenya Chemotherapy? Market Revenues & Volume By Lymphoma for the Period 2022-2032F
- Historical Data and Forecast of Kenya Chemotherapy? Market Revenues & Volume By Leukemia for the Period 2022-2032F
- Historical Data and Forecast of Kenya Chemotherapy? Market Revenues & Volume By Ovarian Cancer for the Period 2022-2032F
- Historical Data and Forecast of Kenya Chemotherapy? Market Revenues & Volume By Route of Drug Administration for the Period 2022-2032F
- Historical Data and Forecast of Kenya Chemotherapy? Market Revenues & Volume By Intravenous for the Period 2022-2032F
- Historical Data and Forecast of Kenya Chemotherapy? Market Revenues & Volume By Oral for the Period 2022-2032F
- Historical Data and Forecast of Kenya Chemotherapy? Market Revenues & Volume By Subcutaneous for the Period 2022-2032F
- Historical Data and Forecast of Kenya Chemotherapy? Market Revenues & Volume By Intra-Muscular for the Period 2022-2032F
- Historical Data and Forecast of Kenya Chemotherapy? Market Revenues & Volume By Intravesicular for the Period 2022-2032F
- Historical Data and Forecast of Kenya Chemotherapy? Market Revenues & Volume By Topical for the Period 2022-2032F
- Historical Data and Forecast of Kenya Chemotherapy? Market Revenues & Volume By Intraperitoneal for the Period 2022-2032F
- Historical Data and Forecast of Kenya Chemotherapy? Market Revenues & Volume By Intraventricular/Intrathecal for the Period 2022-2032F
- Historical Data and Forecast of Kenya Chemotherapy? Market Revenues & Volume By End-Users for the Period 2022-2032F
- Historical Data and Forecast of Kenya Chemotherapy? Market Revenues & Volume By Specialty Centers for the Period 2022-2032F
- Historical Data and Forecast of Kenya Chemotherapy? Market Revenues & Volume By Hospitals & Clinics for the Period 2022-2032F
- Kenya Chemotherapy? Import Export Trade Statistics
- Market Opportunity Assessment By Drug Class
- Market Opportunity Assessment By Indication
- Market Opportunity Assessment By Route of Drug Administration
- Market Opportunity Assessment By End-Users
- Kenya Chemotherapy? Top Companies Market Share
- Kenya Chemotherapy? Competitive Benchmarking By Technical and Operational Parameters
- Kenya Chemotherapy? Company Profiles
- Kenya Chemotherapy? Key Strategic Recommendations
Frequently Asked Questions About the Market Study (FAQs):
The growth is driven by increasing cancer incidence, enhanced healthcare infrastructure, and rising awareness about treatment options.
Key challenges include high costs of treatment, limited access to specialized care, and inadequate healthcare resources.
The government is implementing strategies focused on cancer control, increasing funding for healthcare initiatives, and enhancing regulatory oversight.
Opportunities lie in the development of targeted therapies, investments in healthcare infrastructure, and expanding access to affordable chemotherapy services.
6Wresearch actively monitors the Kenya Chemotherapy Market and publishes its comprehensive annual report, highlighting emerging trends, growth drivers, revenue analysis, and forecast outlook. Our insights help businesses to make data-backed strategic decisions with ongoing market dynamics. Our analysts track relevent industries related to the Kenya Chemotherapy Market, allowing our clients with actionable intelligence and reliable forecasts tailored to emerging regional needs.
Yes, we provide customisation as per your requirements. To learn more, feel free to contact us on sales@6wresearch.com
1 Executive Summary |
2 Introduction |
2.1 Key Highlights of the Report |
2.2 Report Description |
2.3 Market Scope & Segmentation |
2.4 Research Methodology |
2.5 Assumptions |
3 Kenya Chemotherapy Market Overview |
3.1 Kenya Country Macro Economic Indicators |
3.2 Kenya Chemotherapy Market Revenues & Volume, 2022 & 2032F |
3.3 Kenya Chemotherapy Market - Industry Life Cycle |
3.4 Kenya Chemotherapy Market - Porter's Five Forces |
3.5 Kenya Chemotherapy Market Revenues & Volume Share, By Drug Class, 2022 & 2032F |
3.6 Kenya Chemotherapy Market Revenues & Volume Share, By Indication, 2022 & 2032F |
3.7 Kenya Chemotherapy Market Revenues & Volume Share, By Route of Drug Administration, 2022 & 2032F |
3.8 Kenya Chemotherapy Market Revenues & Volume Share, By End-Users, 2022 & 2032F |
4 Kenya Chemotherapy Market Dynamics |
4.1 Impact Analysis |
4.2 Market Drivers |
4.3 Market Restraints |
5 Kenya Chemotherapy Market Trends |
6 Kenya Chemotherapy Market, By Types |
6.1 Kenya Chemotherapy Market, By Drug Class |
6.1.1 Overview and Analysis |
6.1.2 Kenya Chemotherapy Market Revenues & Volume, By Drug Class, 2022-2032F |
6.1.3 Kenya Chemotherapy Market Revenues & Volume, By Alkylating Agents, 2022-2032F |
6.1.4 Kenya Chemotherapy Market Revenues & Volume, By Mitotic Inhibitors, 2022-2032F |
6.1.5 Kenya Chemotherapy Market Revenues & Volume, By Antimetabolites, 2022-2032F |
6.1.6 Kenya Chemotherapy Market Revenues & Volume, By Topoisomerase Inhibitors, 2022-2032F |
6.1.7 Kenya Chemotherapy Market Revenues & Volume, By Antitumor Antibiotic, 2022-2032F |
6.2 Kenya Chemotherapy Market, By Indication |
6.2.1 Overview and Analysis |
6.2.2 Kenya Chemotherapy Market Revenues & Volume, By Lung Cancer, 2022-2032F |
6.2.3 Kenya Chemotherapy Market Revenues & Volume, By Breast Cancer, 2022-2032F |
6.2.4 Kenya Chemotherapy Market Revenues & Volume, By Colorectal Cancer, 2022-2032F |
6.2.5 Kenya Chemotherapy Market Revenues & Volume, By Prostate Cancer, 2022-2032F |
6.2.6 Kenya Chemotherapy Market Revenues & Volume, By Stomach Cancer, 2022-2032F |
6.2.7 Kenya Chemotherapy Market Revenues & Volume, By Lymphoma, 2022-2032F |
6.2.8 Kenya Chemotherapy Market Revenues & Volume, By Ovarian Cancer, 2022-2032F |
6.2.9 Kenya Chemotherapy Market Revenues & Volume, By Ovarian Cancer, 2022-2032F |
6.3 Kenya Chemotherapy Market, By Route of Drug Administration |
6.3.1 Overview and Analysis |
6.3.2 Kenya Chemotherapy Market Revenues & Volume, By Intravenous, 2022-2032F |
6.3.3 Kenya Chemotherapy Market Revenues & Volume, By Oral, 2022-2032F |
6.3.4 Kenya Chemotherapy Market Revenues & Volume, By Subcutaneous, 2022-2032F |
6.3.5 Kenya Chemotherapy Market Revenues & Volume, By Intra-Muscular, 2022-2032F |
6.3.6 Kenya Chemotherapy Market Revenues & Volume, By Intravesicular, 2022-2032F |
6.3.7 Kenya Chemotherapy Market Revenues & Volume, By Topical, 2022-2032F |
6.3.8 Kenya Chemotherapy Market Revenues & Volume, By Intraventricular/Intrathecal, 2022-2032F |
6.3.9 Kenya Chemotherapy Market Revenues & Volume, By Intraventricular/Intrathecal, 2022-2032F |
6.4 Kenya Chemotherapy Market, By End-Users |
6.4.1 Overview and Analysis |
6.4.2 Kenya Chemotherapy Market Revenues & Volume, By Specialty Centers, 2022-2032F |
6.4.3 Kenya Chemotherapy Market Revenues & Volume, By Hospitals & Clinics, 2022-2032F |
7 Kenya Chemotherapy Market Import-Export Trade Statistics |
7.1 Kenya Chemotherapy Market Export to Major Countries |
7.2 Kenya Chemotherapy Market Imports from Major Countries |
8 Kenya Chemotherapy Market Key Performance Indicators |
9 Kenya Chemotherapy Market - Opportunity Assessment |
9.1 Kenya Chemotherapy Market Opportunity Assessment, By Drug Class, 2022 & 2032F |
9.2 Kenya Chemotherapy Market Opportunity Assessment, By Indication, 2022 & 2032F |
9.3 Kenya Chemotherapy Market Opportunity Assessment, By Route of Drug Administration, 2022 & 2032F |
9.4 Kenya Chemotherapy Market Opportunity Assessment, By End-Users, 2022 & 2032F |
10 Kenya Chemotherapy Market - Competitive Landscape |
10.1 Kenya Chemotherapy Market Revenue Share, By Companies, 2025 |
10.2 Kenya Chemotherapy Market Competitive Benchmarking, By Operating and Technical Parameters |
11 Company Profiles |
12 Recommendations |
13 Disclaimer |
Global Go To Market Strategy - 2030
Export potential enables firms to identify high-growth global markets with greater confidence by combining advanced trade intelligence with a structured quantitative methodology. The framework analyzes emerging demand trends and country-level import patterns while integrating macroeconomic and trade datasets such as GDP and population forecasts, bilateral import–export flows, tariff structures, elasticity differentials between developed and developing economies, geographic distance, and import demand projections. Using weighted trade values from 2020–2024 as the base period to project country-to-country export potential for 2030, these inputs are operationalized through calculated drivers such as gravity model parameters, tariff impact factors, and projected GDP per-capita growth. Through an analysis of hidden potentials, demand hotspots, and market conditions that are most favorable to success, this method enables firms to focus on target countries, maximize returns, and global expansion with data, backed by accuracy.
By factoring in the projected importer demand gap that is currently unmet and could be potential opportunity, it identifies the potential for the Exporter (Country) among 190 countries, against the general trade analysis, which identifies the biggest importer or exporter.
To discover high-growth global markets and optimize your business strategy:
Click Here
Pricing
- Single User License$ 1,995
- Department License$ 2,400
- Site License$ 3,120
- Global License$ 3,795

Leadership Perspectives from Industry Events
Search
Thought Leadership and Analyst Meet


Our Clients
6WResearch In News
- India Air Conditioner Market Set for Strong Rebound in 2026 After Weather-Led Correction and GST-Driven Recovery: 6Wresearch
- ADAS in India: How Automatic Emergency Braking, Blind Spot Detection & Driver Monitoring are Transforming Road Safety
- Doha a strategic location for EV manufacturing hub: IPA Qatar
- Demand for luxury TVs surging in the GCC, says Samsung
- Empowering Growth: The Thriving Journey of Bangladesh’s Cable Industry
- Demand for luxury TVs surging in the GCC, says Samsung
Latest Reports
- Poland Fire Protection Systems Market (2026-2032)
- Cape Verde Portable Hand-Thrown Extinguisher Market (2026-2032)
- Canada Portable Hand-Thrown Extinguisher Market (2026-2032)
- Cameroon Portable Hand-Thrown Extinguisher Market (2026-2032)
- Burundi Portable Hand-Thrown Extinguisher Market (2026-2032)
- Burkina Faso Portable Hand-Thrown Extinguisher Market (2026-2032)
- Bulgaria Portable Hand-Thrown Extinguisher Market (2026-2032)
- Brunei Portable Hand-Thrown Extinguisher Market (2026-2032)
- Botswana Portable Hand-Thrown Extinguisher Market (2026-2032)
- Bosnia and Herzegovina Portable Hand-Thrown Extinguisher Market (2026-2032)
Industry Events and Analyst Meet

HIMTEX 2026

India Refining Summit 2026

India EV Show 2026

EV tech India Expo 2026

Auto Tech Asia 2026
Whitepaper
- Middle East & Africa Commercial Security Market Click here to view more.
- Middle East & Africa Fire Safety Systems & Equipment Market Click here to view more.
- GCC Drone Market Click here to view more.
- Middle East Lighting Fixture Market Click here to view more.
- GCC Physical & Perimeter Security Market Click here to view more.