Kenya Cookware Market (2020-2026) | Industry, Trends, Value, Share, Growth, Outlook, Companies, Forecast, COVID-19 IMPACT, Revenue, Analysis & Size
Market Forecast By Material Type (Aluminium, Stainless Steel, Others), By Distribution Channels (Offline, Online) And Competitive Landscape
| Product Code: ETC006010 | Publication Date: Jun 2023 | Updated Date: Apr 2025 | Product Type: Report | |
| Publisher: 6Wresearch | Author: Ravi Bhandari | No. of Pages: 70 | No. of Figures: 35 | No. of Tables: 5 |
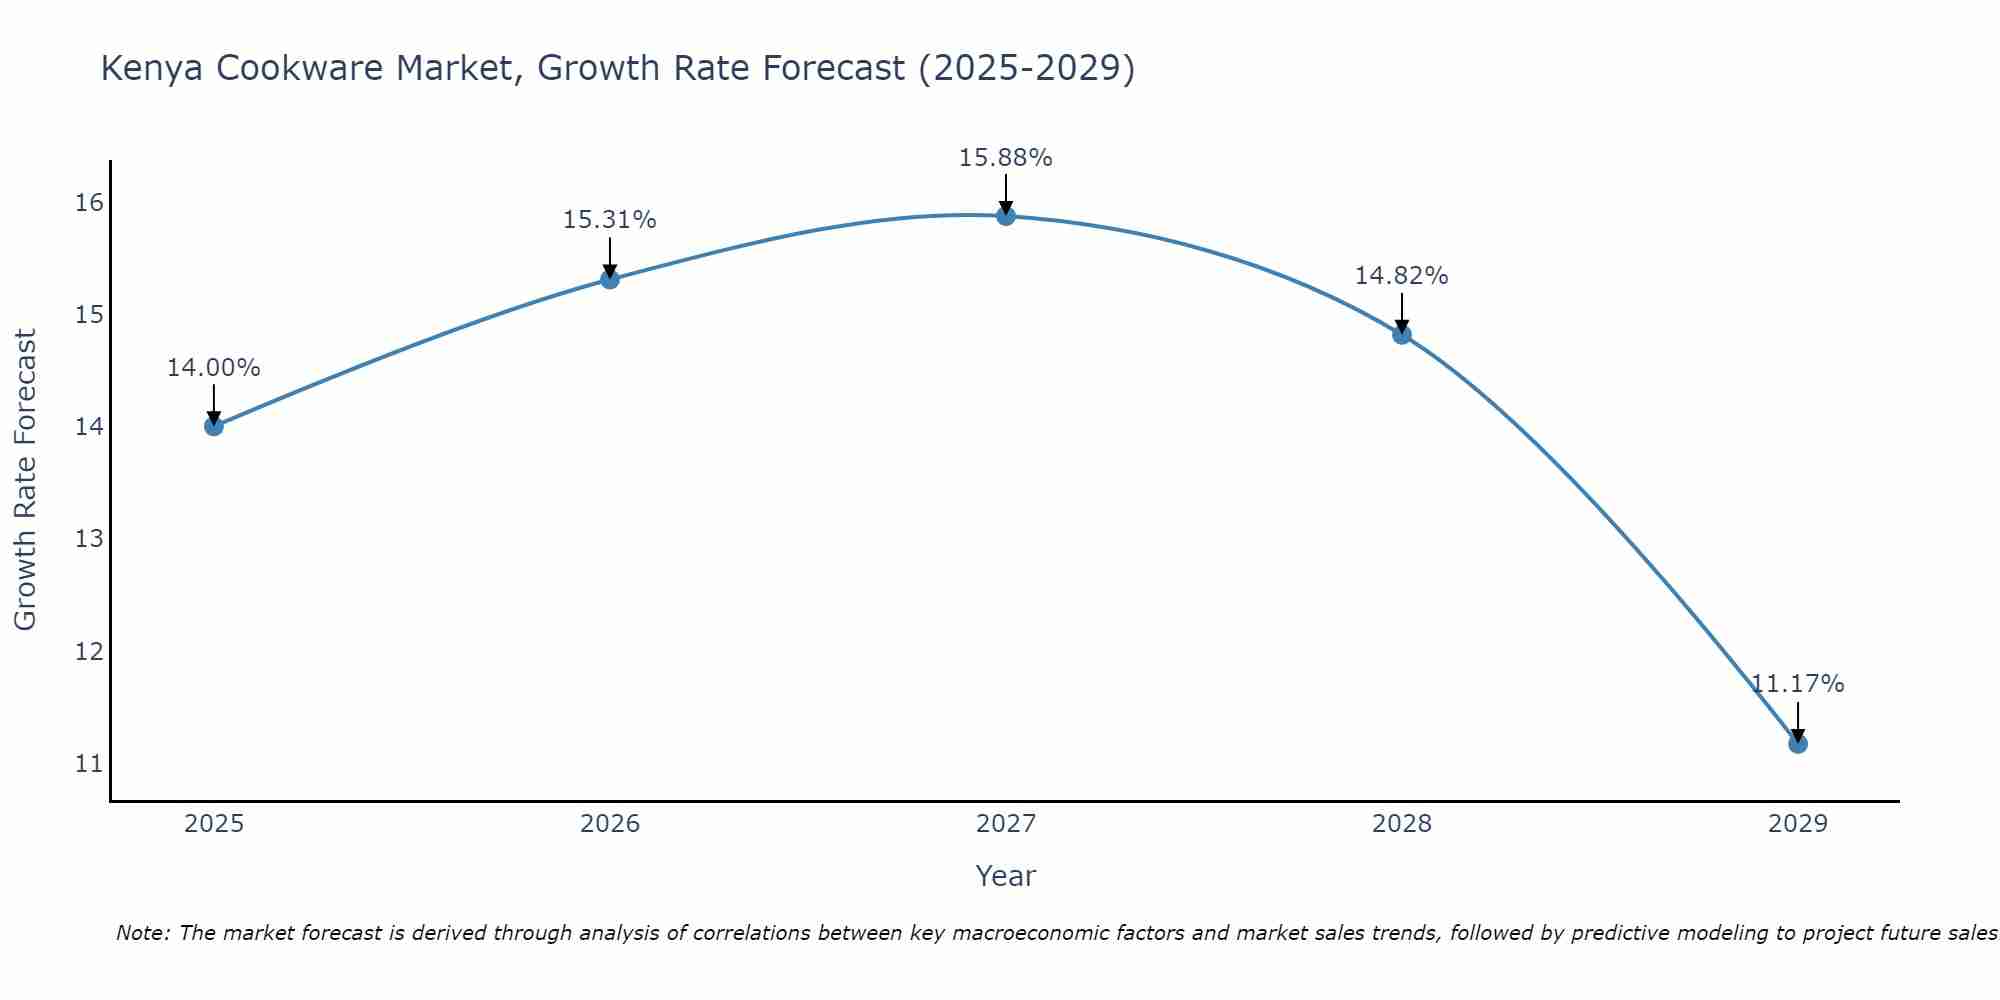
Kenya Cookware Market Size Growth Rate
The Kenya Cookware Market is projected to witness mixed growth rate patterns during 2025 to 2029. Starting at 14.00% in 2025, the market peaks at 15.88% in 2027, and settles at 11.17% by 2029.
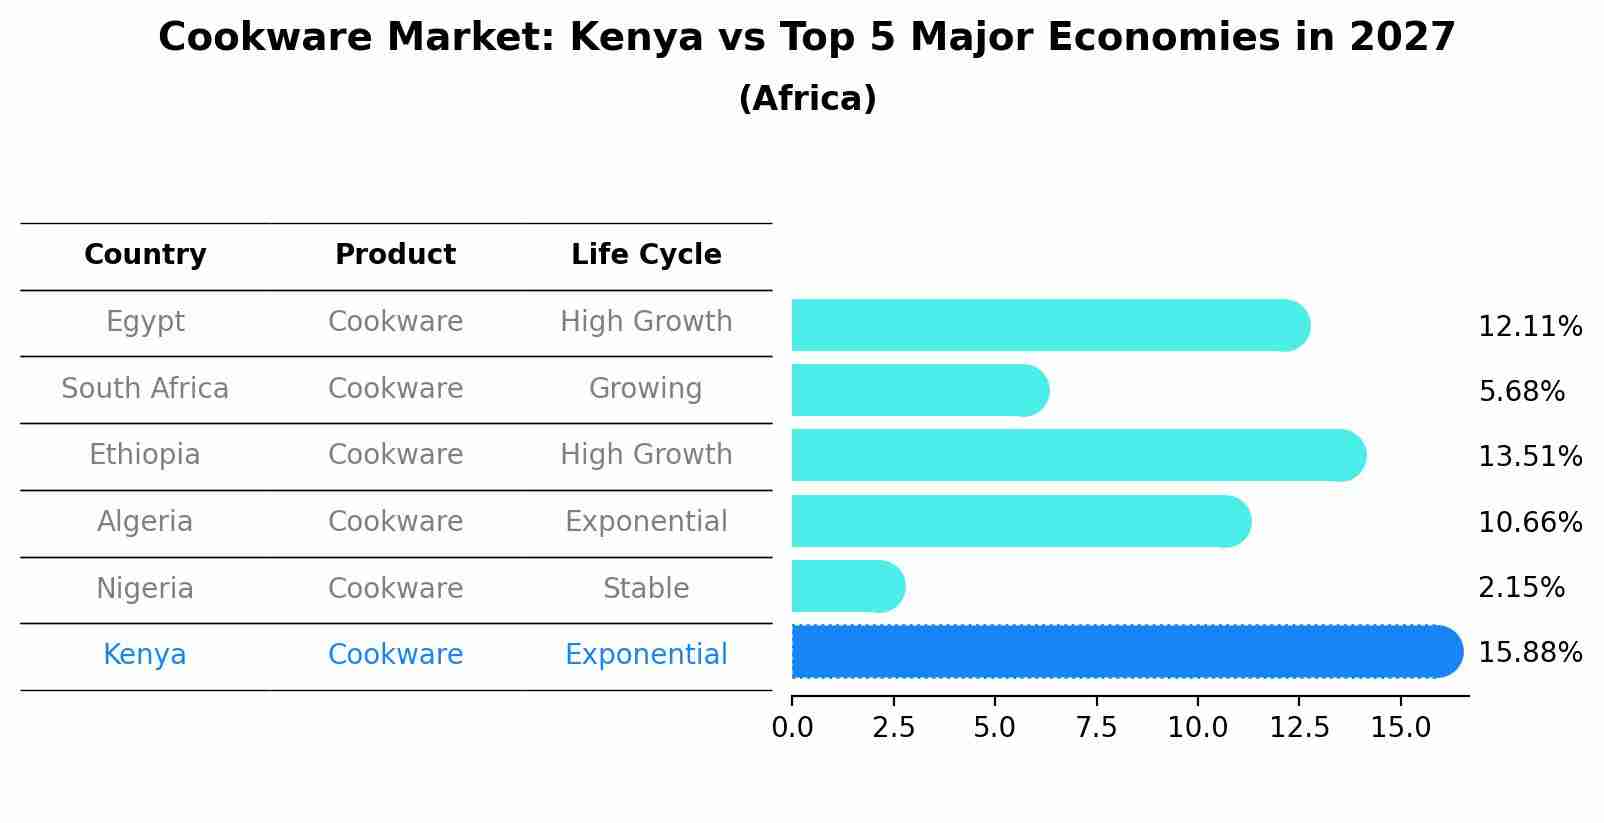
Cookware Market: Kenya vs Top 5 Major Economies in 2027 (Africa)
The Cookware market in Kenya is projected to grow at a exponential growth rate of 15.88% by 2027, within the Africa region led by Egypt, along with other countries like South Africa, Ethiopia, Algeria and Nigeria, collectively shaping a dynamic and evolving market environment driven by innovation and increasing adoption of emerging technologies.
Kenya Cookware Market Synopsis
The Kenyan cookware market consists mainly of imported products from countries such as China, India and South Africa. In addition to these imports, local producers manufacture low-cost items primarily designed for rural households without access to modern amenities or electricity supplies. This segment accounts for more than two thirds of all sales in the sector.
Recent innovation in Kenyas cookware industry includes non-stick aluminum pans that are resistant to corrosion and have superior heat retention properties compared to traditional designs made from iron or steel . These new pan designs are becoming increasingly popular among urban consumers who want convenience when preparing meals at home. Additionally, there has been a rise in demand for eco-friendly alternatives such as bamboo steamers which require less energy consumption than electric models while providing healthier cooking options due to their natural material composition
Key Highlights of the Report:
- Kenya Cookware Market Outlook
- Market Size of Kenya Cookware Market, 2019
- Forecast of Kenya Cookware Market, 2026
- Historical Data and Forecast of Kenya Cookware Revenues & Volume for the Period 2016 - 2026
- Kenya Cookware Market Trend Evolution
- Kenya Cookware Market Drivers and Challenges
- Kenya Cookware Price Trends
- Kenya Cookware Porter's Five Forces
- Kenya Cookware Industry Life Cycle
- Historical Data and Forecast of Kenya Cookware Market Revenues & Volume By Material Type for the Period 2016 - 2026
- Historical Data and Forecast of Kenya Cookware Market Revenues & Volume By Aluminium for the Period 2016 - 2026
- Historical Data and Forecast of Kenya Cookware Market Revenues & Volume By Stainless Steel for the Period 2016 - 2026
- Historical Data and Forecast of Kenya Cookware Market Revenues & Volume By Others for the Period 2016 - 2026
- Historical Data and Forecast of Kenya Cookware Market Revenues & Volume By Distribution Channels for the Period 2016 - 2026
- Historical Data and Forecast of Kenya Cookware Market Revenues & Volume By Offline for the Period 2016 - 2026
- Historical Data and Forecast of Kenya Cookware Market Revenues & Volume By Online for the Period 2016 - 2026
- Kenya Cookware Import Export Trade Statistics
- Market Opportunity Assessment By Material Type
- Market Opportunity Assessment By Distribution Channels
- Kenya Cookware Top Companies Market Share
- Kenya Cookware Competitive Benchmarking By Technical and Operational Parameters
- Kenya Cookware Company Profiles
- Kenya Cookware Key Strategic Recommendations
Frequently Asked Questions About the Market Study (FAQs):
6Wresearch actively monitors the Kenya Cookware Market and publishes its comprehensive annual report, highlighting emerging trends, growth drivers, revenue analysis, and forecast outlook. Our insights help businesses to make data-backed strategic decisions with ongoing market dynamics. Our analysts track relevent industries related to the Kenya Cookware Market, allowing our clients with actionable intelligence and reliable forecasts tailored to emerging regional needs.
Yes, we provide customisation as per your requirements. To learn more, feel free to contact us on sales@6wresearch.com
1 Executive Summary |
2 Introduction |
2.1 Key Highlights of the Report |
2.2 Report Description |
2.3 Market Scope & Segmentation |
2.4 Research Methodology |
2.5 Assumptions |
3 Kenya Cookware Market Overview |
3.1 Kenya Country Macro Economic Indicators |
3.2 Kenya Cookware Market Revenues & Volume, 2019 & 2026F |
3.3 Kenya Cookware Market - Industry Life Cycle |
3.4 Kenya Cookware Market - Porter's Five Forces |
3.5 Kenya Cookware Market Revenues & Volume Share, By Material Type, 2019 & 2026F |
3.6 Kenya Cookware Market Revenues & Volume Share, By Distribution Channels, 2019 & 2026F |
4 Kenya Cookware Market Dynamics |
4.1 Impact Analysis |
4.2 Market Drivers |
4.3 Market Restraints |
5 Kenya Cookware Market Trends |
6 Kenya Cookware Market, By Types |
6.1 Kenya Cookware Market, By Material Type |
6.1.1 Overview and Analysis |
6.1.2 Kenya Cookware Market Revenues & Volume, By Material Type, 2016 - 2026F |
6.1.3 Kenya Cookware Market Revenues & Volume, By Aluminium, 2016 - 2026F |
6.1.4 Kenya Cookware Market Revenues & Volume, By Stainless Steel, 2016 - 2026F |
6.1.5 Kenya Cookware Market Revenues & Volume, By Others, 2016 - 2026F |
6.2 Kenya Cookware Market, By Distribution Channels |
6.2.1 Overview and Analysis |
6.2.2 Kenya Cookware Market Revenues & Volume, By Offline, 2016 - 2026F |
6.2.3 Kenya Cookware Market Revenues & Volume, By Online, 2016 - 2026F |
7 Kenya Cookware Market Import-Export Trade Statistics |
7.1 Kenya Cookware Market Export to Major Countries |
7.2 Kenya Cookware Market Imports from Major Countries |
8 Kenya Cookware Market Key Performance Indicators |
9 Kenya Cookware Market - Opportunity Assessment |
9.1 Kenya Cookware Market Opportunity Assessment, By Material Type, 2019 & 2026F |
9.2 Kenya Cookware Market Opportunity Assessment, By Distribution Channels, 2019 & 2026F |
10 Kenya Cookware Market - Competitive Landscape |
10.1 Kenya Cookware Market Revenue Share, By Companies, 2019 |
10.2 Kenya Cookware Market Competitive Benchmarking, By Operating and Technical Parameters |
11 Company Profiles |
12 Recommendations |
13 Disclaimer |
Global Go To Market Strategy - 2030
Export potential enables firms to identify high-growth global markets with greater confidence by combining advanced trade intelligence with a structured quantitative methodology. The framework analyzes emerging demand trends and country-level import patterns while integrating macroeconomic and trade datasets such as GDP and population forecasts, bilateral import–export flows, tariff structures, elasticity differentials between developed and developing economies, geographic distance, and import demand projections. Using weighted trade values from 2020–2024 as the base period to project country-to-country export potential for 2030, these inputs are operationalized through calculated drivers such as gravity model parameters, tariff impact factors, and projected GDP per-capita growth. Through an analysis of hidden potentials, demand hotspots, and market conditions that are most favorable to success, this method enables firms to focus on target countries, maximize returns, and global expansion with data, backed by accuracy.
By factoring in the projected importer demand gap that is currently unmet and could be potential opportunity, it identifies the potential for the Exporter (Country) among 190 countries, against the general trade analysis, which identifies the biggest importer or exporter.
To discover high-growth global markets and optimize your business strategy:
Click Here
Pricing
- Single User License$ 1,995
- Department License$ 2,400
- Site License$ 3,120
- Global License$ 3,795

Leadership Perspectives from Industry Events
Search
Thought Leadership and Analyst Meet


Our Clients
6WResearch In News
- India Air Conditioner Market Set for Strong Rebound in 2026 After Weather-Led Correction and GST-Driven Recovery: 6Wresearch
- ADAS in India: How Automatic Emergency Braking, Blind Spot Detection & Driver Monitoring are Transforming Road Safety
- Doha a strategic location for EV manufacturing hub: IPA Qatar
- Demand for luxury TVs surging in the GCC, says Samsung
- Empowering Growth: The Thriving Journey of Bangladesh’s Cable Industry
- Demand for luxury TVs surging in the GCC, says Samsung
Latest Reports
- Poland Fire Protection Systems Market (2026-2032)
- Cape Verde Portable Hand-Thrown Extinguisher Market (2026-2032)
- Canada Portable Hand-Thrown Extinguisher Market (2026-2032)
- Cameroon Portable Hand-Thrown Extinguisher Market (2026-2032)
- Burundi Portable Hand-Thrown Extinguisher Market (2026-2032)
- Burkina Faso Portable Hand-Thrown Extinguisher Market (2026-2032)
- Bulgaria Portable Hand-Thrown Extinguisher Market (2026-2032)
- Brunei Portable Hand-Thrown Extinguisher Market (2026-2032)
- Botswana Portable Hand-Thrown Extinguisher Market (2026-2032)
- Bosnia and Herzegovina Portable Hand-Thrown Extinguisher Market (2026-2032)
Industry Events and Analyst Meet

HIMTEX 2026

India Refining Summit 2026

India EV Show 2026

EV tech India Expo 2026

Auto Tech Asia 2026
Whitepaper
- Middle East & Africa Commercial Security Market Click here to view more.
- Middle East & Africa Fire Safety Systems & Equipment Market Click here to view more.
- GCC Drone Market Click here to view more.
- Middle East Lighting Fixture Market Click here to view more.
- GCC Physical & Perimeter Security Market Click here to view more.