Kenya Cordial Drink Market (2026-2032) Outlook | Size, Growth, Trends, Forecast, Industry, Value, Companies, Revenue, Analysis, Share
Market Forecast By Type (Fruit Cordials, Mango, Orange, Strawberry, Vegetable Cordials, Herbs, Spices Cordials), By Distribution Channel (Supermarkets/Hypermarkets, Departmental Stores, Online Retail) And Competitive Landscape
| Product Code: ETC189542 | Publication Date: May 2022 | Updated Date: Jun 2026 | Product Type: Market Research Report | |
| Publisher: 6Wresearch | Author: Ravi Bhandari | No. of Pages: 60 | No. of Figures: 40 | No. of Tables: 7 |
Kenya Cordial Drink Market Size, Share & Growth Rate
The Kenya Cordial Drink Market was estimated at USD 153 Million in 2025 and is projected to reach USD 209 Million by 2032, growing at a CAGR of 4.6% from 2026 to 2032. This growth trajectory is primarily driven by an increasing shift towards non-alcoholic beverage consumption, as consumers opt for refreshing alternatives to traditional carbonated drinks. Additionally, the rising health consciousness among Kenyans is paving the way for more natural and organic cordial options, further stimulating market demand.
Kenya Cordial Drink Market Growth Rate Analysis (2021-2032)
The Kenya cordial drink market has shown consistent stability, with yearly growth rates hovering around 5.6% to 5.7% from 2021 through 2023. This demand can be attributed to increasing consumer preference for non-alcoholic beverages and healthier options, supported by robust investments in local production facilities. However, a slight dip to 5.2% in 2024 reflects market saturation and rising competition. Growth rebounded to 5.7% in 2030, driven by advancements in digital marketing and supply chain efficiencies that improved product availability. Overall, with continuous consumer demand and a focus on innovation, the market is expected to maintain moderate growth, despite occasional fluctuations due to external economic pressures.
Kenya Cordial Drink Market Year-wise Growth Rate and Key Drivers
This graph highlights how the Kenya Cordial Drink Market has steadily grown over the past five years, supported by major growth factors.
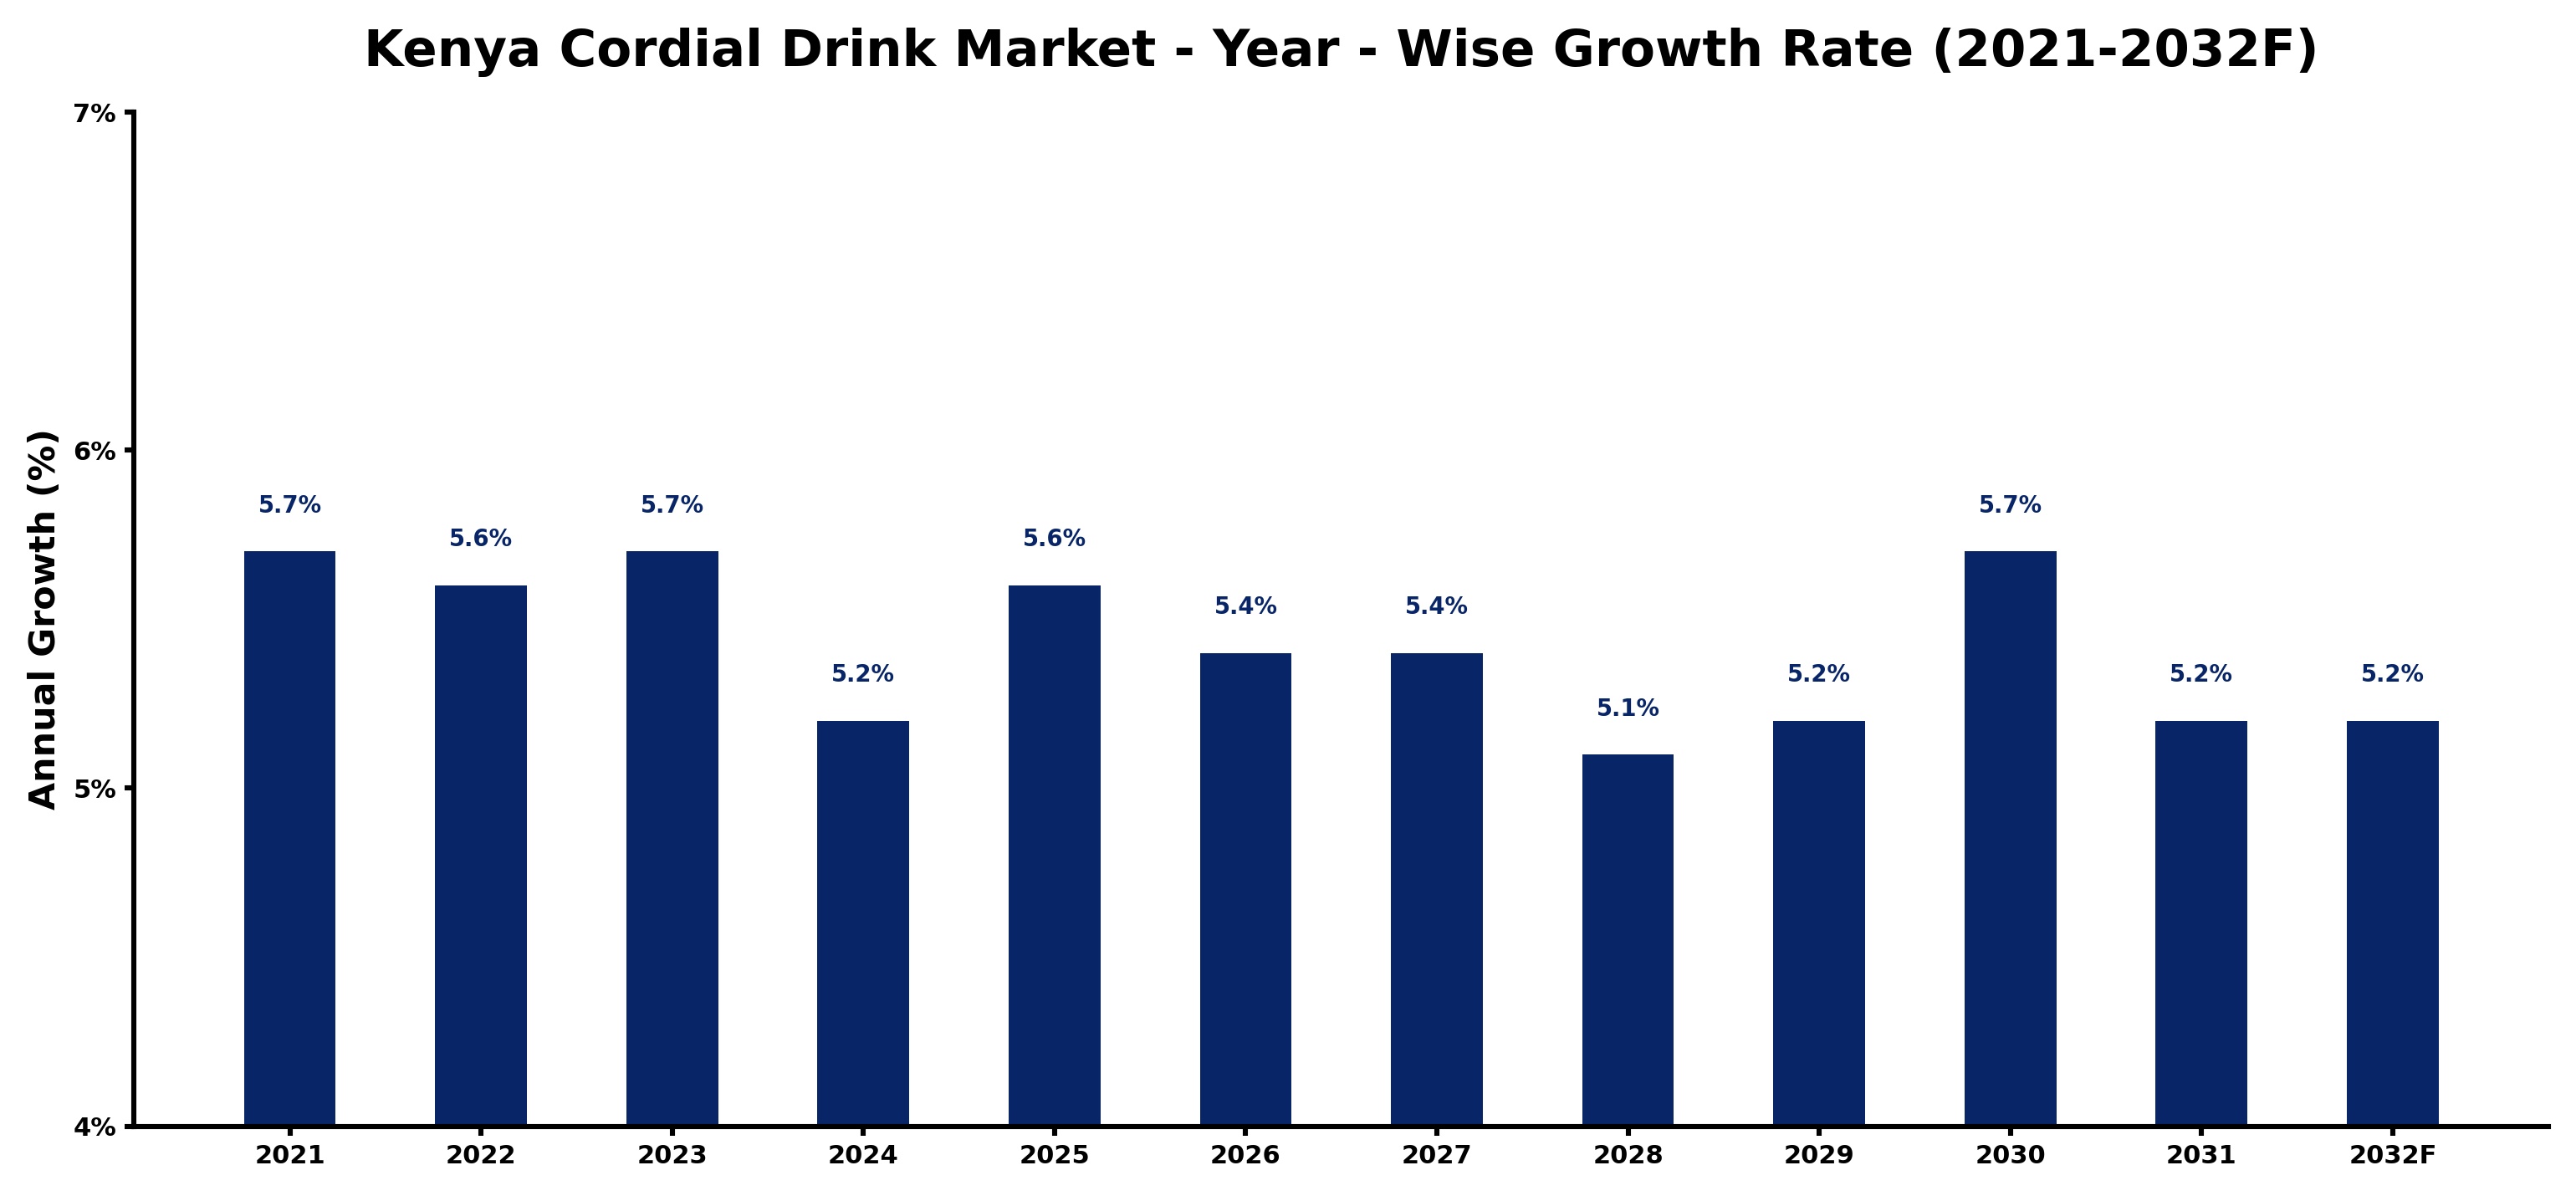
The table below presents the year‑wise growth rates along with the key drivers influencing the market
| Year | Growth Rate | Major Drivers |
| 2021 | 5.7% | Increased consumer health awareness |
| 2022 | 5.6% | New flavor innovations attracted consumers |
| 2023 | 5.7% | Expansion of distribution channels |
| 2024 | 5.2% | Rising demand for natural ingredients |
| 2025 | 5.6% | Growing popularity of local brands |
| 2026 | 5.4% | Enhanced marketing strategies engaged consumers |
| 2027 | 5.4% | Increased availability in urban areas |
| 2028 | 5.1% | Sustainable packaging initiatives gained traction |
| 2029 | 5.2% | Rising interest in non-alcoholic beverages |
| 2030 | 5.7% | Industrial activity supported growth |
| 2031 | 5.2% | Emerging markets drove product demand |
| 2032 | 5.2% | Health-conscious trends influenced purchases |
Note - Market size estimations and growth projections presented in this report are based on 6Wresearch’s advanced forecasting approach, validated with industry datasets as of June 2026.
Kenya Cordial Drink Market Synopsis
Recent momentum in the Kenya Cordial Drink Market has been impressive, propelled by a robust demand for flavored, non-alcoholic beverages. However, as consumers become increasingly health-oriented and urban lifestyles evolve, the market is expected to shift towards even more diverse product offerings that align with these trends.
Looking ahead, the landscape is set to transform significantly as new flavors and formulations emerge, particularly those emphasizing natural ingredients. Companies are likely to focus on enhancing convenience and quality, setting the stage for intensified competition and innovation in the sector.
Kenya Cordial Drink Market Key Takeaways
- Growing consumer preference for non-alcoholic and flavorful beverages is driving market expansion.
- Health consciousness and demand for natural cordial options are reshaping product development.
- Urbanization and increased disposable income are facilitating greater access to cordial drinks.
- Convenience remains a key factor in consumer choices, influencing product formulation and packaging.
- Regulatory measures are promoting safer and healthier beverage options across the market.
Evaluation of Restraints in Kenya Cordial Drink Market
While the Kenya Cordial Drink Market shows great potential, certain restraints may hinder its growth trajectory. Limited access to production equipment and infrastructure challenges impede manufacturers, resulting in higher operational costs and reduced scalability. Furthermore, affordability barriers prevent some consumer segments from fully accessing this burgeoning market, thus impacting overall demand. Addressing these constraints will be crucial for sustaining momentum in market development.
Kenya Cordial Drink Market Trends
Current trends within the Kenya Cordial Drink Market are characterized by a strong shift towards natural and organic ingredients, driven by health-conscious consumers. Additionally, innovative flavor combinations are gaining traction, as brands seek to differentiate themselves in a competitive landscape. There is also an increasing interest in eco-friendly packaging, as sustainability becomes a key purchasing criterion among Kenyan consumers.
Kenya Cordial Drink Market Opportunities
Significant opportunities exist within the Kenya Cordial Drink Market for brands willing to explore niche segments. Targeting the growing urban youth demographic with trendy, health-oriented flavors could yield impressive returns. Moreover, collaborating with local fruit growers for sourcing ingredients can not only enhance product authenticity but also support community economies, fostering brand loyalty.
Government Initiatives in the Kenya Cordial Drink Market
Government initiatives in the Kenya Cordial Drink Market play a crucial role in shaping the operational landscape. Regulatory frameworks focused on beverage safety and labeling are being strengthened to enhance consumer trust. Additionally, policies aimed at promoting sugar reduction and supporting local fruit processing industries are in place to ensure that manufacturers comply with health standards while providing consumers with safer beverage options.
Future Insights of the Kenya Cordial Drink Market
Looking towards 2026-2032, the Kenya Cordial Drink Market is poised for dynamic growth as consumer preferences continue to evolve. The anticipated increase in disposable income will likely enhance access to a wider range of beverage options. As brands innovate to meet the demand for healthier alternatives, a competitive environment will emerge, fueling advancements in flavor development and product formulations. With ongoing governmental support and a focus on sustainability, the future of this market appears promising.
Kenya Cordial Drink Market Latest Developments (May 2025 - June 2026)
In the recent months, the Kenya Cordial Drink Market has witnessed several exciting developments. Brands are increasingly prioritizing sustainability, with many introducing eco-friendly packaging solutions. Furthermore, product launches featuring exotic fruit flavors have captured consumer interest, contributing to a more vibrant market landscape. Industry players are also exploring partnerships with local farmers to enhance ingredient sourcing, promoting both quality and local economy support.
Kenya Cordial Drink Market - Key Attractiveness of the Report
- 10 Years of Market Numbers
- Historical Data Starting from 2022 to 2025
- Base Year: 2025
- Forecast Data until 2032
- Key Performance Indicators Impacting the Market
- Major Upcoming Developments and Projects
Key Highlights of the Report:
- Kenya Cordial Drink Market Outlook
- Market Size of Kenya Cordial Drink Market, 2025
- Forecast of Kenya Cordial Drink Market, 2032
- Historical Data and Forecast of Kenya Cordial Drink Revenues & Volume for the Period 2022-2032F
- Kenya Cordial Drink Market Trend Evolution
- Kenya Cordial Drink Market Drivers and Challenges
- Kenya Cordial Drink Price Trends
- Kenya Cordial Drink Porter's Five Forces
- Kenya Cordial Drink Industry Life Cycle
- Historical Data and Forecast of Kenya Cordial Drink Market Revenues & Volume By Type for the Period 2022-2032F
- Historical Data and Forecast of Kenya Cordial Drink Market Revenues & Volume By Fruit Cordials for the Period 2022-2032F
- Historical Data and Forecast of Kenya Cordial Drink Market Revenues & Volume By Mango, Orange for the Period 2022-2032F
- Historical Data and Forecast of Kenya Cordial Drink Market Revenues & Volume By Strawberry for the Period 2022-2032F
- Historical Data and Forecast of Kenya Cordial Drink Market Revenues & Volume By Vegetable Cordials for the Period 2022-2032F
- Historical Data and Forecast of Kenya Cordial Drink Market Revenues & Volume By Herbs for the Period 2022-2032F
- Historical Data and Forecast of Kenya Cordial Drink Market Revenues & Volume By Spices Cordials for the Period 2022-2032F
- Historical Data and Forecast of Kenya Cordial Drink Market Revenues & Volume By Distribution Channel for the Period 2022-2032F
- Historical Data and Forecast of Kenya Cordial Drink Market Revenues & Volume By Supermarkets/Hypermarkets for the Period 2022-2032F
- Historical Data and Forecast of Kenya Cordial Drink Market Revenues & Volume By Departmental Stores for the Period 2022-2032F
- Historical Data and Forecast of Kenya Cordial Drink Market Revenues & Volume By Online Retail for the Period 2022-2032F
- Kenya Cordial Drink Import Export Trade Statistics
- Market Opportunity Assessment By Type
- Market Opportunity Assessment By Distribution Channel
- Kenya Cordial Drink Top Companies Market Share
- Kenya Cordial Drink Competitive Benchmarking By Technical and Operational Parameters
- Kenya Cordial Drink Company Profiles
- Kenya Cordial Drink Key Strategic Recommendations
Kenya Cordial Drink Market - Frequently Asked Questions
A significant driver of growth is the increasing demand for non-alcoholic beverages among health-conscious consumers. The versatility of cordial drinks and their appeal as refreshing alternatives to sugary sodas further propel this market.
The market faces challenges primarily due to limited access to production infrastructure and affordability issues for consumers, which may restrict full market penetration.
The Kenya Cordial Drink Market was estimated at USD 153 Million in 2025, with projections indicating it will reach USD 209 Million by 2032, growing at a CAGR of 4.6% during the period from 2026 to 2032.
The shift towards healthier, more natural beverage options and innovative flavor profiles is shaping the market's future. Sustainability initiatives are also becoming increasingly prominent among consumers.
Government support includes enhanced regulations for beverage safety and quality control, alongside initiatives promoting local fruit processing and sugar reduction, ensuring healthier options are available to consumers.
6Wresearch actively monitors the Kenya Cordial Drink Market and publishes its comprehensive annual report, highlighting emerging trends, growth drivers, revenue analysis, and forecast outlook. Our insights help businesses to make data-backed strategic decisions with ongoing market dynamics. Our analysts track relevent industries related to the Kenya Cordial Drink Market, allowing our clients with actionable intelligence and reliable forecasts tailored to emerging regional needs.
Yes, we provide customisation as per your requirements. To learn more, feel free to contact us on sales@6wresearch.com
1 Executive Summary |
2 Introduction |
2.1 Key Highlights of the Report |
2.2 Report Description |
2.3 Market Scope & Segmentation |
2.4 Research Methodology |
2.5 Assumptions |
3 Kenya Cordial Drink Market Overview |
3.1 Kenya Country Macro Economic Indicators |
3.2 Kenya Cordial Drink Market Revenues & Volume, 2022 & 2032F |
3.3 Kenya Cordial Drink Market - Industry Life Cycle |
3.4 Kenya Cordial Drink Market - Porter's Five Forces |
3.5 Kenya Cordial Drink Market Revenues & Volume Share, By Type, 2022 & 2032F |
3.6 Kenya Cordial Drink Market Revenues & Volume Share, By Distribution Channel, 2022 & 2032F |
4 Kenya Cordial Drink Market Dynamics |
4.1 Impact Analysis |
4.2 Market Drivers |
4.2.1 Increasing disposable income of consumers in Kenya |
4.2.2 Growing awareness about health and wellness leading to demand for natural and organic cordial drinks |
4.2.3 Expansion of distribution channels and retail outlets in Kenya |
4.3 Market Restraints |
4.3.1 Price sensitivity among consumers in Kenya |
4.3.2 Competition from other non-alcoholic beverages in the market |
5 Kenya Cordial Drink Market Trends |
6 Kenya Cordial Drink Market, By Types |
6.1 Kenya Cordial Drink Market, By Type |
6.1.1 Overview and Analysis |
6.1.2 Kenya Cordial Drink Market Revenues & Volume, By Type, 2022-2032F |
6.1.3 Kenya Cordial Drink Market Revenues & Volume, By Fruit Cordials, 2022-2032F |
6.1.4 Kenya Cordial Drink Market Revenues & Volume, By Mango, Orange, 2022-2032F |
6.1.5 Kenya Cordial Drink Market Revenues & Volume, By Strawberry, 2022-2032F |
6.1.6 Kenya Cordial Drink Market Revenues & Volume, By Vegetable Cordials, 2022-2032F |
6.1.7 Kenya Cordial Drink Market Revenues & Volume, By Herbs, 2022-2032F |
6.1.8 Kenya Cordial Drink Market Revenues & Volume, By Spices Cordials, 2022-2032F |
6.2 Kenya Cordial Drink Market, By Distribution Channel |
6.2.1 Overview and Analysis |
6.2.2 Kenya Cordial Drink Market Revenues & Volume, By Supermarkets/Hypermarkets, 2022-2032F |
6.2.3 Kenya Cordial Drink Market Revenues & Volume, By Departmental Stores, 2022-2032F |
6.2.4 Kenya Cordial Drink Market Revenues & Volume, By Online Retail, 2022-2032F |
7 Kenya Cordial Drink Market Import-Export Trade Statistics |
7.1 Kenya Cordial Drink Market Export to Major Countries |
7.2 Kenya Cordial Drink Market Imports from Major Countries |
8 Kenya Cordial Drink Market Key Performance Indicators |
8.1 Consumer engagement on social media platforms promoting cordial drinks |
8.2 Number of new product launches in the cordial drink segment |
8.3 Growth in online sales and e-commerce presence for cordial drinks in Kenya |
9 Kenya Cordial Drink Market - Opportunity Assessment |
9.1 Kenya Cordial Drink Market Opportunity Assessment, By Type, 2022 & 2032F |
9.2 Kenya Cordial Drink Market Opportunity Assessment, By Distribution Channel, 2022 & 2032F |
10 Kenya Cordial Drink Market - Competitive Landscape |
10.1 Kenya Cordial Drink Market Revenue Share, By Companies, 2025 |
10.2 Kenya Cordial Drink Market Competitive Benchmarking, By Operating and Technical Parameters |
11 Company Profiles |
12 Recommendations |
13 Disclaimer |
Global Go To Market Strategy - 2030
Export potential enables firms to identify high-growth global markets with greater confidence by combining advanced trade intelligence with a structured quantitative methodology. The framework analyzes emerging demand trends and country-level import patterns while integrating macroeconomic and trade datasets such as GDP and population forecasts, bilateral import–export flows, tariff structures, elasticity differentials between developed and developing economies, geographic distance, and import demand projections. Using weighted trade values from 2020–2024 as the base period to project country-to-country export potential for 2030, these inputs are operationalized through calculated drivers such as gravity model parameters, tariff impact factors, and projected GDP per-capita growth. Through an analysis of hidden potentials, demand hotspots, and market conditions that are most favorable to success, this method enables firms to focus on target countries, maximize returns, and global expansion with data, backed by accuracy.
By factoring in the projected importer demand gap that is currently unmet and could be potential opportunity, it identifies the potential for the Exporter (Country) among 190 countries, against the general trade analysis, which identifies the biggest importer or exporter.
To discover high-growth global markets and optimize your business strategy:
Click Here
Pricing
- Single User License$ 1,995
- Department License$ 2,400
- Site License$ 3,120
- Global License$ 3,795

Leadership Perspectives from Industry Events
Search
Thought Leadership and Analyst Meet


Our Clients
6WResearch In News
- India Air Conditioner Market Set for Strong Rebound in 2026 After Weather-Led Correction and GST-Driven Recovery: 6Wresearch
- ADAS in India: How Automatic Emergency Braking, Blind Spot Detection & Driver Monitoring are Transforming Road Safety
- Doha a strategic location for EV manufacturing hub: IPA Qatar
- Demand for luxury TVs surging in the GCC, says Samsung
- Empowering Growth: The Thriving Journey of Bangladesh’s Cable Industry
- Demand for luxury TVs surging in the GCC, says Samsung
Latest Reports
- Poland Fire Protection Systems Market (2026-2032)
- Cape Verde Portable Hand-Thrown Extinguisher Market (2026-2032)
- Canada Portable Hand-Thrown Extinguisher Market (2026-2032)
- Cameroon Portable Hand-Thrown Extinguisher Market (2026-2032)
- Burundi Portable Hand-Thrown Extinguisher Market (2026-2032)
- Burkina Faso Portable Hand-Thrown Extinguisher Market (2026-2032)
- Bulgaria Portable Hand-Thrown Extinguisher Market (2026-2032)
- Brunei Portable Hand-Thrown Extinguisher Market (2026-2032)
- Botswana Portable Hand-Thrown Extinguisher Market (2026-2032)
- Bosnia and Herzegovina Portable Hand-Thrown Extinguisher Market (2026-2032)
Industry Events and Analyst Meet

HIMTEX 2026

India Refining Summit 2026

India EV Show 2026

EV tech India Expo 2026

Auto Tech Asia 2026
Whitepaper
- Middle East & Africa Commercial Security Market Click here to view more.
- Middle East & Africa Fire Safety Systems & Equipment Market Click here to view more.
- GCC Drone Market Click here to view more.
- Middle East Lighting Fixture Market Click here to view more.
- GCC Physical & Perimeter Security Market Click here to view more.