Kenya Electric Conductors Market (2026-2032) | Revenue, Share, Trends, Growth, Companies, Size, Forecast, Outlook, Value, Industry & Analysis
Market Forecast By Product Types (AAC (All Aluminum Conductor), AAAC (All Aluminum Alloy Conductor), ACSR (Aluminum Conductor Steel Reinforced), ACAR (Aluminum Conductor Aluminum Alloy Reinforced)), By Applications (Power Cables, Transformer, Busbars, Submarine Power Cables) And Competitive Landscape
| Product Code: ETC006370 | Publication Date: Sep 2020 | Updated Date: Jun 2026 | Product Type: Report | |
| Publisher: 6Wresearch | Author: Ravi Bhandari | No. of Pages: 70 | No. of Figures: 35 | No. of Tables: 5 |
Kenya Electric Conductors Market Summary
The kenya electric conductors market was estimated at USD 332 Million in 2025 and is projected to reach USD 457 Million by 2032, growing at a CAGR of 5.7% from 2026 to 2032.
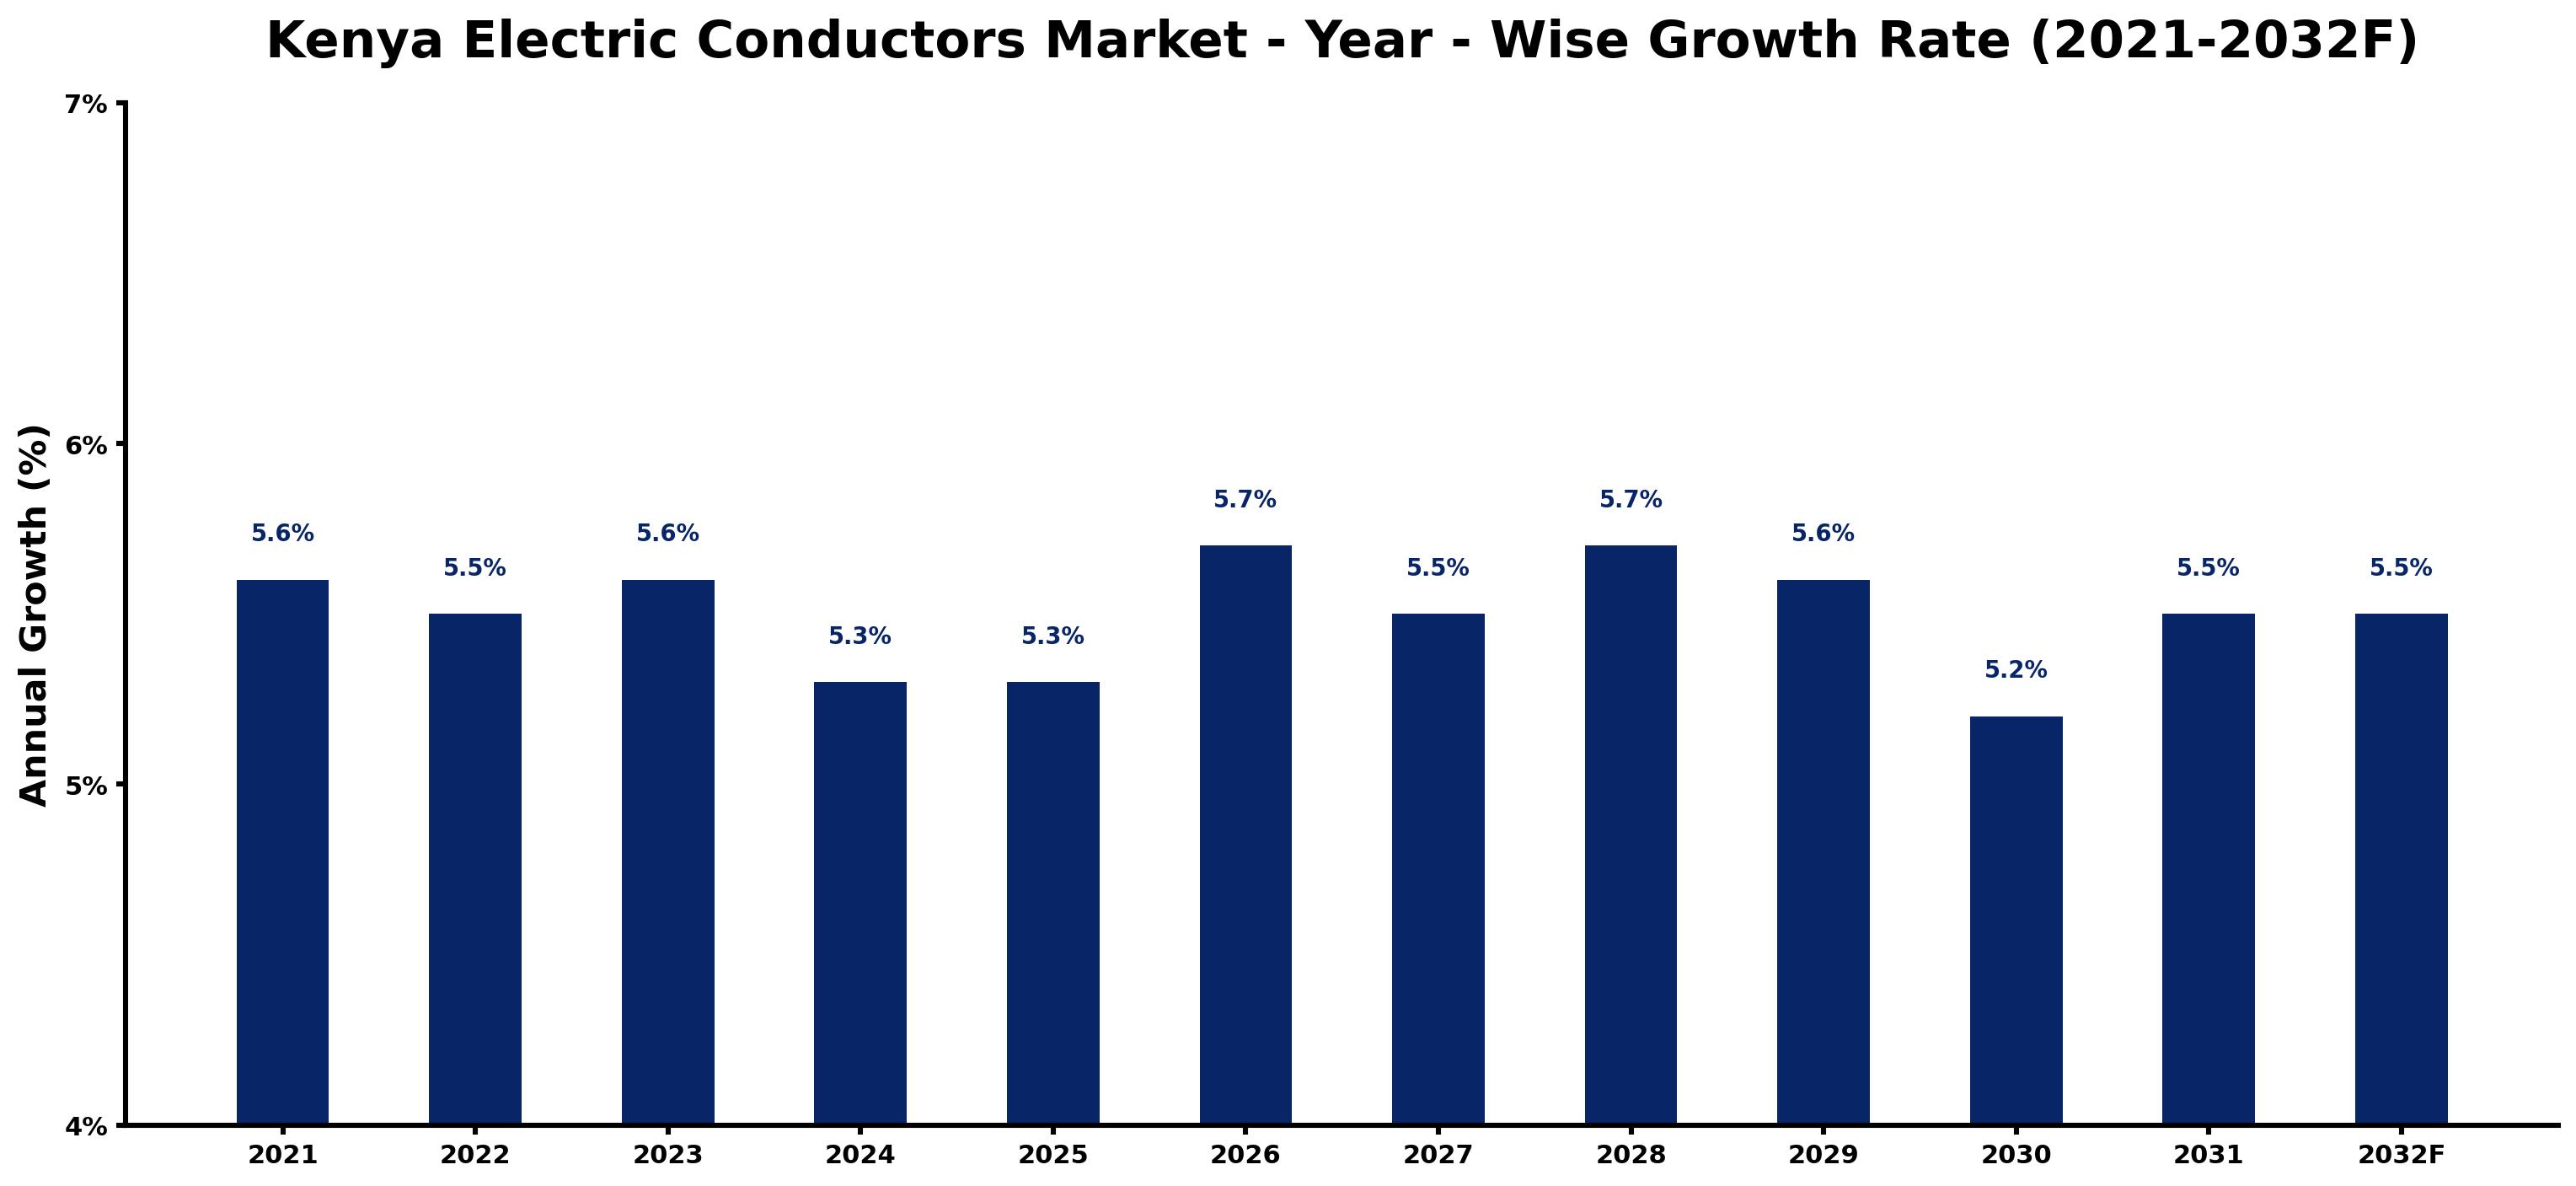
Kenya Electric Conductors Market Growth Rate Analysis (2021-2032)
The Kenya Electric Conductors Market has exhibited stable growth, with annual increases hovering around the 5.5% mark from 2021 to 2023. In 2021, the market grew by 5.6%, driven primarily by rising consumer demand and increased investments in infrastructure projects, particularly in renewable energy. This trend continued into 2022 and 2023, with growth rates of 5.5% and another 5.6%, reflecting ongoing governmental support for energy transition initiatives. A slight dip to 5.3% in 2024 and 2025 can be attributed to economic uncertainties; however, the market rebounded with 5.7% growth in 2026 as technology advancements and policy reforms bolstered investor confidence. The outlook remains robust, supported by continuous upgrades in electrical infrastructure and a growing focus on sustainable energy solutions.
Kenya Electric Conductors Market Year-wise Growth Rate and Key Drivers
This graph highlights how the Kenya Electric Conductors Market has steadily grown over the past five years, supported by major growth factors.
The table below presents the year wise growth rates along with the key drivers influencing the market
| Year | Growth Rate | Major Drivers |
| 2021 | 5.6% | Infrastructure projects gain traction as investments in renewable energy escalate nationwide. |
| 2022 | 5.5% | Emerging urban centers experience a surge in electricity demand and connectivity needs. |
| 2023 | 5.6% | Local manufacturers increase production capacity to meet rising electricity infrastructure requirements. |
| 2024 | 5.3% | Technological innovations in conductor materials enhance performance and reduce energy losses. |
| 2025 | 5.3% | Government incentives encourage electrification in rural areas, expanding market reach significantly. |
| 2026 | 5.7% | Corporate sustainability goals prompt businesses to upgrade to more efficient conductor systems. |
| 2027 | 5.5% | Smart grid technologies reshape the distribution landscape, requiring new conductor solutions. |
| 2028 | 5.7% | Increased foreign investment in energy projects drives competition among local conductor manufacturers. |
| 2029 | 5.6% | Regional collaboration enhances cross-border energy trade, boosting conductor demand in Kenya. |
| 2030 | 5.2% | Legacy infrastructure failures highlight the urgent need for modern conductor installations. |
| 2031 | 5.5% | Urbanization trends continue, necessitating robust electrical systems in burgeoning metropolitan areas. |
| 2032 | 5.5% | Innovative financing models support large-scale electrification projects, unlocking substantial market growth. |
Note - Market size estimations and growth projections presented in this report are based on 6Wresearch's advanced forecasting approach, validated with industry datasets as of June 2026.
Key Highlights of the Report:
- Kenya Electric Conductors Market Outlook
- Market Size of Kenya Electric Conductors Market, 2025
- Forecast of Kenya Electric Conductors Market, 2032F
- Historical Data and Forecast of Kenya Electric Conductors Revenues & Volume for the Period 2022-2032F
- Kenya Electric Conductors Market Trend Evolution
- Kenya Electric Conductors Market Drivers and Challenges
- Kenya Electric Conductors Price Trends
- Kenya Electric Conductors Porter's Five Forces
- Kenya Electric Conductors Industry Life Cycle
- Historical Data and Forecast of Kenya Electric Conductors Market Revenues & Volume By Product Types for the Period 2022-2032F
- Historical Data and Forecast of Kenya Electric Conductors Market Revenues & Volume By AAC (All Aluminum Conductor) for the Period 2022-2032F
- Historical Data and Forecast of Kenya Electric Conductors Market Revenues & Volume By AAAC (All Aluminum Alloy Conductor) for the Period 2022-2032F
- Historical Data and Forecast of Kenya Electric Conductors Market Revenues & Volume By ACSR (Aluminum Conductor Steel Reinforced) for the Period 2022-2032F
- Historical Data and Forecast of Kenya Electric Conductors Market Revenues & Volume By ACAR (Aluminum Conductor Aluminum Alloy Reinforced) for the Period 2022-2032F
- Historical Data and Forecast of Kenya Electric Conductors Market Revenues & Volume By Applications for the Period 2022-2032F
- Historical Data and Forecast of Kenya Electric Conductors Market Revenues & Volume By Power Cables for the Period 2022-2032F
- Historical Data and Forecast of Kenya Electric Conductors Market Revenues & Volume By Transformer for the Period 2022-2032F
- Historical Data and Forecast of Kenya Electric Conductors Market Revenues & Volume By Busbars for the Period 2022-2032F
- Historical Data and Forecast of Kenya Electric Conductors Market Revenues & Volume By Submarine Power Cables for the Period 2022-2032F
- Kenya Electric Conductors Import Export Trade Statistics
- Market Opportunity Assessment By Product Types
- Market Opportunity Assessment By Applications
- Kenya Electric Conductors Top Companies Market Share
- Kenya Electric Conductors Competitive Benchmarking By Technical and Operational Parameters
- Kenya Electric Conductors Company Profiles
- Kenya Electric Conductors Key Strategic Recommendations
Frequently Asked Questions About the Market Study (FAQs):
6Wresearch actively monitors the Kenya Electric Conductors Market and publishes its comprehensive annual report, highlighting emerging trends, growth drivers, revenue analysis, and forecast outlook. Our insights help businesses to make data-backed strategic decisions with ongoing market dynamics. Our analysts track relevent industries related to the Kenya Electric Conductors Market, allowing our clients with actionable intelligence and reliable forecasts tailored to emerging regional needs.
Yes, we provide customisation as per your requirements. To learn more, feel free to contact us on sales@6wresearch.com
| 1 Executive Summary |
| 2 Introduction |
| 2.1 Key Highlights of the Report |
| 2.2 Report Description |
| 2.3 Market Scope & Segmentation |
| 2.4 Research Methodology |
| 2.5 Assumptions |
| 3 Kenya Electric Conductors Market Overview |
| 3.1 Kenya Country Macro Economic Indicators |
| 3.2 Kenya Electric Conductors Market Revenues & Volume, 2022 & 2032F |
| 3.3 Kenya Electric Conductors Market - Industry Life Cycle |
| 3.4 Kenya Electric Conductors Market - Porter's Five Forces |
| 3.5 Kenya Electric Conductors Market Revenues & Volume Share, By Product Types, 2022 & 2032F |
| 3.6 Kenya Electric Conductors Market Revenues & Volume Share, By Applications, 2022 & 2032F |
| 4 Kenya Electric Conductors Market Dynamics |
| 4.1 Impact Analysis |
| 4.2 Market Drivers |
| 4.3 Market Restraints |
| 5 Kenya Electric Conductors Market Trends |
| 6 Kenya Electric Conductors Market, By Types |
| 6.1 Kenya Electric Conductors Market, By Product Types |
| 6.1.1 Overview and Analysis |
| 6.1.2 Kenya Electric Conductors Market Revenues & Volume, By Product Types, 2022 - 2032F |
| 6.1.3 Kenya Electric Conductors Market Revenues & Volume, By AAC (All Aluminum Conductor), 2022 - 2032F |
| 6.1.4 Kenya Electric Conductors Market Revenues & Volume, By AAAC (All Aluminum Alloy Conductor), 2022 - 2032F |
| 6.1.5 Kenya Electric Conductors Market Revenues & Volume, By ACSR (Aluminum Conductor Steel Reinforced), 2022 - 2032F |
| 6.1.6 Kenya Electric Conductors Market Revenues & Volume, By ACAR (Aluminum Conductor Aluminum Alloy Reinforced), 2022 - 2032F |
| 6.2 Kenya Electric Conductors Market, By Applications |
| 6.2.1 Overview and Analysis |
| 6.2.2 Kenya Electric Conductors Market Revenues & Volume, By Power Cables, 2022 - 2032F |
| 6.2.3 Kenya Electric Conductors Market Revenues & Volume, By Transformer, 2022 - 2032F |
| 6.2.4 Kenya Electric Conductors Market Revenues & Volume, By Busbars, 2022 - 2032F |
| 6.2.5 Kenya Electric Conductors Market Revenues & Volume, By Submarine Power Cables, 2022 - 2032F |
| 7 Kenya Electric Conductors Market Import-Export Trade Statistics |
| 7.1 Kenya Electric Conductors Market Export to Major Countries |
| 7.2 Kenya Electric Conductors Market Imports from Major Countries |
| 8 Kenya Electric Conductors Market Key Performance Indicators |
| 9 Kenya Electric Conductors Market - Opportunity Assessment |
| 9.1 Kenya Electric Conductors Market Opportunity Assessment, By Product Types, 2022 & 2032F |
| 9.2 Kenya Electric Conductors Market Opportunity Assessment, By Applications, 2022 & 2032F |
| 10 Kenya Electric Conductors Market - Competitive Landscape |
| 10.1 Kenya Electric Conductors Market Revenue Share, By Companies, 2025 |
| 10.2 Kenya Electric Conductors Market Competitive Benchmarking, By Operating and Technical Parameters |
| 11 Company Profiles |
| 12 Recommendations |
| 13 Disclaimer |
Global Go To Market Strategy - 2030
Export potential enables firms to identify high-growth global markets with greater confidence by combining advanced trade intelligence with a structured quantitative methodology. The framework analyzes emerging demand trends and country-level import patterns while integrating macroeconomic and trade datasets such as GDP and population forecasts, bilateral import–export flows, tariff structures, elasticity differentials between developed and developing economies, geographic distance, and import demand projections. Using weighted trade values from 2020–2024 as the base period to project country-to-country export potential for 2030, these inputs are operationalized through calculated drivers such as gravity model parameters, tariff impact factors, and projected GDP per-capita growth. Through an analysis of hidden potentials, demand hotspots, and market conditions that are most favorable to success, this method enables firms to focus on target countries, maximize returns, and global expansion with data, backed by accuracy.
By factoring in the projected importer demand gap that is currently unmet and could be potential opportunity, it identifies the potential for the Exporter (Country) among 190 countries, against the general trade analysis, which identifies the biggest importer or exporter.
To discover high-growth global markets and optimize your business strategy:
Click Here
Pricing
- Single User License$ 1,995
- Department License$ 2,400
- Site License$ 3,120
- Global License$ 3,795

Leadership Perspectives from Industry Events
Search
Thought Leadership and Analyst Meet


Our Clients
6WResearch In News
- India Air Conditioner Market Set for Strong Rebound in 2026 After Weather-Led Correction and GST-Driven Recovery: 6Wresearch
- ADAS in India: How Automatic Emergency Braking, Blind Spot Detection & Driver Monitoring are Transforming Road Safety
- Doha a strategic location for EV manufacturing hub: IPA Qatar
- Demand for luxury TVs surging in the GCC, says Samsung
- Empowering Growth: The Thriving Journey of Bangladesh’s Cable Industry
- Demand for luxury TVs surging in the GCC, says Samsung
Latest Reports
- Nicaragua RPG Gaming Market (2026-2032)
- New Zealand RPG Gaming Market (2026-2032)
- Netherlands RPG Gaming Market (2026-2032)
- Nauru RPG Gaming Market (2026-2032)
- Namibia RPG Gaming Market (2026-2032)
- Mozambique RPG Gaming Market (2026-2032)
- Montenegro RPG Gaming Market (2026-2032)
- Mongolia RPG Gaming Market (2026-2032)
- Monaco RPG Gaming Market (2026-2032)
- Micronesia RPG Gaming Market (2026-2032)
Industry Events and Analyst Meet

HIMTEX 2026

India Refining Summit 2026

India EV Show 2026

EV tech India Expo 2026

Auto Tech Asia 2026
Whitepaper
- Middle East & Africa Commercial Security Market Click here to view more.
- Middle East & Africa Fire Safety Systems & Equipment Market Click here to view more.
- GCC Drone Market Click here to view more.
- Middle East Lighting Fixture Market Click here to view more.
- GCC Physical & Perimeter Security Market Click here to view more.