Kenya Flake Graphite Market (2026-2032) Outlook | Companies, Share, Forecast, Trends, Growth, Size, Industry, Value, Analysis & Revenue
Market Forecast By Flake Size (Jumbo, Large, Medium, Small, Fine), By Application (Refractory, Foundry, Battery, Friction Product, Lubricant, Others), By End-users (Automotive, Power, Electronic) And Competitive Landscape
| Product Code: ETC103269 | Publication Date: Jun 2021 | Updated Date: Jun 2026 | Product Type: Report | |
| Publisher: 6Wresearch | Author: Shubham Deep | No. of Pages: 70 | No. of Figures: 35 | No. of Tables: 5 |
Kenya Flake Graphite Market Size, Share & Growth Rate
The Kenya Flake Graphite Market was estimated at USD 423 Million in 2025 and is projected to reach USD 582 Million by 2032, growing at a CAGR of 4.7% from 2026 to 2032. This upward trajectory is being driven primarily by the rising demand for electric vehicles, which heavily rely on flake graphite for lithium-ion batteries. Furthermore, the increasing adoption of renewable energy technologies and sustainable mining practices are also contributing to this growth as industries search for high-quality graphite to enhance their products.
Kenya Flake Graphite Market Growth Rate Analysis (2021-2032)
The Kenya flake graphite market has exhibited stable growth, with annual increases averaging between 5.2% and 5.8% from 2021 through 2032. The growth was notable in 2022, reaching 5.7%, largely fueled by rising global demand for graphite in battery technology amid the ongoing energy transition. In 2023, the growth slightly dipped to 5.2% due to supply chain constraints but rebounded in 2024 at 5.8%, bolstered by increased investments in mining infrastructure and supportive government policies. Consumer demand for electric vehicles and renewable energy storage solutions has sustained this upward trend, ensuring that the market remains robust through the coming years. The fluctuations reflect both local industrial activity and broader global market dynamics.
Kenya Flake Graphite Market Year-wise Growth Rate and Key Drivers
This graph highlights how the Kenya Flake Graphite Market has steadily grown over the past five years, supported by major growth factors.
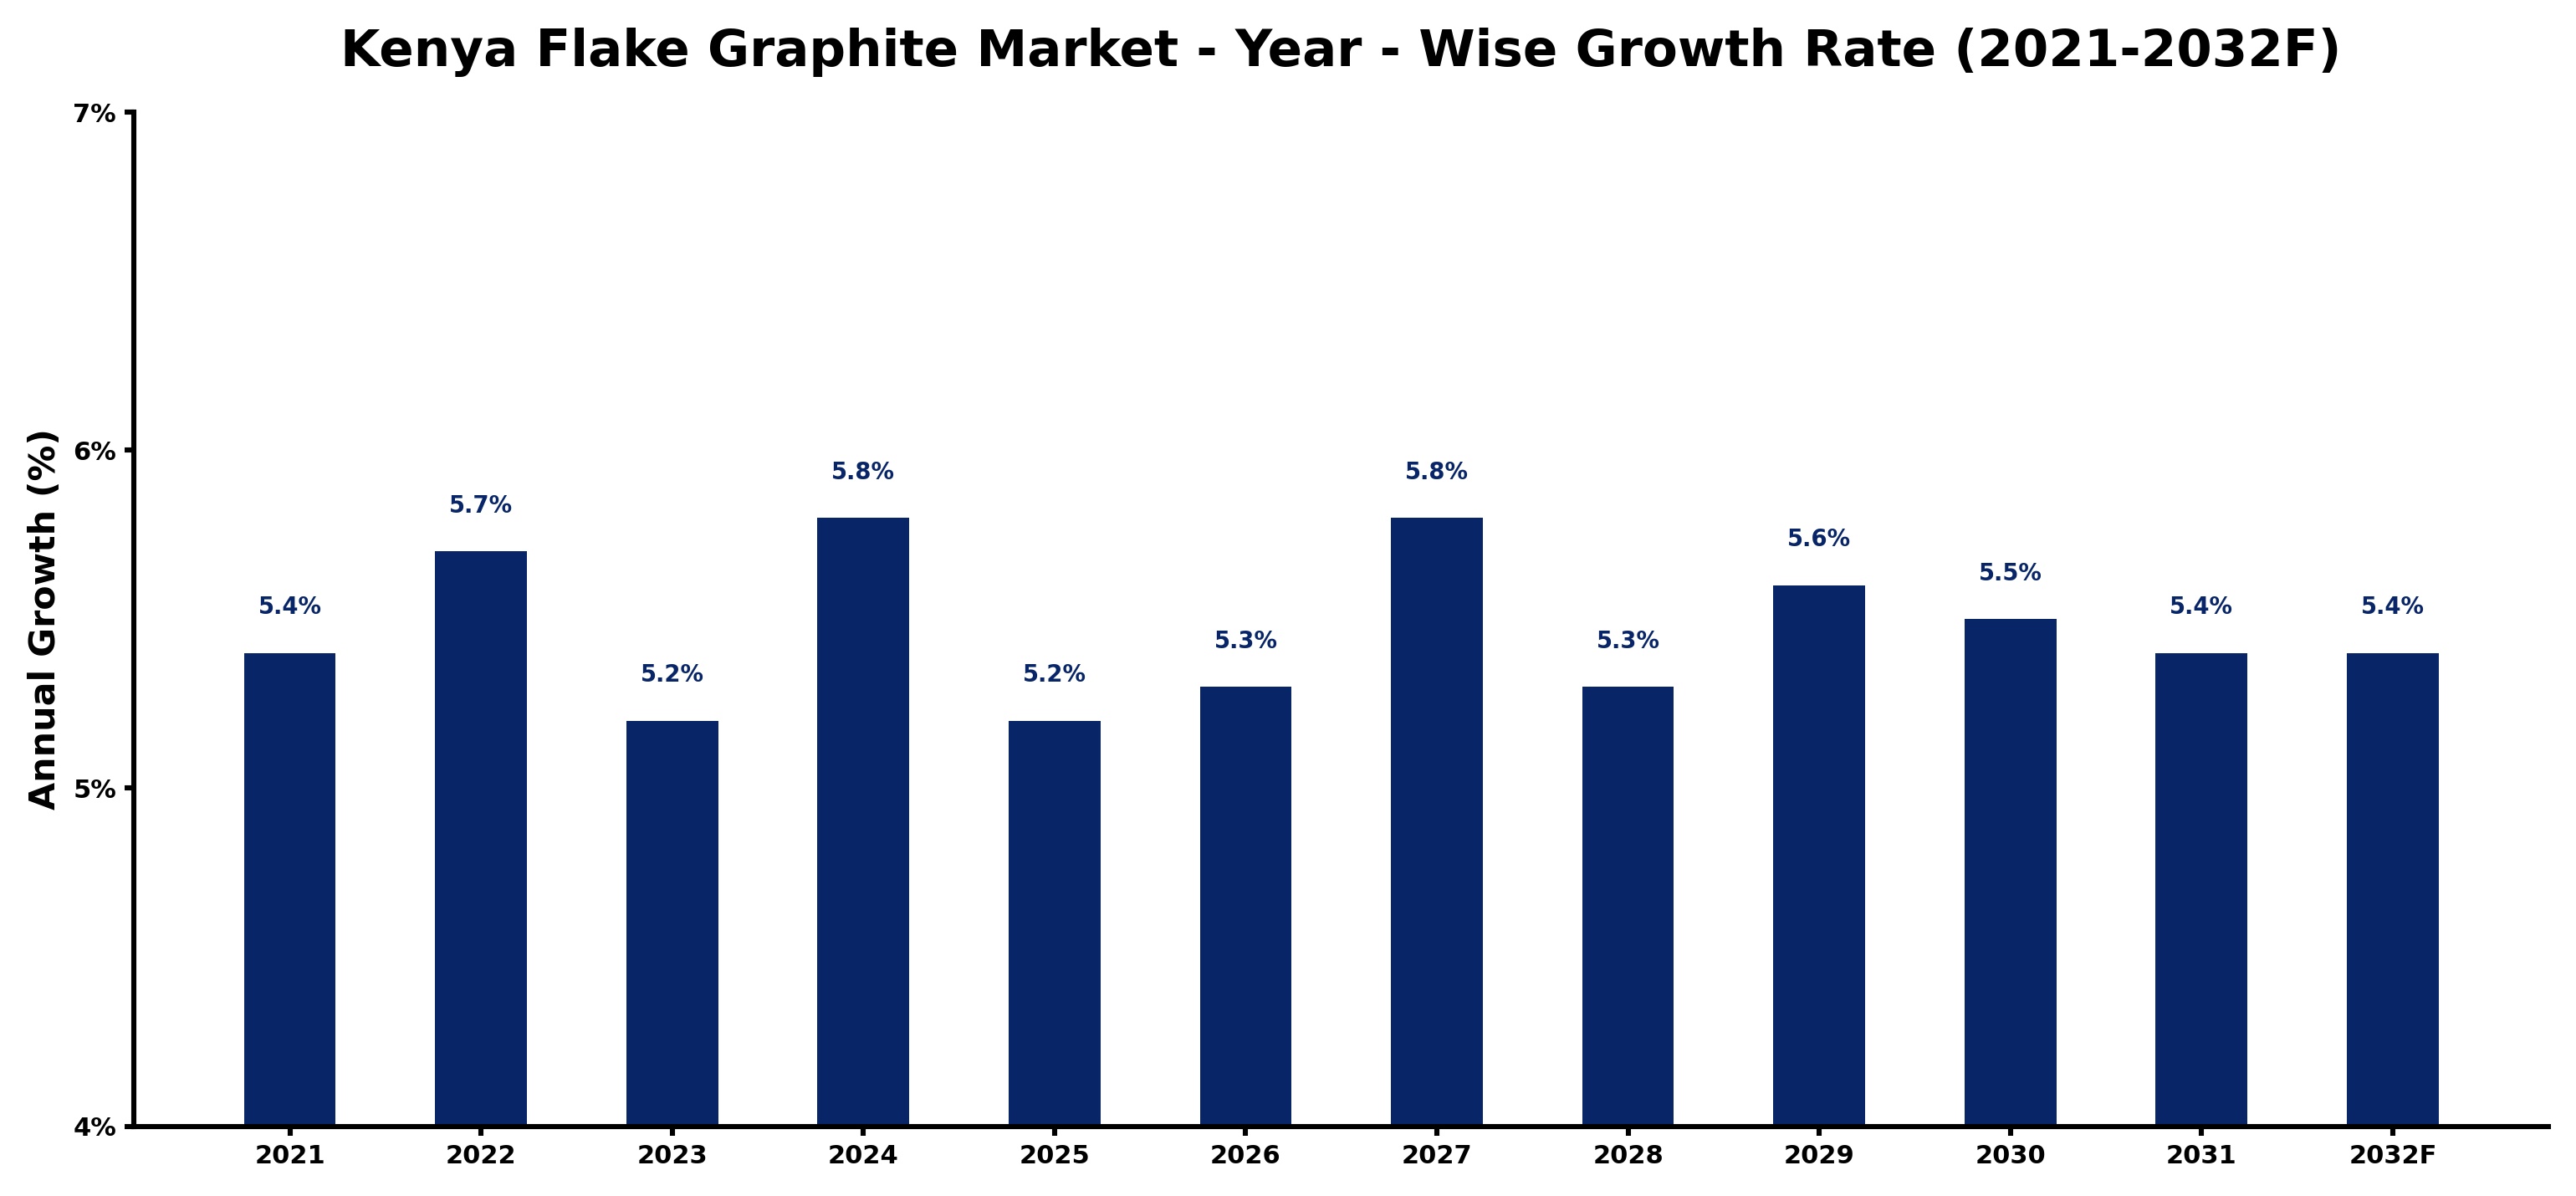
The table below presents the year‑wise growth rates along with the key drivers influencing the market
| Year | Growth Rate | Major Drivers |
| 2021 | 5.4% | Regional graphite mine development boosted local supply chain efficiency |
| 2022 | 5.7% | Supply chain upgrades enhanced flake graphite processing plant throughput |
| 2023 | 5.2% | Export driven graphite processing facilities attracted substantial foreign investments |
| 2024 | 5.8% | Digital technology adoption enhanced flake graphite processing efficiency |
| 2025 | 5.2% | Increased battery production drives demand for high purity graphite supplies |
| 2026 | 5.3% | Local manufacturers invest in advanced processing technology for graphite production |
| 2027 | 5.8% | Flake graphite supply chain optimization boosts domestic battery manufacturing output |
| 2028 | 5.3% | Domestic graphite processing investments boosted local supply chain capabilities |
| 2029 | 5.6% | Mining sector upgrades boost flake graphite supply chain efficiency |
| 2030 | 5.5% | Domestic graphite processing investments boosted local export capabilities |
| 2031 | 5.4% | Increased mining investments boost flake graphite extraction capabilities |
| 2032 | 5.4% | New graphite processing facilities boost local supply chain efficiency |
Note - Market size estimations and growth projections presented in this report are based on 6Wresearch’s advanced forecasting approach, validated with industry datasets as of June 2026.
Kenya Flake Graphite Market Synopsis
The most significant force shaping the Kenya Flake Graphite Market is the escalating global demand for electric vehicles. As battery manufacturers seek reliable sources of high-quality graphite, Kenya's rich deposits have captured the attention of both domestic and international stakeholders. Regions such as Meru and Kitui are becoming focal points for investment, given their potential to meet the needs of various sectors.
Additionally, the government's commitment to promoting sustainable mining practices has positively influenced market dynamics. By encouraging environmentally friendly operations and value-added processing, Kenya aims to establish itself as a key player in the global graphite supply chain. This has led to an influx of foreign investment, further enhancing the market’s prospects.
Kenya Flake Graphite Market Key Takeaways
- Increasing global demand for electric vehicles is propelling growth in the Kenya Flake Graphite Market.
- The government's support for sustainable mining practices is reshaping industry standards.
- Key regions like Meru and Kitui are attracting significant investments in graphite mining.
- Infrastructure development remains crucial for enhancing production efficiency.
- Investment opportunities are ripe in both mining operations and graphite processing facilities.
Evaluation of Restraints in Kenya Flake Graphite Market
Despite its promising growth, the Kenya Flake Graphite Market faces notable restraints that could hinder its trajectory. Limited infrastructure for mining and processing operations presents significant challenges, often resulting in elevated production costs and inefficiencies. Additionally, local producers must contend with price fluctuations in the global graphite market, which can adversely affect profitability. Competition from established graphite-producing nations with robust supply chains further complicates Kenya's efforts to carve out a competitive niche. Lastly, potential political instability and regulatory uncertainties can discourage investment and market growth.
Kenya Flake Graphite Market Trends
A notable trend within the Kenya Flake Graphite Market is the increasing focus on sustainability, where mining operations are evolving to incorporate environmentally friendly practices. Companies are investing in technology that minimizes environmental impact, thus aligning with global demands for responsible sourcing. Furthermore, there is a significant rise in the development of vertically integrated operations, with firms looking to control both mining and processing to capture greater value in the supply chain.
Kenya Flake Graphite Market Opportunities
The investment landscape in the Kenya Flake Graphite Market is rich with opportunities. The country's substantial graphite reserves and the burgeoning global demand for diverse applications—ranging from electronics to lubricants—present lucrative avenues for investment. Establishing processing facilities within Kenya not only adds value to the raw material but also fosters local employment. With government backing for the mining sector and initiatives aimed at improving local production capabilities, stakeholders can capitalize on the expanding market effectively.
Government Initiatives in the Kenya Flake Graphite Market
The Kenyan government has implemented a series of initiatives aimed at bolstering the flake graphite market. These measures include providing tax incentives to local mining companies and streamlining regulatory processes to facilitate easier entry for investors. There is also a strong emphasis on promoting environmentally sustainable mining practices to ensure the long-term viability of the industry. The government's focus on enhancing local production capacity through value addition aims to create more job opportunities and boost economic growth.
Future Insights of the Kenya Flake Graphite Market
Looking ahead to the 2026-2032 period, the Kenya Flake Graphite Market is set for robust expansion. The accelerating demand from battery manufacturing, driven by the electric vehicle surge, will remain a key growth catalyst. The expanding electronics sector, alongside the increasing application of graphite in industrial lubricants, is expected to contribute to this upward trend. Moreover, Kenya's strategic location in East Africa presents additional export opportunities, making it a potential hub for regional graphite supply.
Kenya Flake Graphite Market Latest Developments (May 2025 - June 2026)
Recent developments in the Kenya Flake Graphite Market highlight a growing emphasis on advanced mining technologies aimed at improving efficiency and reducing environmental impacts. Additionally, collaborations between local mining companies and international investors are becoming increasingly common, paving the way for enhanced capital inflow. The market is also seeing a heightened interest in sustainable practices, with several firms announcing initiatives to ensure environmentally responsible operations.
Kenya Flake Graphite Market - Key Attractiveness of the Report
- 10 Years of Market Numbers
- Historical Data Starting from 2022 to 2025
- Base Year: 2025
- Forecast Data until 2032
- Key Performance Indicators Impacting the Market
- Major Upcoming Developments and Projects
Key Highlights of the Report:
- Kenya Flake Graphite Market Outlook
- Market Size of Kenya Flake Graphite Market, 2025
- Forecast of Kenya Flake Graphite Market, 2032
- Historical Data and Forecast of Kenya Flake Graphite Revenues & Volume for the Period 2022-2032F
- Kenya Flake Graphite Market Trend Evolution
- Kenya Flake Graphite Market Drivers and Challenges
- Kenya Flake Graphite Price Trends
- Kenya Flake Graphite Porter's Five Forces
- Kenya Flake Graphite Industry Life Cycle
- Historical Data and Forecast of Kenya Flake Graphite Market Revenues & Volume By Flake Size for the Period 2022-2032F
- Historical Data and Forecast of Kenya Flake Graphite Market Revenues & Volume By Jumbo for the Period 2022-2032F
- Historical Data and Forecast of Kenya Flake Graphite Market Revenues & Volume By Large for the Period 2022-2032F
- Historical Data and Forecast of Kenya Flake Graphite Market Revenues & Volume By Medium for the Period 2022-2032F
- Historical Data and Forecast of Kenya Flake Graphite Market Revenues & Volume By Small for the Period 2022-2032F
- Historical Data and Forecast of Kenya Flake Graphite Market Revenues & Volume By Fine for the Period 2022-2032F
- Historical Data and Forecast of Kenya Flake Graphite Market Revenues & Volume By Application for the Period 2022-2032F
- Historical Data and Forecast of Kenya Flake Graphite Market Revenues & Volume By Refractory for the Period 2022-2032F
- Historical Data and Forecast of Kenya Flake Graphite Market Revenues & Volume By Foundry for the Period 2022-2032F
- Historical Data and Forecast of Kenya Flake Graphite Market Revenues & Volume By Battery for the Period 2022-2032F
- Historical Data and Forecast of Kenya Flake Graphite Market Revenues & Volume By Friction Product for the Period 2022-2032F
- Historical Data and Forecast of Kenya Flake Graphite Market Revenues & Volume By Lubricant for the Period 2022-2032F
- Historical Data and Forecast of Kenya Flake Graphite Market Revenues & Volume By Others for the Period 2022-2032F
- Historical Data and Forecast of Kenya Flake Graphite Market Revenues & Volume By End-users for the Period 2022-2032F
- Historical Data and Forecast of Kenya Flake Graphite Market Revenues & Volume By Automotive for the Period 2022-2032F
- Historical Data and Forecast of Kenya Flake Graphite Market Revenues & Volume By Power for the Period 2022-2032F
- Historical Data and Forecast of Kenya Flake Graphite Market Revenues & Volume By Electronic for the Period 2022-2032F
- Kenya Flake Graphite Import Export Trade Statistics
- Market Opportunity Assessment By Flake Size
- Market Opportunity Assessment By Application
- Market Opportunity Assessment By End-users
- Kenya Flake Graphite Top Companies Market Share
- Kenya Flake Graphite Competitive Benchmarking By Technical and Operational Parameters
- Kenya Flake Graphite Company Profiles
- Kenya Flake Graphite Key Strategic Recommendations
Kenya Flake Graphite Market - Frequently Asked Questions
The Kenya Flake Graphite Market is projected to reach USD 582 Million by 2032, growing from USD 423 Million in 2025 at a CAGR of 4.7% during the period from 2026 to 2032.
Global trends, particularly the shift towards electric vehicles and renewable energy, are significantly bolstering demand for flake graphite in Kenya, thereby attracting foreign investment.
The Kenyan government is actively supporting the growth of the graphite sector through tax incentives, streamlined regulatory frameworks, and a focus on sustainable mining practices.
Regions such as Meru and Kitui are particularly promising due to their rich graphite deposits and have attracted significant investment interest.
Local producers are grappling with infrastructure limitations and production cost inefficiencies, alongside competition from countries with more established supply chains.
6Wresearch actively monitors the Kenya Flake Graphite Market and publishes its comprehensive annual report, highlighting emerging trends, growth drivers, revenue analysis, and forecast outlook. Our insights help businesses to make data-backed strategic decisions with ongoing market dynamics. Our analysts track relevent industries related to the Kenya Flake Graphite Market, allowing our clients with actionable intelligence and reliable forecasts tailored to emerging regional needs.
Yes, we provide customisation as per your requirements. To learn more, feel free to contact us on sales@6wresearch.com
1 Executive Summary |
2 Introduction |
2.1 Key Highlights of the Report |
2.2 Report Description |
2.3 Market Scope & Segmentation |
2.4 Research Methodology |
2.5 Assumptions |
3 Kenya Flake Graphite Market Overview |
3.1 Kenya Country Macro Economic Indicators |
3.2 Kenya Flake Graphite Market Revenues & Volume, 2022 & 2032F |
3.3 Kenya Flake Graphite Market - Industry Life Cycle |
3.4 Kenya Flake Graphite Market - Porter's Five Forces |
3.5 Kenya Flake Graphite Market Revenues & Volume Share, By Flake Size, 2022 & 2032F |
3.6 Kenya Flake Graphite Market Revenues & Volume Share, By Form, 2022 & 2032F |
3.7 Kenya Flake Graphite Market Revenues & Volume Share, By End-users, 2022 & 2032F |
4 Kenya Flake Graphite Market Dynamics |
4.1 Impact Analysis |
4.2 Market Drivers |
4.3 Market Restraints |
5 Kenya Flake Graphite Market Trends |
6 Kenya Flake Graphite Market, By Types |
6.1 Kenya Flake Graphite Market, By Flake Size |
6.1.1 Overview and Analysis |
6.1.2 Kenya Flake Graphite Market Revenues & Volume, By Flake Size, 2022-2032F |
6.1.3 Kenya Flake Graphite Market Revenues & Volume, By Jumbo, 2022-2032F |
6.1.4 Kenya Flake Graphite Market Revenues & Volume, By Large, 2022-2032F |
6.1.5 Kenya Flake Graphite Market Revenues & Volume, By Medium, 2022-2032F |
6.1.6 Kenya Flake Graphite Market Revenues & Volume, By Small, 2022-2032F |
6.1.7 Kenya Flake Graphite Market Revenues & Volume, By Fine, 2022-2032F |
6.2 Kenya Flake Graphite Market, By Application |
6.2.1 Overview and Analysis |
6.2.2 Kenya Flake Graphite Market Revenues & Volume, By Refractory, 2022-2032F |
6.2.3 Kenya Flake Graphite Market Revenues & Volume, By Foundry, 2022-2032F |
6.2.4 Kenya Flake Graphite Market Revenues & Volume, By Battery, 2022-2032F |
6.2.5 Kenya Flake Graphite Market Revenues & Volume, By Friction Product, 2022-2032F |
6.2.6 Kenya Flake Graphite Market Revenues & Volume, By Lubricant, 2022-2032F |
6.2.7 Kenya Flake Graphite Market Revenues & Volume, By Others, 2022-2032F |
6.3 Kenya Flake Graphite Market, By End-users |
6.3.1 Overview and Analysis |
6.3.2 Kenya Flake Graphite Market Revenues & Volume, By Automotive, 2022-2032F |
6.3.3 Kenya Flake Graphite Market Revenues & Volume, By Power, 2022-2032F |
6.3.4 Kenya Flake Graphite Market Revenues & Volume, By Electronic, 2022-2032F |
7 Kenya Flake Graphite Market Import-Export Trade Statistics |
7.1 Kenya Flake Graphite Market Export to Major Countries |
7.2 Kenya Flake Graphite Market Imports from Major Countries |
8 Kenya Flake Graphite Market Key Performance Indicators |
9 Kenya Flake Graphite Market - Opportunity Assessment |
9.1 Kenya Flake Graphite Market Opportunity Assessment, By Flake Size, 2022 & 2032F |
9.2 Kenya Flake Graphite Market Opportunity Assessment, By Application, 2022 & 2032F |
9.3 Kenya Flake Graphite Market Opportunity Assessment, By End-users, 2022 & 2032F |
10 Kenya Flake Graphite Market - Competitive Landscape |
10.1 Kenya Flake Graphite Market Revenue Share, By Companies, 2025 |
10.2 Kenya Flake Graphite Market Competitive Benchmarking, By Operating and Technical Parameters |
11 Company Profiles |
12 Recommendations |
13 Disclaimer |
Global Go To Market Strategy - 2030
Export potential enables firms to identify high-growth global markets with greater confidence by combining advanced trade intelligence with a structured quantitative methodology. The framework analyzes emerging demand trends and country-level import patterns while integrating macroeconomic and trade datasets such as GDP and population forecasts, bilateral import–export flows, tariff structures, elasticity differentials between developed and developing economies, geographic distance, and import demand projections. Using weighted trade values from 2020–2024 as the base period to project country-to-country export potential for 2030, these inputs are operationalized through calculated drivers such as gravity model parameters, tariff impact factors, and projected GDP per-capita growth. Through an analysis of hidden potentials, demand hotspots, and market conditions that are most favorable to success, this method enables firms to focus on target countries, maximize returns, and global expansion with data, backed by accuracy.
By factoring in the projected importer demand gap that is currently unmet and could be potential opportunity, it identifies the potential for the Exporter (Country) among 190 countries, against the general trade analysis, which identifies the biggest importer or exporter.
To discover high-growth global markets and optimize your business strategy:
Click Here
Pricing
- Single User License$ 1,995
- Department License$ 2,400
- Site License$ 3,120
- Global License$ 3,795

Leadership Perspectives from Industry Events
Search
Thought Leadership and Analyst Meet


Our Clients
6WResearch In News
- India Air Conditioner Market Set for Strong Rebound in 2026 After Weather-Led Correction and GST-Driven Recovery: 6Wresearch
- ADAS in India: How Automatic Emergency Braking, Blind Spot Detection & Driver Monitoring are Transforming Road Safety
- Doha a strategic location for EV manufacturing hub: IPA Qatar
- Demand for luxury TVs surging in the GCC, says Samsung
- Empowering Growth: The Thriving Journey of Bangladesh’s Cable Industry
- Demand for luxury TVs surging in the GCC, says Samsung
Latest Reports
- Nicaragua RPG Gaming Market (2026-2032)
- New Zealand RPG Gaming Market (2026-2032)
- Netherlands RPG Gaming Market (2026-2032)
- Nauru RPG Gaming Market (2026-2032)
- Namibia RPG Gaming Market (2026-2032)
- Mozambique RPG Gaming Market (2026-2032)
- Montenegro RPG Gaming Market (2026-2032)
- Mongolia RPG Gaming Market (2026-2032)
- Monaco RPG Gaming Market (2026-2032)
- Micronesia RPG Gaming Market (2026-2032)
Industry Events and Analyst Meet

HIMTEX 2026

India Refining Summit 2026

India EV Show 2026

EV tech India Expo 2026

Auto Tech Asia 2026
Whitepaper
- Middle East & Africa Commercial Security Market Click here to view more.
- Middle East & Africa Fire Safety Systems & Equipment Market Click here to view more.
- GCC Drone Market Click here to view more.
- Middle East Lighting Fixture Market Click here to view more.
- GCC Physical & Perimeter Security Market Click here to view more.