Kenya Flavored Syrups Market Outlook | COVID-19 IMPACT, Revenue, Value, Analysis, Size, Industry, Share, Growth, Forecast, Trends & Companies
Market Forecast By Flavor (Fruit, Chocolate, Vanilla, Coffee, Herbs & Seasonings), By Application (Beverages, Diary & Frozen Desserts, Confectionery, Bakery), By Flavor Type (Sweet, Salty, Sour, Savory, Mint), By Product type (Natural, Synthetic) And Competitive Landscape
| Product Code: ETC388610 | Publication Date: Aug 2022 | Updated Date: Apr 2025 | Product Type: Market Research Report | |
| Publisher: 6Wresearch | Author: Ravi Bhandari | No. of Pages: 75 | No. of Figures: 35 | No. of Tables: 20 |
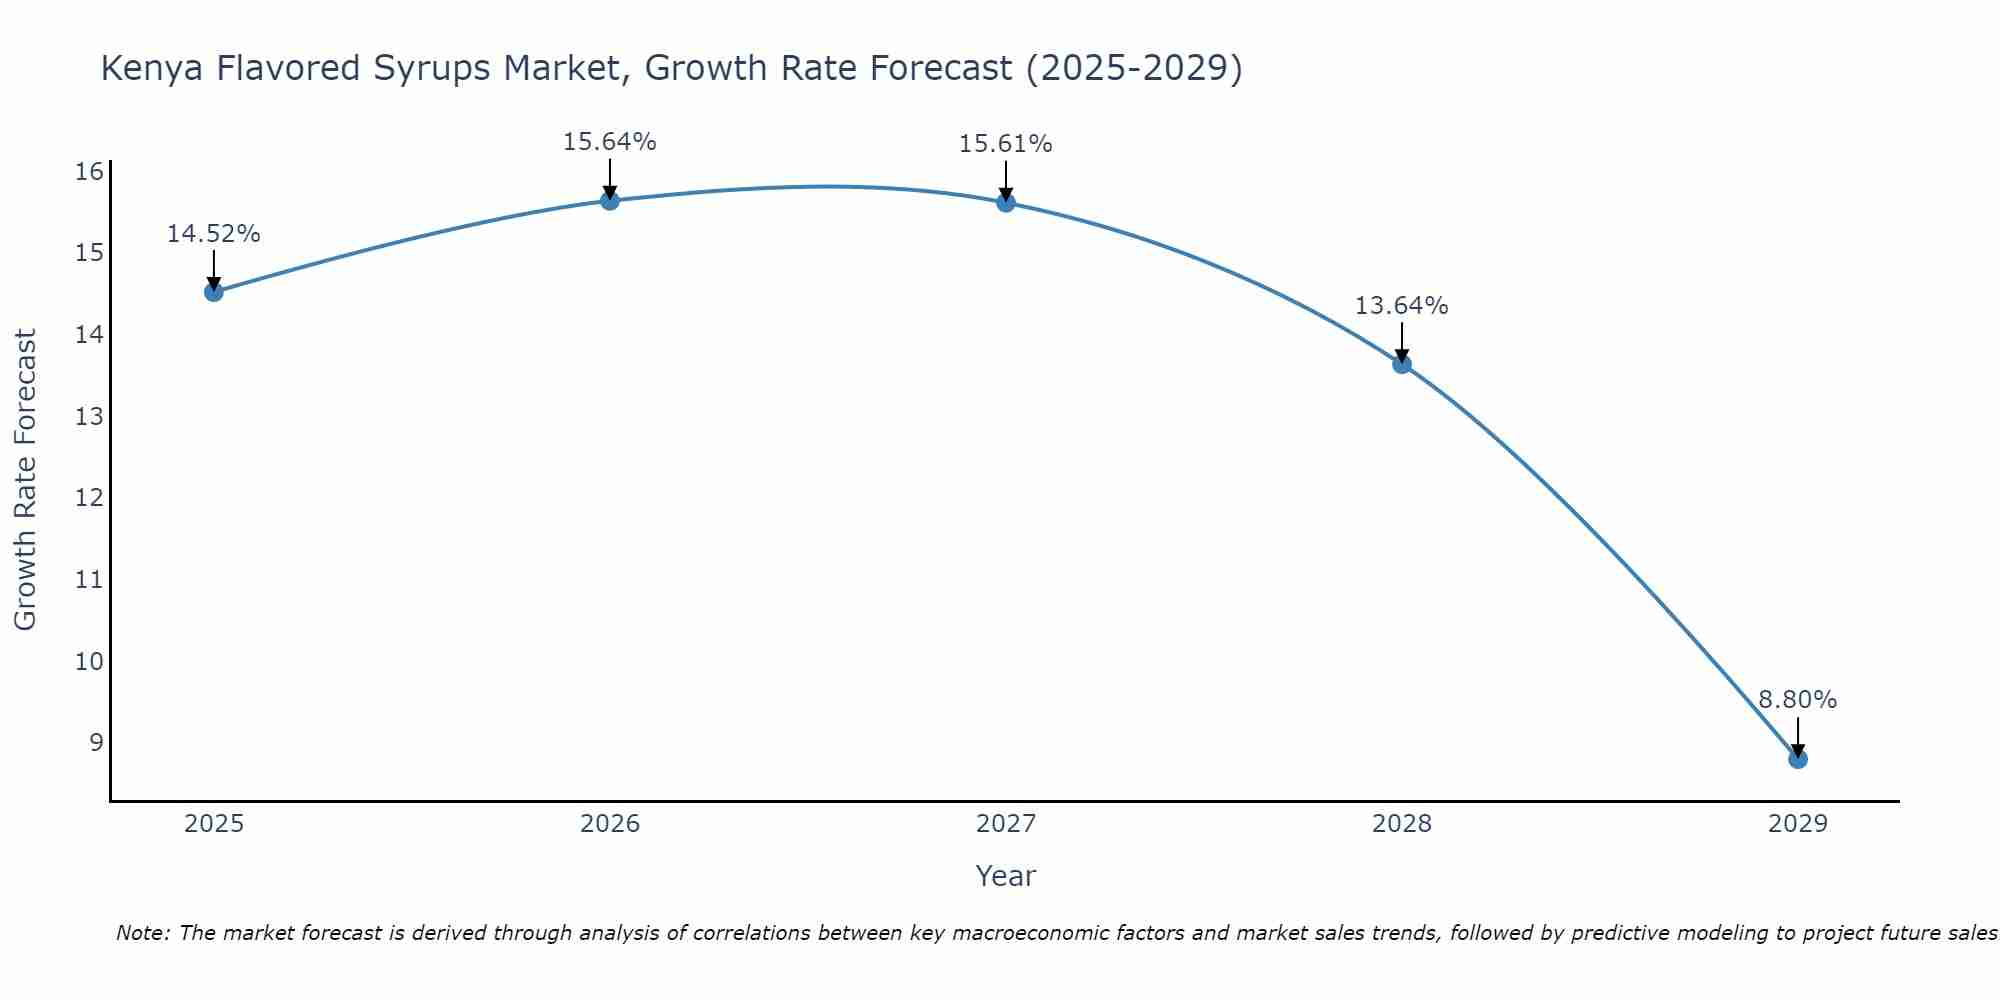
Kenya Flavored Syrups Market Size Growth Rate
The Kenya Flavored Syrups Market is projected to witness mixed growth rate patterns during 2025 to 2029. Starting at 14.52% in 2025, the market peaks at 15.64% in 2026, and settles at 8.80% by 2029.
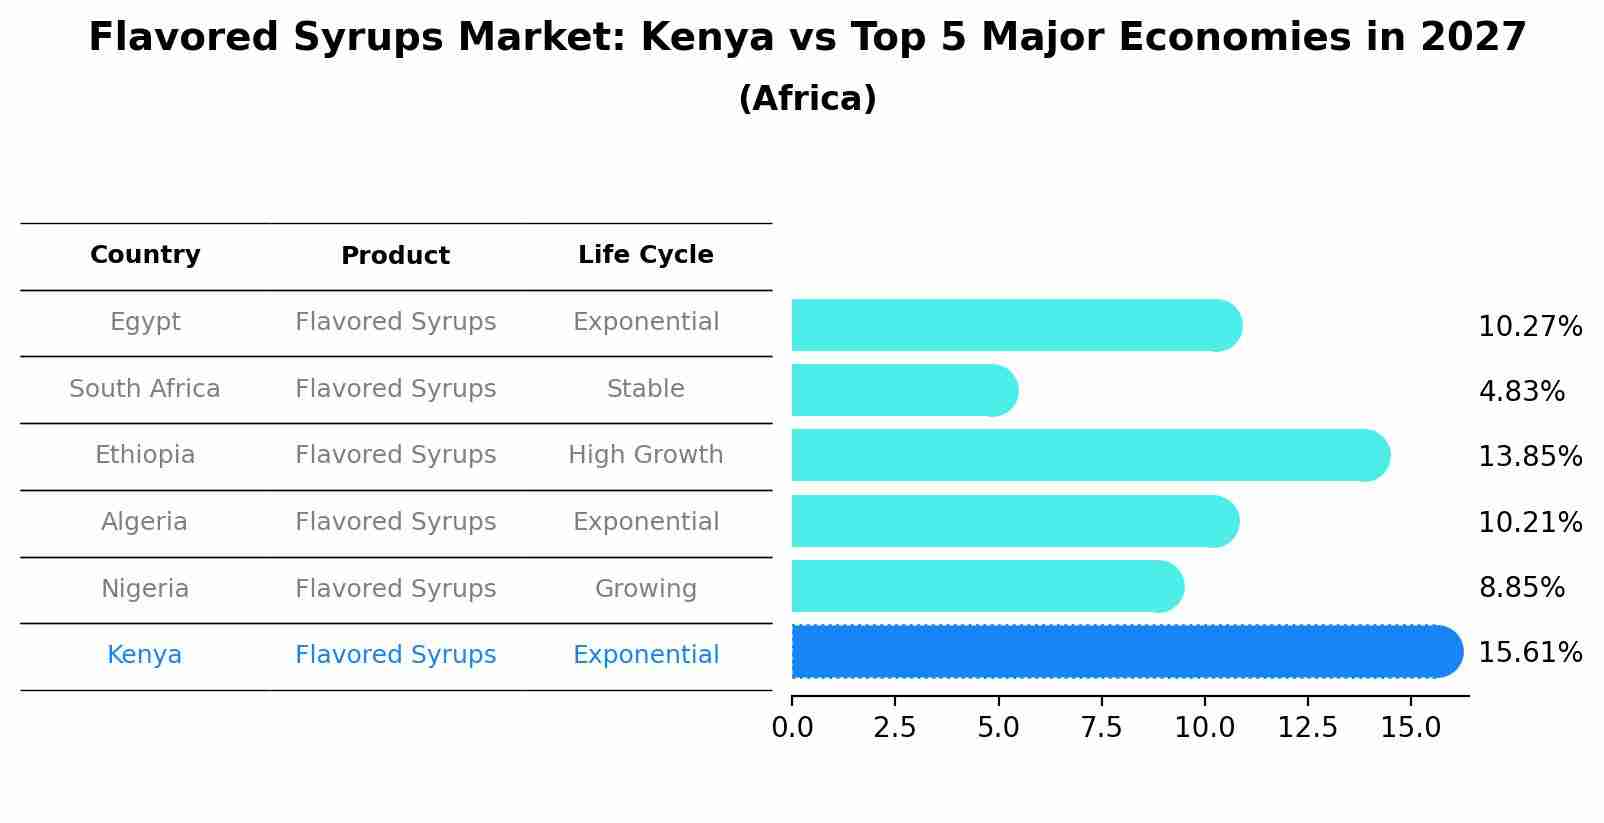
Flavored Syrups Market: Kenya vs Top 5 Major Economies in 2027 (Africa)
In the Africa region, the Flavored Syrups market in Kenya is projected to expand at a exponential growth rate of 15.61% by 2027. The largest economy is Egypt, followed by South Africa, Ethiopia, Algeria and Nigeria.
Kenya Flavored Syrups Market Overview
The Kenya flavored syrups market is experiencing steady growth as consumers seek diverse and innovative flavors to enhance their culinary experiences, beverages, and desserts. Flavored syrups, available in a wide range of flavors such as vanilla, caramel, fruit, and chocolate, offer versatility and convenience for adding sweetness and flavor to various food and beverage products. With the increasing demand for specialty coffee drinks, flavored cocktails, and gourmet desserts, there is a rising popularity of flavored syrups in Kenya. Key players in the market are offering a variety of syrups made from natural ingredients, sugar-free options, and customizable flavors to cater to the diverse preferences of consumers and foodservice establishments in Kenya.
Drivers of the market
Increasing demand for flavored beverages, growing preference for gourmet coffee and cocktails, and innovations in flavor profiles and packaging drive the flavored syrups market in Kenya. Flavored syrups offer versatility in creating customized drinks, enhancing consumer experiences, and driving market growth in the foodservice and retail sectors.
Challenges of the market
The flavored syrups market in Kenya faces challenges related to consumer preferences and health concerns. While flavored syrups are popular for enhancing the taste of beverages and desserts, there is a growing demand for healthier alternatives due to increasing awareness of sugar-related health issues. This shift in consumer preferences towards healthier options poses a challenge for manufacturers who must innovate to meet these changing demands while maintaining the taste and quality of their products. Additionally, the market is affected by fluctuations in ingredient prices, particularly for natural flavorings, which can impact production costs and ultimately retail prices, further influencing consumer purchasing decisions.
Government Policy of the market
Recognizing the growing demand for flavored syrups in various food and beverage applications, Kenya has initiated policies to regulate and support the flavored syrups market. By enforcing food safety standards, promoting innovation in flavor development, and facilitating market access for local producers, the government aims to ensure product quality, enhance consumer choice, and promote growth and competitiveness in the flavored syrups industry.
Key Highlights of the Report:
- Kenya Flavored Syrups Market Outlook
- Market Size of Kenya Flavored Syrups Market, 2021
- Forecast of Kenya Flavored Syrups Market, 2028
- Historical Data and Forecast of Kenya Flavored Syrups Revenues & Volume for the Period 2018 - 2028
- Kenya Flavored Syrups Market Trend Evolution
- Kenya Flavored Syrups Market Drivers and Challenges
- Kenya Flavored Syrups Price Trends
- Kenya Flavored Syrups Porter's Five Forces
- Kenya Flavored Syrups Industry Life Cycle
- Historical Data and Forecast of Kenya Flavored Syrups Market Revenues & Volume By Flavor for the Period 2018 - 2028
- Historical Data and Forecast of Kenya Flavored Syrups Market Revenues & Volume By Fruit for the Period 2018 - 2028
- Historical Data and Forecast of Kenya Flavored Syrups Market Revenues & Volume By Chocolate for the Period 2018 - 2028
- Historical Data and Forecast of Kenya Flavored Syrups Market Revenues & Volume By Vanilla for the Period 2018 - 2028
- Historical Data and Forecast of Kenya Flavored Syrups Market Revenues & Volume By Coffee for the Period 2018 - 2028
- Historical Data and Forecast of Kenya Flavored Syrups Market Revenues & Volume By Herbs & Seasonings for the Period 2018 - 2028
- Historical Data and Forecast of Kenya Flavored Syrups Market Revenues & Volume By Application for the Period 2018 - 2028
- Historical Data and Forecast of Kenya Flavored Syrups Market Revenues & Volume By Beverages for the Period 2018 - 2028
- Historical Data and Forecast of Kenya Flavored Syrups Market Revenues & Volume By Diary & Frozen Desserts for the Period 2018 - 2028
- Historical Data and Forecast of Kenya Flavored Syrups Market Revenues & Volume By Confectionery for the Period 2018 - 2028
- Historical Data and Forecast of Kenya Flavored Syrups Market Revenues & Volume By Bakery for the Period 2018 - 2028
- Historical Data and Forecast of Kenya Flavored Syrups Market Revenues & Volume By Flavor Type for the Period 2018 - 2028
- Historical Data and Forecast of Kenya Flavored Syrups Market Revenues & Volume By Sweet for the Period 2018 - 2028
- Historical Data and Forecast of Kenya Flavored Syrups Market Revenues & Volume By Salty for the Period 2018 - 2028
- Historical Data and Forecast of Kenya Flavored Syrups Market Revenues & Volume By Sour for the Period 2018 - 2028
- Historical Data and Forecast of Kenya Flavored Syrups Market Revenues & Volume By Savory for the Period 2018 - 2028
- Historical Data and Forecast of Kenya Flavored Syrups Market Revenues & Volume By Mint for the Period 2018 - 2028
- Historical Data and Forecast of Kenya Flavored Syrups Market Revenues & Volume By Product type for the Period 2018 - 2028
- Historical Data and Forecast of Kenya Flavored Syrups Market Revenues & Volume By Natural for the Period 2018 - 2028
- Historical Data and Forecast of Kenya Flavored Syrups Market Revenues & Volume By Synthetic for the Period 2018 - 2028
- Kenya Flavored Syrups Import Export Trade Statistics
- Market Opportunity Assessment By Flavor
- Market Opportunity Assessment By Application
- Market Opportunity Assessment By Flavor Type
- Market Opportunity Assessment By Product type
- Kenya Flavored Syrups Top Companies Market Share
- Kenya Flavored Syrups Competitive Benchmarking By Technical and Operational Parameters
- Kenya Flavored Syrups Company Profiles
- Kenya Flavored Syrups Key Strategic Recommendations
Frequently Asked Questions About the Market Study (FAQs):
6Wresearch actively monitors the Kenya Flavored Syrups Market and publishes its comprehensive annual report, highlighting emerging trends, growth drivers, revenue analysis, and forecast outlook. Our insights help businesses to make data-backed strategic decisions with ongoing market dynamics. Our analysts track relevent industries related to the Kenya Flavored Syrups Market, allowing our clients with actionable intelligence and reliable forecasts tailored to emerging regional needs.
Yes, we provide customisation as per your requirements. To learn more, feel free to contact us on sales@6wresearch.com
Global Go To Market Strategy - 2030
Export potential enables firms to identify high-growth global markets with greater confidence by combining advanced trade intelligence with a structured quantitative methodology. The framework analyzes emerging demand trends and country-level import patterns while integrating macroeconomic and trade datasets such as GDP and population forecasts, bilateral import–export flows, tariff structures, elasticity differentials between developed and developing economies, geographic distance, and import demand projections. Using weighted trade values from 2020–2024 as the base period to project country-to-country export potential for 2030, these inputs are operationalized through calculated drivers such as gravity model parameters, tariff impact factors, and projected GDP per-capita growth. Through an analysis of hidden potentials, demand hotspots, and market conditions that are most favorable to success, this method enables firms to focus on target countries, maximize returns, and global expansion with data, backed by accuracy.
By factoring in the projected importer demand gap that is currently unmet and could be potential opportunity, it identifies the potential for the Exporter (Country) among 190 countries, against the general trade analysis, which identifies the biggest importer or exporter.
To discover high-growth global markets and optimize your business strategy:
Click Here
Pricing
- Single User License$ 1,995
- Department License$ 2,400
- Site License$ 3,120
- Global License$ 3,795

Leadership Perspectives from Industry Events
Search
Thought Leadership and Analyst Meet


Our Clients
6WResearch In News
- Doha a strategic location for EV manufacturing hub: IPA Qatar
- Demand for luxury TVs surging in the GCC, says Samsung
- Empowering Growth: The Thriving Journey of Bangladesh’s Cable Industry
- Demand for luxury TVs surging in the GCC, says Samsung
- Video call with a traditional healer? Once unthinkable, it’s now common in South Africa
- Intelligent Buildings To Smooth GCC’s Path To Net Zero
Latest Reports
- Taiwan Airport Wireless Infrastructure Market (2026-2032)
- Vietnam Airport Wireless Infrastructure Market (2026-2032)
- Thailand Airport Wireless Infrastructure Market (2026-2032)
- South Korea Airport Wireless Infrastructure Market (2026-2032)
- Romania Airport Wireless Infrastructure Market (2026-2032)
- Qatar Airport Wireless Infrastructure Market (2026-2032)
- Philippines Airport Wireless Infrastructure Market (2026-2032)
- Japan Airport Wireless Infrastructure Market (2026-2032)
- Taiwan Airport Winter Services Market (2026-2032)
- Vietnam Airport Winter Services Market (2026-2032)
Industry Events and Analyst Meet

HIMTEX 2026

India Refining Summit 2026

India EV Show 2026

EV tech India Expo 2026

Auto Tech Asia 2026
Whitepaper
- Middle East & Africa Commercial Security Market Click here to view more.
- Middle East & Africa Fire Safety Systems & Equipment Market Click here to view more.
- GCC Drone Market Click here to view more.
- Middle East Lighting Fixture Market Click here to view more.
- GCC Physical & Perimeter Security Market Click here to view more.