Kenya Industrial Gases Market (2026-2032) | Outlook, Revenue, Industry, Analysis, Trends, Value, Share, Companies, Size, Growth & Forecast
Market Forecast By Product Type (Oxygen, Nitrogen, Hydrogen, Carbon Dioxide, Acetylene, Argon, Others), By Application (Healthcare, Manufacturing, Metallurgy & Glasses, Food & Beverage, Retail, Chemicals & Energy, Others), By Distribution (On-site, Bulk (Liquid Gas Transport), Cylinder (Merchant)) And Competitive Landscape
| Product Code: ETC042031 | Publication Date: Jan 2021 | Updated Date: Jun 2026 | Product Type: Report | |
| Publisher: 6Wresearch | Author: Ravi Bhandari | No. of Pages: 70 | No. of Figures: 35 | No. of Tables: 5 |
Kenya Industrial Gases Market Summary
The kenya industrial gases market was estimated at USD 198 Million in 2025 and is projected to reach USD 217 Million by 2032, growing at a CAGR of 0.9% from 2026 to 2032.
Kenya Industrial Gases Market Year-wise Growth Rate and Key Drivers
This graph highlights how the Kenya Industrial Gases Market has steadily grown over the past five years, supported by major growth factors.
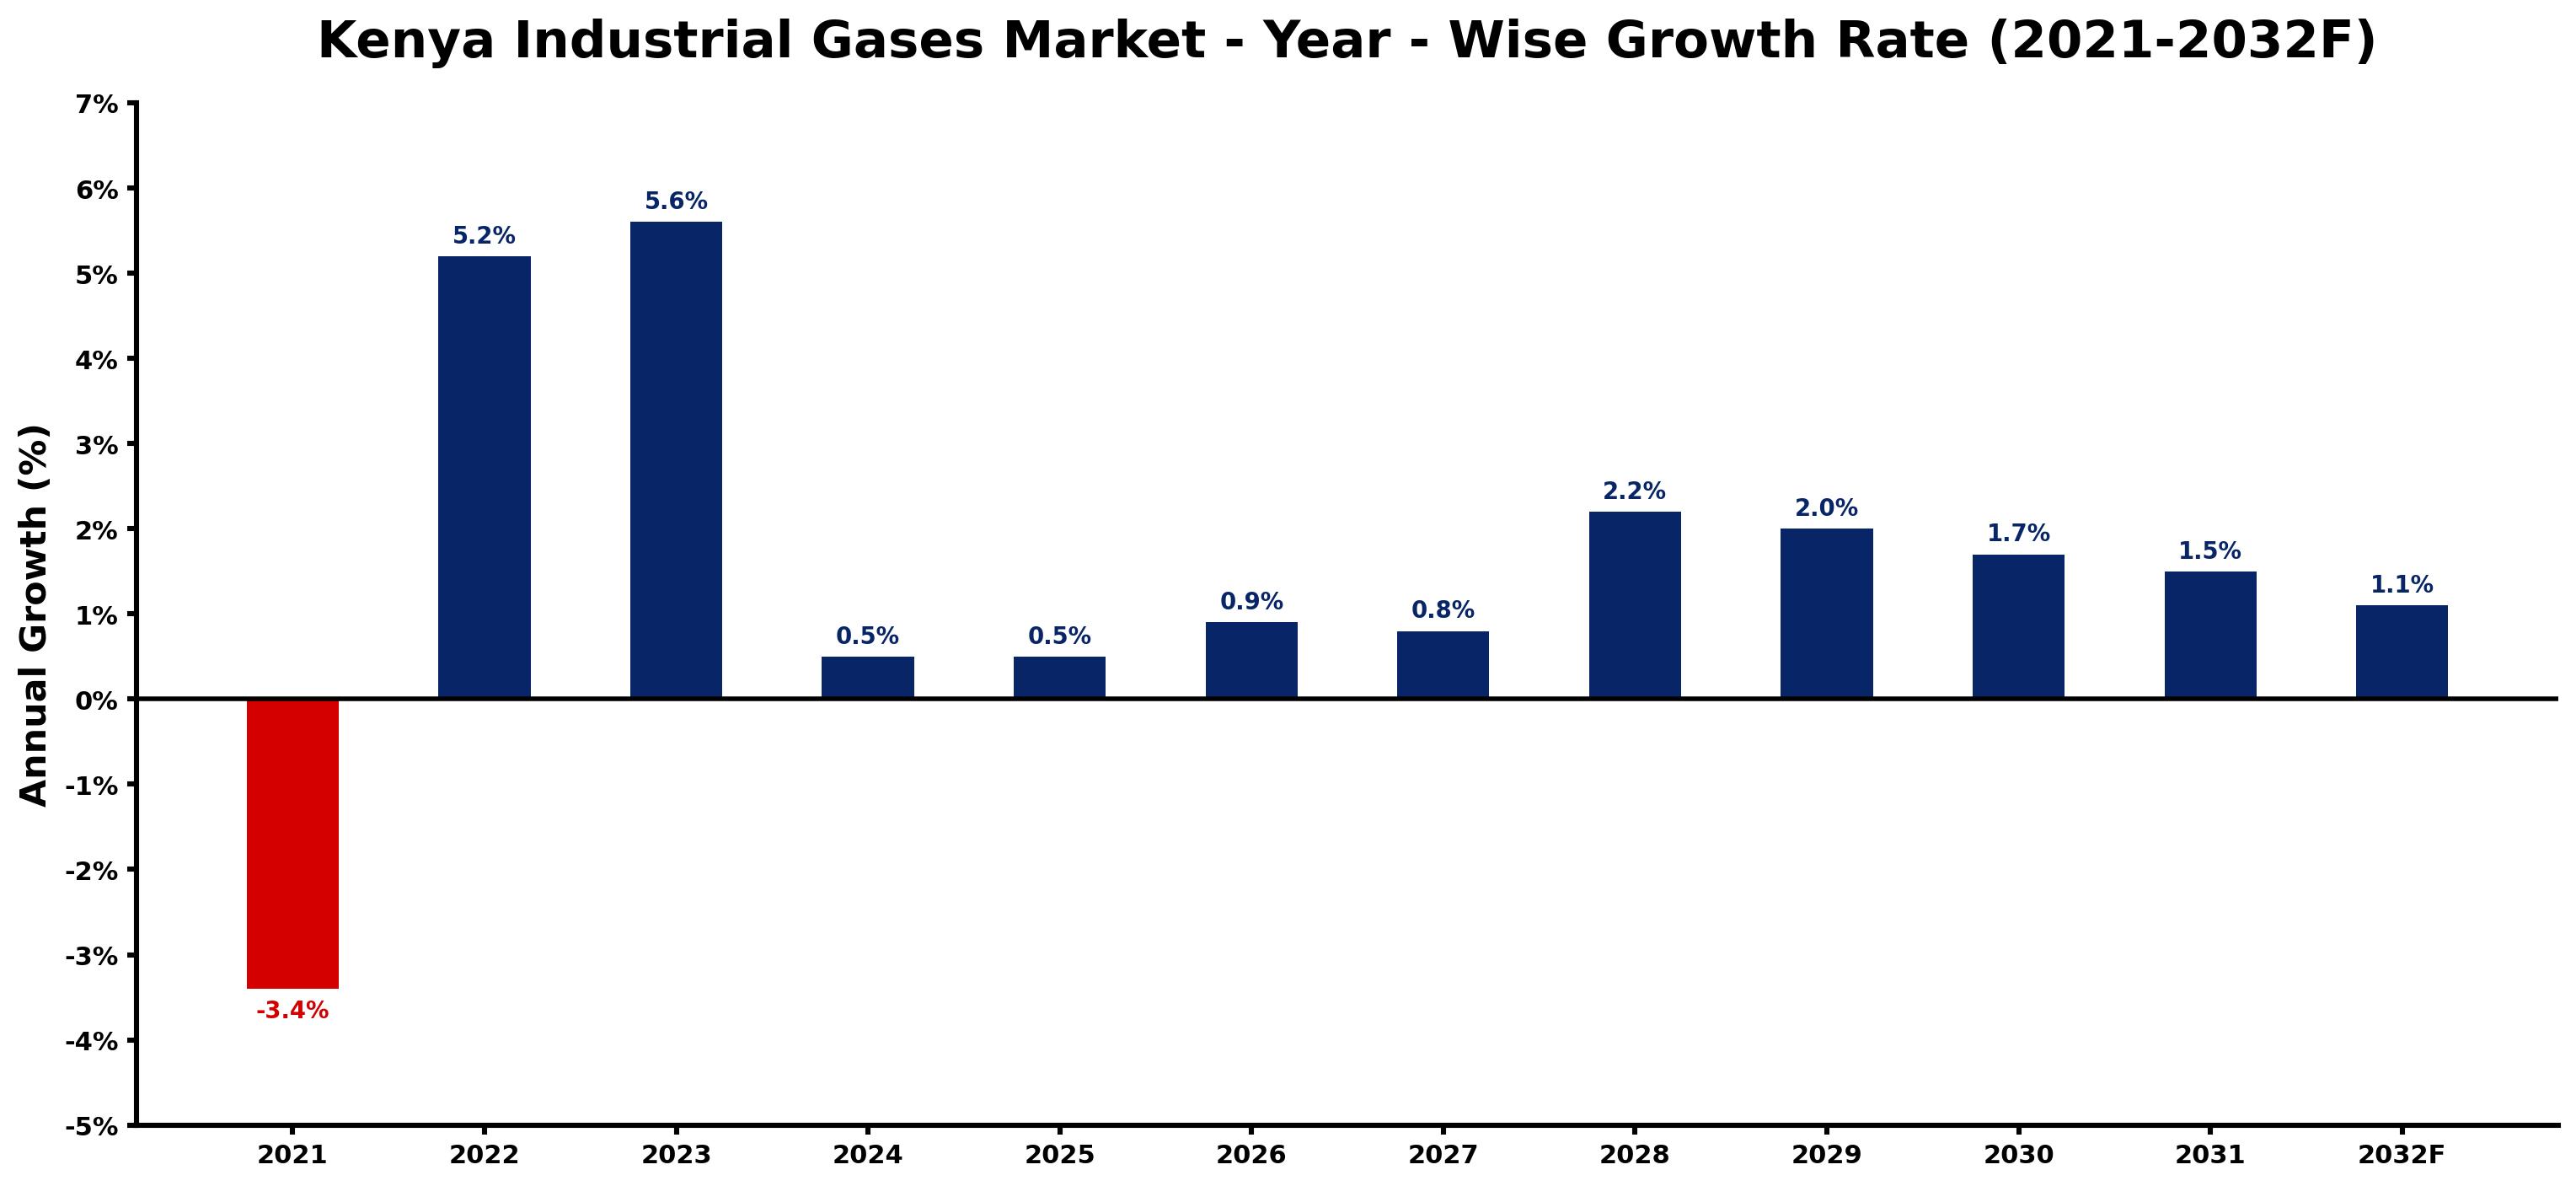
The table below presents the year wise growth rates along with the key drivers influencing the market
| Year | Growth Rate | Major Drivers |
| 2021 | -3.4% | Supply chain disruptions during the pandemic hampered delivery efficiency, diminishing demand for industrial gases in manufacturing. |
| 2022 | 5.2% | Investment in renewable energy projects highlighted the importance of industrial gases supply. |
| 2023 | 5.6% | Construction sector expansion created heightened needs for specialized gas applications. |
| 2024 | 0.5% | Local manufacturers focused on enhancing product quality through advanced gas technologies. |
| 2025 | 0.5% | Evolving trends in healthcare put medical gases in the spotlight, boosting demand. |
| 2026 | 0.9% | Emergence of green technologies shifted focus towards sustainable gas production methods. |
| 2027 | 0.8% | Infrastructural development boosted logistics, impacting gas distribution efficiency positively. |
| 2028 | 2.2% | Increased urbanization called for reliable gas supply in residential heating and cooking. |
| 2029 | 2.0% | Technological advancements led to innovations in industrial gas applications and efficiency. |
| 2030 | 1.7% | Rising interest in gas-based energy solutions attracted foreign investments in the sector. |
| 2031 | 1.5% | Collaboration between local and international firms introduced advanced gas production techniques. |
| 2032 | 1.1% | Consumer preferences shifted towards eco-friendly options, driving sustainable gas solutions. |
Note - Market size estimations and growth projections presented in this report are based on 6Wresearch's advanced forecasting approach, validated with industry datasets as of June 2026.
Kenya Industrial Gases Market Synopsis
The Kenya Industrial Gases Market is projected to reach 0.9% and witness significant growth during the forecast period (2026-2032). This growth is being fueled by an upward trend in the demand for industrial gases across key sectors, including healthcare, manufacturing, and food processing. The market landscape is becoming increasingly competitive, reflecting the essential nature of industrial gases in facilitating operations and enhancing productivity in various industries.
Kenya Industrial Gases Market Growth Drivers
Several factors are propelling the growth of the Kenya Industrial Gases Market. Firstly, the rapid expansion of healthcare facilities and services has increased the demand for medical-grade gases such as oxygen and nitrous oxide. Secondly, the manufacturing sector is seeing a boost from industrialization initiatives, which require significant volumes of gases like nitrogen and carbon dioxide for processes such as welding, cutting, and chemical manufacturing.
- The healthcare sector's growth is supported by government initiatives aimed at improving access to medical services, subsequently increasing the consumption of industrial gases.
- Manufacturing expansion is driven by infrastructure development projects, necessitating the use of industrial gases to enhance operational efficiency.
- The food processing industry is emphasizing the importance of gases, particularly in food preservation and packaging, to meet rising consumer demand for safe and long-lasting products.
- Technological advancements are leading to more efficient gas production and distribution systems, which are vital for maintaining supply chain reliability.
- Environmental awareness is prompting industries to adopt cleaner technologies, further enhancing the adoption of industrial gases that support sustainability practices.
Kenya Industrial Gases Market Trends and Opportunities
The Kenya Industrial Gases Market is seeing a noticeable shift towards sustainability, with increasing adoption of environmentally friendly gases such as hydrogen and nitrogen. This transition is driven by the need to reduce carbon emissions and promote cleaner production techniques. Moreover, the focus on technological advancements is unlocking new efficiencies in gas production and distribution, thereby enhancing service delivery and responsiveness to market demands.
- There is a significant trend towards strategic collaborations between market players and technology providers aimed at enhancing product offerings and expanding service capabilities.
- Innovations in gas applications are emerging, particularly in sectors like metal fabrication, where specialized gases are becoming integral to process optimization.
- The emphasis on energy efficiency is leading companies to invest in automation and sophisticated control systems to improve operational performance.
- A growing interest in research and development activities is anticipated to yield advanced gas solutions tailored to specific industry needs, presenting new market opportunities.
- As Kenya continues to industrialize, the demand for gases across emerging sectors such as renewable energy will create a favorable environment for market expansion.
Kenya Industrial Gases Market Challenges and Restraints
Despite the promising growth prospects, the Kenya Industrial Gases Market faces several challenges that could hinder its expansion. Intense competition among suppliers can create price pressures, complicating profitability for manufacturers. Furthermore, the limited infrastructure for the distribution and storage of industrial gases presents logistical hurdles that need to be addressed.
- Reliability of electricity supply is critical; frequent outages can disrupt production processes and affect overall service reliability.
- The specialized handling of industrial gases necessitates a skilled workforce, which is currently limited, posing challenges in operational capabilities.
- Stringent regulatory constraints concerning safety and environmental impact require compliance, necessitating additional investments and operational adjustments.
- Fluctuations in raw material prices and currency exchange rates can adversely affect cost structures and profitability across the market.
- As the industry evolves, remaining compliant with changing regulations and securing necessary approvals may become increasingly complex.
Kenya Industrial Gases Market Investment Opportunities
Investment opportunities within the Kenya Industrial Gases Market are promising, driven primarily by the escalating demand from key industries. As industrialization progresses, sectors such as healthcare, manufacturing, food and beverage, and metal fabrication are emerging as significant consumers of industrial gases.
- Establishing manufacturing plants tailored to produce specific industrial gases could attract investment, particularly in regions with high demand.
- Developing robust distribution networks will be crucial to ensuring that gases reach consumers efficiently and safely, representing a worthwhile investment opportunity.
- Investors should consider technology-driven projects aimed at improving the production process and product quality, tapping into the trend of automation.
- Partnerships with local governments and educational institutions can foster innovation, providing a platform for research and development tailored to market needs.
- Exploring opportunities in niche markets, such as renewable energy integration, will be vital as industries shift towards sustainable practices.
Kenya Industrial Gases Market Government Investment and Initiatives
The Kenyan government has implemented several initiatives to promote the growth of the industrial gases market. Notably, the establishment of the Kenya Industrial Gases Association (KIGA) plays a pivotal role in regulating industry standards while promoting local production practices. This support aims to enhance the competitiveness of the sector and encourage domestic investment.
- Tax incentives and subsidies are offered to encourage investment in industrial gas production, aiming to lower operational costs and support new market entrants.
- Regulations ensuring the quality and safety of industrial gases are being enforced to protect consumers and promote industry integrity.
- The government's commitment to infrastructural development includes improving transport networks, which are vital for the effective distribution of industrial gases.
- Collaboration with international development organizations provides a framework for funding projects that enhance industrial capabilities within the sector.
- Public spending on healthcare and manufacturing infrastructure bolsters demand for industrial gases, aligning with national development strategies.
Kenya Industrial Gases Market Latest Developments (May 2025 - June 2026)
Recent developments within the Kenya Industrial Gases Market have focused on aligning production practices with sustainability goals. Companies are increasingly investing in technologies aimed at reducing emissions and enhancing energy efficiency. Additionally, partnerships are being formed to leverage expertise in production processes, leading to innovations that improve market offerings.
- Regulatory bodies have intensified efforts to ensure compliance with safety standards, reflecting a growing commitment to industry integrity.
- Increased collaboration between local producers and international firms has facilitated knowledge transfer and access to advanced technologies.
- There is an observable increase in R&D activities focused on developing new applications for industrial gases, aligning with evolving customer demands.
- Public investments have started focusing more on infrastructure improvements that support the distribution of industrial gases across urban and rural areas.
- Market players are adapting to consumer preferences by introducing new products that emphasize sustainability and reduce environmental impact.
Kenya Industrial Gases Market - Key Attractiveness of the Report
- 10 Years of Market Numbers
- Historical Data Starting from 2022 to 2025
- Base Year: 2025
- Forecast Data until 2032
- Key Performance Indicators Impacting the Market
- Major Upcoming Developments and Projects
Key Highlights of the Report:
- Kenya Industrial Gases Market Outlook
- Market Size of Kenya Industrial Gases Market, 2025
- Forecast of Kenya Industrial Gases Market, 2032F
- Historical Data and Forecast of Kenya Industrial Gases Revenues & Volume for the Period 2022-2032F
- Kenya Industrial Gases Market Trend Evolution
- Kenya Industrial Gases Market Drivers and Challenges
- Kenya Industrial Gases Price Trends
- Kenya Industrial Gases Porter's Five Forces
- Kenya Industrial Gases Industry Life Cycle
- Historical Data and Forecast of Kenya Industrial Gases Market Revenues & Volume By Product Type for the Period 2022-2032F
- Historical Data and Forecast of Kenya Industrial Gases Market Revenues & Volume By Oxygen for the Period 2022-2032F
- Historical Data and Forecast of Kenya Industrial Gases Market Revenues & Volume By Nitrogen for the Period 2022-2032F
- Historical Data and Forecast of Kenya Industrial Gases Market Revenues & Volume By Hydrogen for the Period 2022-2032F
- Historical Data and Forecast of Kenya Industrial Gases Market Revenues & Volume By Carbon Dioxide for the Period 2022-2032F
- Historical Data and Forecast of Kenya Industrial Gases Market Revenues & Volume By Acetylene for the Period 2022-2032F
- Historical Data and Forecast of Kenya Industrial Gases Market Revenues & Volume By Argon for the Period 2022-2032F
- Historical Data and Forecast of Kenya Industrial Gases Market Revenues & Volume By Others for the Period 2022-2032F
- Historical Data and Forecast of Kenya Industrial Gases Market Revenues & Volume By Application for the Period 2022-2032F
- Historical Data and Forecast of Kenya Industrial Gases Market Revenues & Volume By Healthcare for the Period 2022-2032F
- Historical Data and Forecast of Kenya Industrial Gases Market Revenues & Volume By Manufacturing for the Period 2022-2032F
- Historical Data and Forecast of Kenya Industrial Gases Market Revenues & Volume By Metallurgy & Glasses for the Period 2022-2032F
- Historical Data and Forecast of Kenya Industrial Gases Market Revenues & Volume By Food & Beverage for the Period 2022-2032F
- Historical Data and Forecast of Kenya Industrial Gases Market Revenues & Volume By Retail for the Period 2022-2032F
- Historical Data and Forecast of Kenya Industrial Gases Market Revenues & Volume By Chemicals & Energy for the Period 2022-2032F
- Historical Data and Forecast of Kenya Industrial Gases Market Revenues & Volume By Others for the Period 2022-2032F
- Historical Data and Forecast of Kenya Industrial Gases Market Revenues & Volume By Distribution for the Period 2022-2032F
- Historical Data and Forecast of Kenya Industrial Gases Market Revenues & Volume By On-site for the Period 2022-2032F
- Historical Data and Forecast of Kenya Industrial Gases Market Revenues & Volume By Bulk (Liquid Gas Transport) for the Period 2022-2032F
- Historical Data and Forecast of Kenya Industrial Gases Market Revenues & Volume By Cylinder (Merchant) for the Period 2022-2032F
- Kenya Industrial Gases Import Export Trade Statistics
- Market Opportunity Assessment By Product Type
- Market Opportunity Assessment By Application
- Market Opportunity Assessment By Distribution
- Kenya Industrial Gases Top Companies Market Share
- Kenya Industrial Gases Competitive Benchmarking By Technical and Operational Parameters
- Kenya Industrial Gases Company Profiles
- Kenya Industrial Gases Key Strategic Recommendations
Frequently Asked Questions About the Market Study (FAQs):
Growth is driven by increasing demand from sectors such as healthcare, manufacturing, and food processing, alongside advancements in technology.
Key challenges include intense competition, limited distribution infrastructure, and regulatory compliance complexities.
The government supports the market through initiatives like tax incentives, establishing regulatory frameworks, and promoting local production.
The market is set to grow steadily, driven by industrialization, technological advancements, and increasing investment opportunities.
6Wresearch actively monitors the Kenya Industrial Gases Market and publishes its comprehensive annual report, highlighting emerging trends, growth drivers, revenue analysis, and forecast outlook. Our insights help businesses to make data-backed strategic decisions with ongoing market dynamics. Our analysts track relevent industries related to the Kenya Industrial Gases Market, allowing our clients with actionable intelligence and reliable forecasts tailored to emerging regional needs.
Yes, we provide customisation as per your requirements. To learn more, feel free to contact us on sales@6wresearch.com
1 Executive Summary |
2 Introduction |
2.1 Key Highlights of the Report |
2.2 Report Description |
2.3 Market Scope & Segmentation |
2.4 Research Methodology |
2.5 Assumptions |
3 Kenya Industrial Gases Market Overview |
3.1 Kenya Country Macro Economic Indicators |
3.2 Kenya Industrial Gases Market Revenues & Volume, 2022 & 2032F |
3.3 Kenya Industrial Gases Market - Industry Life Cycle |
3.4 Kenya Industrial Gases Market - Porter's Five Forces |
3.5 Kenya Industrial Gases Market Revenues & Volume Share, By Product Type, 2022 & 2032F |
3.6 Kenya Industrial Gases Market Revenues & Volume Share, By Application, 2022 & 2032F |
3.7 Kenya Industrial Gases Market Revenues & Volume Share, By Distribution, 2022 & 2032F |
4 Kenya Industrial Gases Market Dynamics |
4.1 Impact Analysis |
4.2 Market Drivers |
4.2.1 Growing demand from industries such as healthcare, food and beverage, and manufacturing |
4.2.2 Increasing investments in infrastructure development and construction projects |
4.2.3 Adoption of environmentally friendly industrial gases for sustainable production processes |
4.3 Market Restraints |
4.3.1 Fluctuating prices of raw materials impacting production costs |
4.3.2 Regulatory challenges and compliance requirements related to the handling and distribution of industrial gases |
4.3.3 Competition from alternative technologies and substitutes in certain industries |
5 Kenya Industrial Gases Market Trends |
6 Kenya Industrial Gases Market, By Types |
6.1 Kenya Industrial Gases Market, By Product Type |
6.1.1 Overview and Analysis |
6.1.2 Kenya Industrial Gases Market Revenues & Volume, By Product Type, 2022-2032F |
6.1.3 Kenya Industrial Gases Market Revenues & Volume, By Oxygen, 2022-2032F |
6.1.4 Kenya Industrial Gases Market Revenues & Volume, By Nitrogen, 2022-2032F |
6.1.5 Kenya Industrial Gases Market Revenues & Volume, By Hydrogen, 2022-2032F |
6.1.6 Kenya Industrial Gases Market Revenues & Volume, By Carbon Dioxide, 2022-2032F |
6.1.7 Kenya Industrial Gases Market Revenues & Volume, By Acetylene, 2022-2032F |
6.1.8 Kenya Industrial Gases Market Revenues & Volume, By Argon, 2022-2032F |
6.2 Kenya Industrial Gases Market, By Application |
6.2.1 Overview and Analysis |
6.2.2 Kenya Industrial Gases Market Revenues & Volume, By Healthcare, 2022-2032F |
6.2.3 Kenya Industrial Gases Market Revenues & Volume, By Manufacturing, 2022-2032F |
6.2.4 Kenya Industrial Gases Market Revenues & Volume, By Metallurgy & Glasses, 2022-2032F |
6.2.5 Kenya Industrial Gases Market Revenues & Volume, By Food & Beverage, 2022-2032F |
6.2.6 Kenya Industrial Gases Market Revenues & Volume, By Retail, 2022-2032F |
6.2.7 Kenya Industrial Gases Market Revenues & Volume, By Chemicals & Energy, 2022-2032F |
6.3 Kenya Industrial Gases Market, By Distribution |
6.3.1 Overview and Analysis |
6.3.2 Kenya Industrial Gases Market Revenues & Volume, By On-site, 2022-2032F |
6.3.3 Kenya Industrial Gases Market Revenues & Volume, By Bulk (Liquid Gas Transport), 2022-2032F |
6.3.4 Kenya Industrial Gases Market Revenues & Volume, By Cylinder (Merchant), 2022-2032F |
7 Kenya Industrial Gases Market Import-Export Trade Statistics |
7.1 Kenya Industrial Gases Market Export to Major Countries |
7.2 Kenya Industrial Gases Market Imports from Major Countries |
8 Kenya Industrial Gases Market Key Performance Indicators |
8.1 Energy efficiency improvements in industrial processes |
8.2 Adoption rate of advanced technologies in industrial gas production and distribution |
8.3 Number of new industrial gas applications developed in key industries |
9 Kenya Industrial Gases Market - Opportunity Assessment |
9.1 Kenya Industrial Gases Market Opportunity Assessment, By Product Type, 2022 & 2032F |
9.2 Kenya Industrial Gases Market Opportunity Assessment, By Application, 2022 & 2032F |
9.3 Kenya Industrial Gases Market Opportunity Assessment, By Distribution, 2022 & 2032F |
10 Kenya Industrial Gases Market - Competitive Landscape |
10.1 Kenya Industrial Gases Market Revenue Share, By Companies, 2025 |
10.2 Kenya Industrial Gases Market Competitive Benchmarking, By Operating and Technical Parameters |
11 Company Profiles |
12 Recommendations |
13 Disclaimer |
Global Go To Market Strategy - 2030
Export potential enables firms to identify high-growth global markets with greater confidence by combining advanced trade intelligence with a structured quantitative methodology. The framework analyzes emerging demand trends and country-level import patterns while integrating macroeconomic and trade datasets such as GDP and population forecasts, bilateral import–export flows, tariff structures, elasticity differentials between developed and developing economies, geographic distance, and import demand projections. Using weighted trade values from 2020–2024 as the base period to project country-to-country export potential for 2030, these inputs are operationalized through calculated drivers such as gravity model parameters, tariff impact factors, and projected GDP per-capita growth. Through an analysis of hidden potentials, demand hotspots, and market conditions that are most favorable to success, this method enables firms to focus on target countries, maximize returns, and global expansion with data, backed by accuracy.
By factoring in the projected importer demand gap that is currently unmet and could be potential opportunity, it identifies the potential for the Exporter (Country) among 190 countries, against the general trade analysis, which identifies the biggest importer or exporter.
To discover high-growth global markets and optimize your business strategy:
Click Here
Pricing
- Single User License$ 1,995
- Department License$ 2,400
- Site License$ 3,120
- Global License$ 3,795

Leadership Perspectives from Industry Events
Search
Thought Leadership and Analyst Meet


Our Clients
6WResearch In News
- India Air Conditioner Market Set for Strong Rebound in 2026 After Weather-Led Correction and GST-Driven Recovery: 6Wresearch
- ADAS in India: How Automatic Emergency Braking, Blind Spot Detection & Driver Monitoring are Transforming Road Safety
- Doha a strategic location for EV manufacturing hub: IPA Qatar
- Demand for luxury TVs surging in the GCC, says Samsung
- Empowering Growth: The Thriving Journey of Bangladesh’s Cable Industry
- Demand for luxury TVs surging in the GCC, says Samsung
Latest Reports
- Nicaragua RPG Gaming Market (2026-2032)
- New Zealand RPG Gaming Market (2026-2032)
- Netherlands RPG Gaming Market (2026-2032)
- Nauru RPG Gaming Market (2026-2032)
- Namibia RPG Gaming Market (2026-2032)
- Mozambique RPG Gaming Market (2026-2032)
- Montenegro RPG Gaming Market (2026-2032)
- Mongolia RPG Gaming Market (2026-2032)
- Monaco RPG Gaming Market (2026-2032)
- Micronesia RPG Gaming Market (2026-2032)
Industry Events and Analyst Meet

EV India Expo 2026

HIMTEX 2026

India Refining Summit 2026

India EV Show 2026

EV tech India Expo 2026
Whitepaper
- Middle East & Africa Commercial Security Market Click here to view more.
- Middle East & Africa Fire Safety Systems & Equipment Market Click here to view more.
- GCC Drone Market Click here to view more.
- Middle East Lighting Fixture Market Click here to view more.
- GCC Physical & Perimeter Security Market Click here to view more.