Kenya industrial vehicles Market (2026-2032) | Revenue, Forecast, Growth, Trends, Industry, Value, Companies, Outlook, Analysis, Size & Share
Market Forecast By Product Type (Forklift, Aisle Truck, Tow Tractor, Container Handler), By Drive Type (Internal Combustion Engine, Battery-Operated, Gas-Powered), By Application (Industrial , Cargo) And Competitive Landscape
| Product Code: ETC029770 | Publication Date: Oct 2020 | Updated Date: Jun 2026 | Product Type: Report | |
| Publisher: 6Wresearch | Author: Ravi Bhandari | No. of Pages: 70 | No. of Figures: 35 | No. of Tables: 5 |
Kenya industrial vehicles Market Summary
The kenya industrial vehicles market was estimated at USD 234 Million in 2025 and is projected to reach USD 257 Million by 2032, growing at a CAGR of 1.1% from 2026 to 2032.
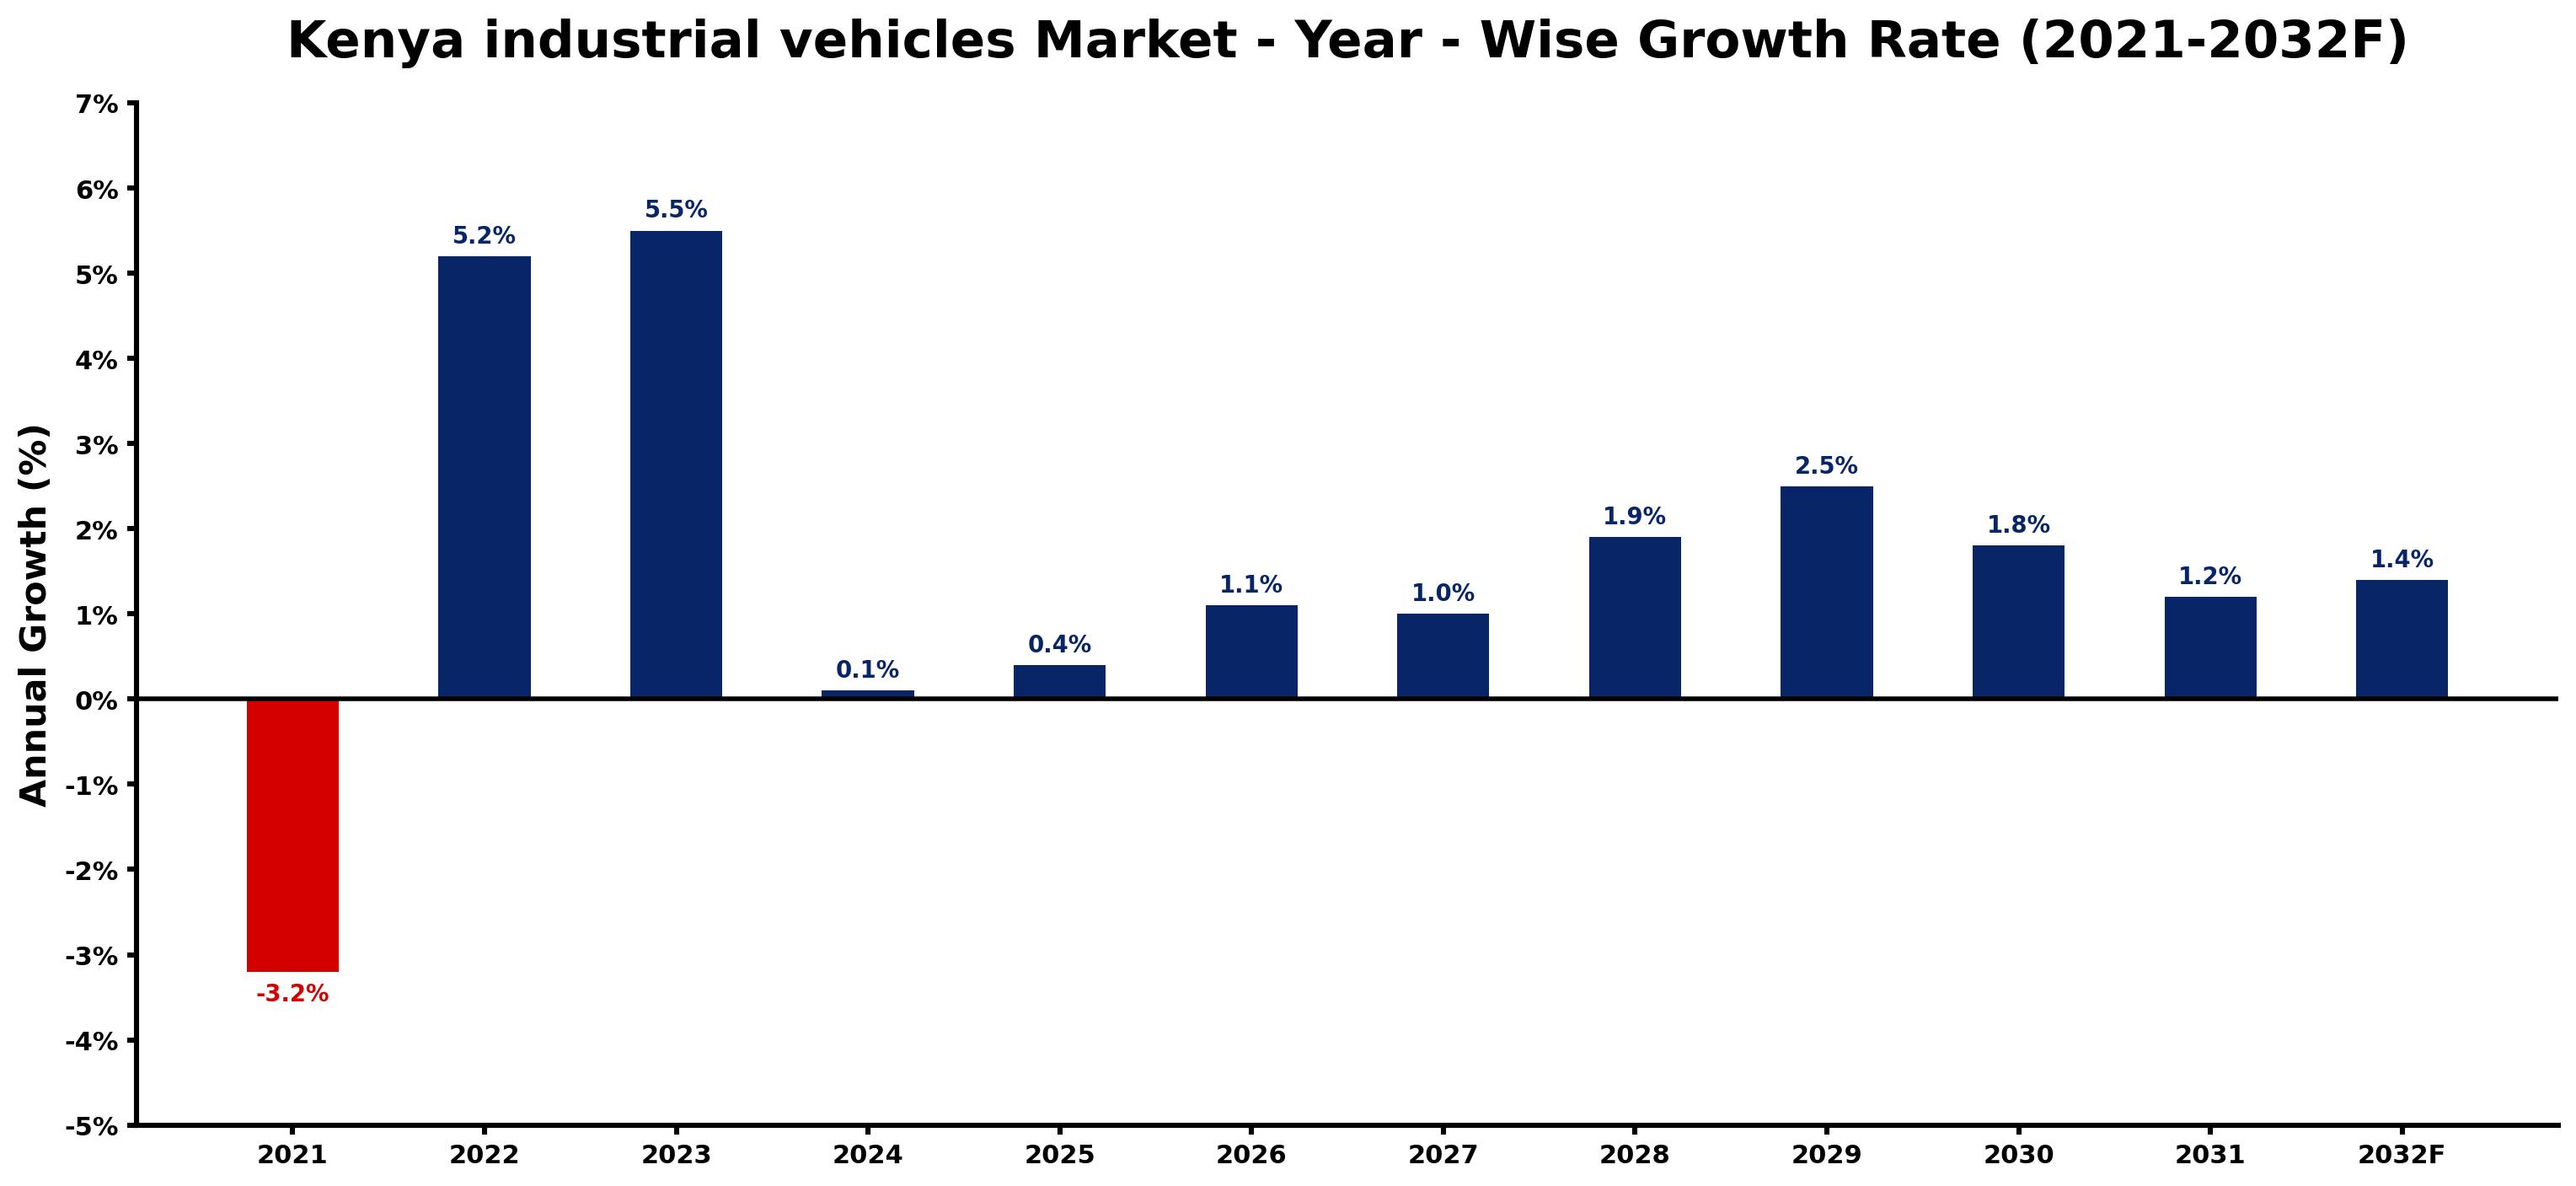
Kenya industrial vehicles Market Growth Rate Analysis (2021-2032)
The Kenya industrial vehicles market is experiencing a notable recovery, rebounding from a decline of 3.2% in 2021 to a growth of 5.5% in 2023. This upturn can be attributed to a surge in infrastructure projects and increasing consumer demand for efficient transport solutions, particularly as Kenya aims to enhance its logistics capabilities. Although growth is projected to stabilize with modest increases of 0.1% in 2024 and 0.4% in 2025, the market is anticipated to gradually gain momentum again, reaching 1.9% by 2028. Factors such as digitalization and advancements in technology are propelling investments in modern industrial vehicles, aligning with the country's energy transition goals and further enhancing operational efficiency in various sectors.
Kenya industrial vehicles Market Year-wise Growth Rate and Key Drivers
This graph highlights how the Kenya industrial vehicles Market has steadily grown over the past five years, supported by major growth factors.
The table below presents the year wise growth rates along with the key drivers influencing the market
| Year | Growth Rate | Major Drivers |
| 2021 | -3.2% | Supply chain disruptions due to the pandemic hindered vehicle production, leading to decreased availability and sales. |
| 2022 | 5.2% | Local manufacturers increasingly focused on producing durable industrial vehicles for domestic needs. |
| 2023 | 5.5% | Investment in mining and agriculture sectors created higher demand for specialized vehicles. |
| 2024 | 0.1% | E-commerce growth necessitated logistics improvements, boosting industrial vehicle procurement significantly. |
| 2025 | 0.4% | Emerging technology adoption in fleet management enhanced operational efficiency across industries. |
| 2026 | 1.1% | International partnerships facilitated knowledge transfer and enhanced local vehicle production capabilities. |
| 2027 | 1.0% | Sustainability initiatives prompted companies to explore eco-friendly vehicle alternatives in operations. |
| 2028 | 1.9% | Robust commercial construction pipelines required reliable industrial vehicles for material transportation. |
| 2029 | 2.5% | Increasing urban mobility challenges led to demands for versatile industrial transport solutions. |
| 2030 | 1.8% | Financial institutions began offering tailored financing options for businesses acquiring industrial vehicles. |
| 2031 | 1.2% | Rural development programs highlighted the need for adaptable vehicles in remote areas. |
| 2032 | 1.4% | Market players anticipated a shift toward automation and electrification in vehicle fleets. |
Note - Market size estimations and growth projections presented in this report are based on 6Wresearch's advanced forecasting approach, validated with industry datasets as of June 2026.
Kenya industrial vehicles Market Synopsis
The Kenya industrial vehicles Market is projected to reach 1.1% and witness significant growth during the forecast period (2026-2032). This expansion is largely driven by the increasing demand from pivotal sectors such as logistics, construction, and manufacturing. Industrial vehicles, which encompass essential equipment like forklifts, pallet trucks, and utility vehicles, are critical for efficient material handling and transportation within various industrial settings.
Kenya industrial vehicles Market Growth Drivers
Several factors are contributing to the robust growth of the Kenya industrial vehicles market. Notably, the expansion of logistics, construction, and mining sectors is playing a vital role in driving demand. The surge in industrial activities has led to an increased need for advanced material handling solutions, making industrial vehicles indispensable in operations. Furthermore, the ongoing urbanization and rapid development of infrastructure projects across Kenya are amplifying the requirement for reliable industrial vehicles.
- Growth in e-commerce logistics is prompting companies to invest in more efficient material handling equipment to meet consumer demand.
- The construction sector is experiencing a boom, which necessitates the use of specialized vehicles for earthmoving and transportation tasks.
- Ongoing government initiatives to improve infrastructure are encouraging investments in industrial vehicle fleets.
- Technological advancements in industrial vehicles enhance their performance and adaptability for diverse applications.
- The rising emphasis on operational efficiency within manufacturing sectors makes reliable industrial vehicles a priority for businesses.
Kenya industrial vehicles Market Challenges and Restraints
Despite the promising growth prospects, the Kenya industrial vehicles market faces several challenges. Vehicle durability, reliability, and adaptability to various industrial contexts are paramount concerns for operators and manufacturers alike. In addition, maintaining optimal vehicle performance tailored to specific applications can be complex and resource-intensive. Market participants must also navigate issues related to vehicle maintenance and repair, which can significantly impact operational efficiency and costs.
- Ensuring the longevity of industrial vehicles in harsh working environments remains a critical challenge.
- Managing operating costs associated with maintenance and repair can strain company resources.
- There is an escalating demand for vehicles that can perform efficiently across different tasks in industrial settings.
- Compliance with government regulations on emissions and vehicle specifications can increase operational complexity.
- The need for continuous training on new technologies and vehicle systems can impose additional costs on businesses.
Kenya industrial vehicles Market Government Investment and Initiatives
The growth trajectory of the Kenya industrial vehicles market is significantly influenced by proactive government policies and investments aimed at enhancing infrastructure and industrial capabilities. The government is actively investing in transportation infrastructure improvements, which fosters a conducive environment for industrial activities. Additionally, policies focused on fleet modernization and environmental sustainability are shaping market dynamics by encouraging the adoption of more eco-friendly industrial vehicles.
- Initiatives aimed at upgrading road networks facilitate smoother logistics operations across the country.
- Government spending on infrastructure projects is likely to sustain demand for earthmoving and construction vehicles.
- Regulatory frameworks regarding vehicle emissions are encouraging manufacturers to innovate and meet modern environmental standards.
- Subsidies and incentives for adopting green technologies are likely to impact fleet compositions positively.
- Collaboration between public and private sectors in infrastructure planning reflects a strategic approach to meet future industrial needs.
Kenya industrial vehicles Market Latest Developments (May 2025 - June 2026)
The period between May 2025 and June 2026 has seen notable developments within the Kenya industrial vehicles market. There has been a marked increase in investments directed towards enhancing logistics capabilities and expanding the fleet of industrial vehicles tailored for construction and warehousing applications. Furthermore, the government's ongoing infrastructure projects are being closely monitored and supported, reflecting a commitment to improving the operational landscape for industrial vehicle users. Industry stakeholders have been increasingly focusing on adopting advanced technologies to boost vehicle performance and reliability, ensuring that they meet the demands of evolving market expectations.
Kenya industrial vehicles Market - Key Attractiveness of the Report
- 10 Years of Market Numbers
- Historical Data Starting from 2022 to 2025
- Base Year: 2025
- Forecast Data until 2032
- Key Performance Indicators Impacting the Market
- Major Upcoming Developments and Projects
Key Highlights of the Report:
- Kenya industrial vehicles Market Outlook
- Market Size of Kenya industrial vehicles Market, 2025
- Forecast of Kenya industrial vehicles Market, 2032
- Historical Data and Forecast of Kenya industrial vehicles Revenues & Volume for the Period 2022-2032F
- Kenya industrial vehicles Market Trend Evolution
- Kenya industrial vehicles Market Drivers and Challenges
- Kenya industrial vehicles Price Trends
- Kenya industrial vehicles Porter's Five Forces
- Kenya industrial vehicles Industry Life Cycle
- Historical Data and Forecast of Kenya industrial vehicles Market Revenues & Volume By Product Type for the Period 2022-2032F
- Historical Data and Forecast of Kenya industrial vehicles Market Revenues & Volume By Forklift for the Period 2022-2032F
- Historical Data and Forecast of Kenya industrial vehicles Market Revenues & Volume By Aisle Truck for the Period 2022-2032F
- Historical Data and Forecast of Kenya industrial vehicles Market Revenues & Volume By Tow Tractor for the Period 2022-2032F
- Historical Data and Forecast of Kenya industrial vehicles Market Revenues & Volume By Container Handler for the Period 2022-2032F
- Historical Data and Forecast of Kenya industrial vehicles Market Revenues & Volume By Drive Type for the Period 2022-2032F
- Historical Data and Forecast of Kenya industrial vehicles Market Revenues & Volume By Internal Combustion Engine for the Period 2022-2032F
- Historical Data and Forecast of Kenya industrial vehicles Market Revenues & Volume By Battery-Operated for the Period 2022-2032F
- Historical Data and Forecast of Kenya industrial vehicles Market Revenues & Volume By Gas-Powered for the Period 2022-2032F
- Historical Data and Forecast of Kenya industrial vehicles Market Revenues & Volume By Application for the Period 2022-2032F
- Historical Data and Forecast of Kenya industrial vehicles Market Revenues & Volume By Industrial for the Period 2022-2032F
- Historical Data and Forecast of Kenya industrial vehicles Market Revenues & Volume By Cargo for the Period 2022-2032F
- Kenya industrial vehicles Import Export Trade Statistics
- Market Opportunity Assessment By Product Type
- Market Opportunity Assessment By Drive Type
- Market Opportunity Assessment By Application
- Kenya industrial vehicles Top Companies Market Share
- Kenya industrial vehicles Competitive Benchmarking By Technical and Operational Parameters
- Kenya industrial vehicles Company Profiles
- Kenya industrial vehicles Key Strategic Recommendations
Frequently Asked Questions About the Market Study (FAQs):
The logistics, construction, and manufacturing sectors are the primary drivers of growth, as they increasingly rely on industrial vehicles for material handling and transportation.
Government initiatives, including infrastructure investments and policies promoting fleet modernization, are significantly shaping market dynamics and encouraging the adoption of innovative industrial vehicles.
Manufacturers must address concerns related to vehicle durability, maintenance, and adaptability to various industrial applications, which can complicate operational efficiency.
Recent trends include increased investment in logistics capabilities and the adoption of advanced technologies to enhance vehicle performance and meet rising market demands.
6Wresearch actively monitors the Kenya industrial vehicles Market and publishes its comprehensive annual report, highlighting emerging trends, growth drivers, revenue analysis, and forecast outlook. Our insights help businesses to make data-backed strategic decisions with ongoing market dynamics. Our analysts track relevent industries related to the Kenya industrial vehicles Market, allowing our clients with actionable intelligence and reliable forecasts tailored to emerging regional needs.
Yes, we provide customisation as per your requirements. To learn more, feel free to contact us on sales@6wresearch.com
1 Executive Summary |
2 Introduction |
2.1 Key Highlights of the Report |
2.2 Report Description |
2.3 Market Scope & Segmentation |
2.4 Research Methodology |
2.5 Assumptions |
3 Kenya industrial vehicles Market Overview |
3.1 Kenya Country Macro Economic Indicators |
3.2 Kenya industrial vehicles Market Revenues & Volume, 2022 & 2032F |
3.3 Kenya industrial vehicles Market - Industry Life Cycle |
3.4 Kenya industrial vehicles Market - Porter's Five Forces |
3.5 Kenya industrial vehicles Market Revenues & Volume Share, By Product Type, 2022 & 2032F |
3.6 Kenya industrial vehicles Market Revenues & Volume Share, By Drive Type, 2022 & 2032F |
3.7 Kenya industrial vehicles Market Revenues & Volume Share, By Application, 2022 & 2032F |
4 Kenya industrial vehicles Market Dynamics |
4.1 Impact Analysis |
4.2 Market Drivers |
4.2.1 Growth in industrial activities and infrastructure development in Kenya |
4.2.2 Increasing demand for efficient and advanced industrial vehicles |
4.2.3 Government initiatives and investments in industrial sectors |
4.3 Market Restraints |
4.3.1 High initial investment and maintenance costs for industrial vehicles |
4.3.2 Fluctuating fuel prices impacting operational costs |
4.3.3 Limited availability of skilled labor for operating and maintaining industrial vehicles |
5 Kenya industrial vehicles Market Trends |
6 Kenya industrial vehicles Market, By Types |
6.1 Kenya industrial vehicles Market, By Product Type |
6.1.1 Overview and Analysis |
6.1.2 Kenya industrial vehicles Market Revenues & Volume, By Product Type, 2022-2032F |
6.1.3 Kenya industrial vehicles Market Revenues & Volume, By Forklift, 2022-2032F |
6.1.4 Kenya industrial vehicles Market Revenues & Volume, By Aisle Truck, 2022-2032F |
6.1.5 Kenya industrial vehicles Market Revenues & Volume, By Tow Tractor, 2022-2032F |
6.1.6 Kenya industrial vehicles Market Revenues & Volume, By Container Handler, 2022-2032F |
6.2 Kenya industrial vehicles Market, By Drive Type |
6.2.1 Overview and Analysis |
6.2.2 Kenya industrial vehicles Market Revenues & Volume, By Internal Combustion Engine, 2022-2032F |
6.2.3 Kenya industrial vehicles Market Revenues & Volume, By Battery-Operated, 2022-2032F |
6.2.4 Kenya industrial vehicles Market Revenues & Volume, By Gas-Powered, 2022-2032F |
6.3 Kenya industrial vehicles Market, By Application |
6.3.1 Overview and Analysis |
6.3.2 Kenya industrial vehicles Market Revenues & Volume, By Industrial , 2022-2032F |
6.3.3 Kenya industrial vehicles Market Revenues & Volume, By Cargo, 2022-2032F |
7 Kenya industrial vehicles Market Import-Export Trade Statistics |
7.1 Kenya industrial vehicles Market Export to Major Countries |
7.2 Kenya industrial vehicles Market Imports from Major Countries |
8 Kenya industrial vehicles Market Key Performance Indicators |
8.1 Average age of industrial vehicle fleet in Kenya |
8.2 Adoption rate of telematics and IoT technology in industrial vehicles |
8.3 Number of industrial vehicle training programs and certifications offered in Kenya |
9 Kenya industrial vehicles Market - Opportunity Assessment |
9.1 Kenya industrial vehicles Market Opportunity Assessment, By Product Type, 2022 & 2032F |
9.2 Kenya industrial vehicles Market Opportunity Assessment, By Drive Type, 2022 & 2032F |
9.3 Kenya industrial vehicles Market Opportunity Assessment, By Application, 2022 & 2032F |
10 Kenya industrial vehicles Market - Competitive Landscape |
10.1 Kenya industrial vehicles Market Revenue Share, By Companies, 2025 |
10.2 Kenya industrial vehicles Market Competitive Benchmarking, By Operating and Technical Parameters |
11 Company Profiles |
12 Recommendations |
13 Disclaimer |
Global Go To Market Strategy - 2030
Export potential enables firms to identify high-growth global markets with greater confidence by combining advanced trade intelligence with a structured quantitative methodology. The framework analyzes emerging demand trends and country-level import patterns while integrating macroeconomic and trade datasets such as GDP and population forecasts, bilateral import–export flows, tariff structures, elasticity differentials between developed and developing economies, geographic distance, and import demand projections. Using weighted trade values from 2020–2024 as the base period to project country-to-country export potential for 2030, these inputs are operationalized through calculated drivers such as gravity model parameters, tariff impact factors, and projected GDP per-capita growth. Through an analysis of hidden potentials, demand hotspots, and market conditions that are most favorable to success, this method enables firms to focus on target countries, maximize returns, and global expansion with data, backed by accuracy.
By factoring in the projected importer demand gap that is currently unmet and could be potential opportunity, it identifies the potential for the Exporter (Country) among 190 countries, against the general trade analysis, which identifies the biggest importer or exporter.
To discover high-growth global markets and optimize your business strategy:
Click Here
Pricing
- Single User License$ 1,995
- Department License$ 2,400
- Site License$ 3,120
- Global License$ 3,795

Leadership Perspectives from Industry Events
Search
Thought Leadership and Analyst Meet


Our Clients
6WResearch In News
- India Air Conditioner Market Set for Strong Rebound in 2026 After Weather-Led Correction and GST-Driven Recovery: 6Wresearch
- ADAS in India: How Automatic Emergency Braking, Blind Spot Detection & Driver Monitoring are Transforming Road Safety
- Doha a strategic location for EV manufacturing hub: IPA Qatar
- Demand for luxury TVs surging in the GCC, says Samsung
- Empowering Growth: The Thriving Journey of Bangladesh’s Cable Industry
- Demand for luxury TVs surging in the GCC, says Samsung
Latest Reports
- Nicaragua RPG Gaming Market (2026-2032)
- New Zealand RPG Gaming Market (2026-2032)
- Netherlands RPG Gaming Market (2026-2032)
- Nauru RPG Gaming Market (2026-2032)
- Namibia RPG Gaming Market (2026-2032)
- Mozambique RPG Gaming Market (2026-2032)
- Montenegro RPG Gaming Market (2026-2032)
- Mongolia RPG Gaming Market (2026-2032)
- Monaco RPG Gaming Market (2026-2032)
- Micronesia RPG Gaming Market (2026-2032)
Industry Events and Analyst Meet

HIMTEX 2026

India Refining Summit 2026

India EV Show 2026

EV tech India Expo 2026

Auto Tech Asia 2026
Whitepaper
- Middle East & Africa Commercial Security Market Click here to view more.
- Middle East & Africa Fire Safety Systems & Equipment Market Click here to view more.
- GCC Drone Market Click here to view more.
- Middle East Lighting Fixture Market Click here to view more.
- GCC Physical & Perimeter Security Market Click here to view more.