Kenya Inorganic salts Market (2026-2032) Outlook | Share, Size, Industry, Analysis, Forecast, Revenue, Value, Companies, Trends & Growth
Market Forecast By Application (Chemicals, Food Industry, Pharmaceuticals and Personal Care, Agriculture, Others) And Competitive Landscape
| Product Code: ETC415066 | Publication Date: Oct 2022 | Updated Date: Jul 2026 | Product Type: Market Research Report | |
| Publisher: 6Wresearch | Author: Summon Dutta | No. of Pages: 75 | No. of Figures: 35 | No. of Tables: 20 |
Kenya Inorganic salts Market Size, Share & Growth Rate
The Kenya Inorganic salts Market was estimated at USD 1499 Million in 2025 and is projected to reach USD 2135 Million by 2032, growing at a CAGR of 5.2% from 2026 to 2032. This upward trajectory is primarily fueled by the expanding agricultural sector, which increasingly relies on inorganic salts for fertilization. In addition, the rising demand from the pharmaceutical and food processing industries further reinforces the markets growth potential.
Kenya Inorganic salts Market Growth Rate Analysis (2021-2032)
The Kenya inorganic salts market has exhibited a stable growth pattern, with annual growth rates ranging from 5.8% to 6.4% over the past several years. In 2023, the market reached a growth of 6.3%, driven by rising demand in agricultural applications and expanding industrial sectors. Investments in infrastructure and digitalization have bolstered the production capabilities, helping to maintain this upward trend. Growth dipped slightly to 5.8% in 2024 due to supply chain disruptions, yet it rebounded to 6.4% in 2025 as new policies supporting green technologies were enacted. Looking ahead, factors such as consumer demand for sustainable products and advancements in processing technologies will continue to shape this market positively.
Kenya Inorganic salts Market Year-wise Growth Rate and Key Drivers
This graph highlights how the Kenya Inorganic salts Market has steadily grown over the past five years, supported by major growth factors.
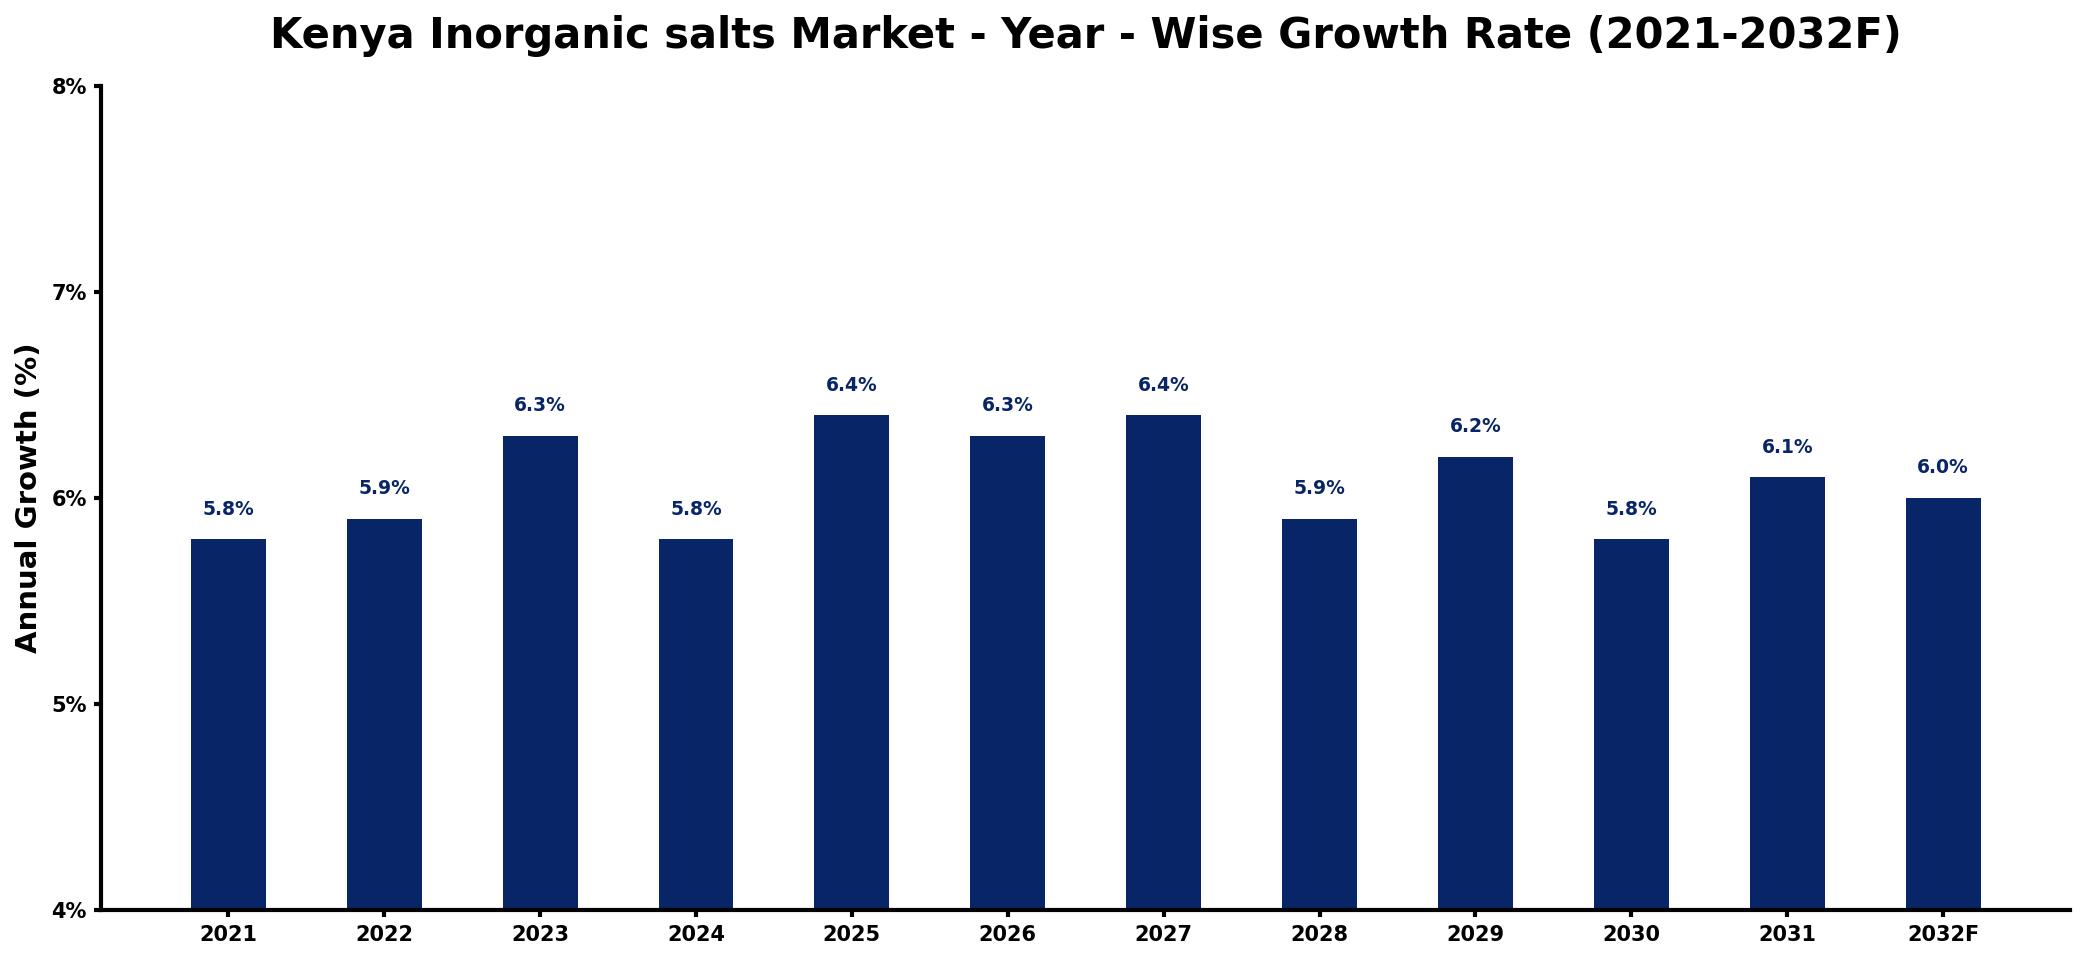
The table below presents the year‑wise growth rates along with the key drivers influencing the market
| Year | Growth Rate | Major Drivers |
| 2021 | 5.8% | Rising agricultural sector investments |
| 2022 | 5.9% | Increased demand from construction industry |
| 2023 | 6.3% | Growing pharmaceutical manufacturing needs |
| 2024 | 5.8% | Expansion of food processing sector |
| 2025 | 6.4% | Surge in water treatment applications |
| 2026 | 6.3% | Boost in chemical production facilities |
| 2027 | 6.4% | rising export shipment volumes |
| 2028 | 5.9% | Demand increase from textile industry |
| 2029 | 6.2% | Rising interest in renewable energy |
| 2030 | 5.8% | increased domestic production output |
| 2031 | 6.1% | expanding industrial usage applications |
| 2032 | 6.0% | Growth in automotive sector applications |
Note: Market size estimations and growth projections presented in this report are based on 6Wresearch's proprietary forecasting methodology, utilizing the latest available industry data, government publications, and primary research inputs.
Kenya Inorganic salts Market Synopsis
Recent momentum in the Kenya inorganic salts market reflects a surge in applications across multiple sectors, notably agriculture, pharmaceuticals, and food processing. As the market evolves, projections indicate a robust future driven by the need for innovative, high-quality products that align with sustainable practices.
Looking ahead, the market is well-positioned for steady expansion, bolstered by government initiatives aimed at enhancing agricultural productivity and food security. This positive outlook presents opportunities for both new entrants and established players seeking to capitalize on the growing demand for inorganic salts.
Kenya Inorganic salts Market Key Takeaways
- The market is projected to grow from USD 1499 Million in 2025 to USD 2135 Million by 2032, driven by expanding agricultural needs.
- Innovations in product quality and sustainable practices are key focus areas for market participants.
- Government policies are enhancing market growth through support for food security and agricultural productivity.
- Emerging applications in pharmaceuticals and niche sectors present additional opportunities for growth.
- Consumer preferences are shifting towards environmentally friendly inorganic salts, influencing market dynamics.
Evaluation of Restraints in Kenya Inorganic salts Market
Despite its growth prospects, the Kenya inorganic salts market faces significant challenges. Fluctuating prices of raw materials, particularly for imported salts, can adversely affect production costs and overall market pricing strategies. Additionally, competition from low-cost imports poses a threat to local manufacturers, potentially undermining profitability. Quality control remains a crucial factor, as maintaining high standards is essential for customer retention and brand loyalty. Moreover, limited consumer awareness regarding the benefits and applications of inorganic salts may impede broader market acceptance.
Kenya Inorganic salts Market Trends
Several notable trends are shaping the Kenya inorganic salts market. There is an increasing demand for various salts, including sodium chloride, calcium chloride, and potassium chloride, driven by their diverse applications in agriculture and food processing. Furthermore, the adoption of sustainable and eco-friendly production practices is gaining traction, aligning with rising consumer preferences for environmentally friendly products. Additionally, the market is witnessing a growing interest in specialty inorganic salts, tailored for niche applications in pharmaceuticals and electronics.
Kenya Inorganic salts Market Opportunities
The Kenya inorganic salts market holds promising investment opportunities, particularly as the countrys industrial and agricultural sectors expand. The continuous demand for high-quality inorganic salts in various applications, coupled with urbanization and population growth, positions investors to tap into this lucrative market. Moreover, the focus on sustainable agricultural practices offers further avenues for growth, as inorganic salts can play a pivotal role in enhancing soil health and productivity.
Government Initiatives in the Kenya Inorganic salts Market
The Kenyan government plays a crucial role in regulating the inorganic salts market through various policies that promote safety, quality, and environmental sustainability. The Kenya Bureau of Standards (KEBS) establishes stringent guidelines to safeguard consumer health while supporting fair trade. Moreover, the Ministry of Environment and Forestry enforces regulations governing the disposal of inorganic salts to minimize ecological impact. Import and export activities are monitored by the Kenya Revenue Authority (KRA) to ensure compliance with national standards, thereby fostering a competitive market landscape.
Future Insights of the Kenya Inorganic salts Market
The future outlook for the Kenya inorganic salts market is promising, with steady growth projected through 2032. Factors contributing to this trajectory include rising industrial activity, particularly within the agricultural sector, where inorganic salts are essential for fertilizer production. Additionally, the expanding food and pharmaceutical industries are expected to further drive demand. Government initiatives focused on infrastructure development and environmental sustainability will likely bolster consumption in sectors such as water treatment and construction, enhancing the overall market landscape.
Kenya Inorganic salts Market Latest Developments (2025 - 2026)
In recent months, the Kenya inorganic salts market has witnessed a series of developments aimed at enhancing product quality and sustainability. Several industry stakeholders are investing in advanced production technologies to meet the evolving demands of environmentally conscious consumers. Additionally, collaborative efforts between local manufacturers and research institutions have emerged, focusing on the development of specialty inorganic salts tailored to specific industrial applications. As the market continues to evolve, these initiatives signal a commitment to innovation and responsiveness to market needs.
Kenya Inorganic salts Market - Key Attractiveness of the Report
- 10 Years of Market Numbers
- Historical Data Starting from 2022 to 2025
- Base Year: 2025
- Forecast Data until 2032
- Key Performance Indicators Impacting the Market
- Major Upcoming Developments and Projects
Key Highlights of the Report:
- Kenya Inorganic salts Market Outlook
- Market Size of Kenya Inorganic salts Market, 2025
- Forecast of Kenya Inorganic salts Market, 2032
- Historical Data and Forecast of Kenya Inorganic salts Revenues & Volume for the Period 2022-2032F
- Kenya Inorganic salts Market Trend Evolution
- Kenya Inorganic salts Market Drivers and Challenges
- Kenya Inorganic salts Price Trends
- Kenya Inorganic salts Porter's Five Forces
- Kenya Inorganic salts Industry Life Cycle
- Historical Data and Forecast of Kenya Inorganic salts Market Revenues & Volume By Application for the Period 2022-2032F
- Historical Data and Forecast of Kenya Inorganic salts Market Revenues & Volume By Chemicals for the Period 2022-2032F
- Historical Data and Forecast of Kenya Inorganic salts Market Revenues & Volume By Food Industry for the Period 2022-2032F
- Historical Data and Forecast of Kenya Inorganic salts Market Revenues & Volume By Pharmaceuticals and Personal Care for the Period 2022-2032F
- Historical Data and Forecast of Kenya Inorganic salts Market Revenues & Volume By Agriculture for the Period 2022-2032F
- Historical Data and Forecast of Kenya Inorganic salts Market Revenues & Volume By Others for the Period 2022-2032F
- Kenya Inorganic salts Import Export Trade Statistics
- Market Opportunity Assessment By Application
- Kenya Inorganic salts Top Companies Market Share
- Kenya Inorganic salts Competitive Benchmarking By Technical and Operational Parameters
- Kenya Inorganic salts Company Profiles
- Kenya Inorganic salts Key Strategic Recommendations
Frequently Asked Questions About the Market Study (FAQs):
Growth is predominantly driven by increased agricultural demands, rising disposable incomes, and an expanding food processing sector.
The Kenya Inorganic salts Market was estimated at USD 1499 Million in 2025 and is projected to reach USD 2135 Million by 2032, growing at a CAGR of 5.2% from 2026 to 2032.
Government policies focus on ensuring product quality and safety while fostering agricultural productivity and environmental sustainability through regulatory standards.
Manufacturers are increasingly adopting eco-friendly production methods and innovating their product lines to align with growing consumer demand for environmentally responsible products.
Inorganic salts are widely used in agriculture as fertilizers, in pharmaceuticals for formulations, and in food processing as additives, collectively driving market demand.
6Wresearch actively monitors the Kenya Inorganic salts Market and publishes its comprehensive annual report, highlighting emerging trends, growth drivers, revenue analysis, and forecast outlook. Our insights help businesses to make data-backed strategic decisions with ongoing market dynamics. Our analysts track relevent industries related to the Kenya Inorganic salts Market, allowing our clients with actionable intelligence and reliable forecasts tailored to emerging regional needs.
Yes, we provide customisation as per your requirements. To learn more, feel free to contact us on sales@6wresearch.com
1 Executive Summary |
2 Introduction |
2.1 Key Highlights of the Report |
2.2 Report Description |
2.3 Market Scope & Segmentation |
2.4 Research Methodology |
2.5 Assumptions |
3 Kenya Inorganic salts Market Overview |
3.1 Kenya Country Macro Economic Indicators |
3.2 Kenya Inorganic salts Market Revenues & Volume, 2022 & 2032F |
3.3 Kenya Inorganic salts Market - Industry Life Cycle |
3.4 Kenya Inorganic salts Market - Porter's Five Forces |
3.5 Kenya Inorganic salts Market Revenues & Volume Share, By Application, 2022 & 2032F |
4 Kenya Inorganic salts Market Dynamics |
4.1 Impact Analysis |
4.2 Market Drivers |
4.2.1 Growing demand from various industries such as agriculture, pharmaceuticals, and food processing |
4.2.2 Increasing population leading to higher consumption of inorganic salts for various applications |
4.2.3 Technological advancements and innovations in the production processes improving efficiency and quality |
4.3 Market Restraints |
4.3.1 Volatility in raw material prices impacting the cost of production |
4.3.2 Environmental concerns and regulations related to the use and disposal of inorganic salts |
4.3.3 Competition from alternative products or substitutes in the market |
5 Kenya Inorganic salts Market Trends |
6 Kenya Inorganic salts Market, By Types |
6.1 Kenya Inorganic salts Market, By Application |
6.1.1 Overview and Analysis |
6.1.2 Kenya Inorganic salts Market Revenues & Volume, By Application, 2022-2032F |
6.1.3 Kenya Inorganic salts Market Revenues & Volume, By Chemicals, 2022-2032F |
6.1.4 Kenya Inorganic salts Market Revenues & Volume, By Food Industry, 2022-2032F |
6.1.5 Kenya Inorganic salts Market Revenues & Volume, By Pharmaceuticals and Personal Care, 2022-2032F |
6.1.6 Kenya Inorganic salts Market Revenues & Volume, By Agriculture, 2022-2032F |
6.1.7 Kenya Inorganic salts Market Revenues & Volume, By Others, 2022-2032F |
7 Kenya Inorganic salts Market Import-Export Trade Statistics |
7.1 Kenya Inorganic salts Market Export to Major Countries |
7.2 Kenya Inorganic salts Market Imports from Major Countries |
8 Kenya Inorganic salts Market Key Performance Indicators |
8.1 Average selling price of inorganic salts in Kenya |
8.2 Number of new product launches or innovations in the inorganic salts market |
8.3 Export/import volume of inorganic salts in Kenya |
8.4 Adoption rate of inorganic salts in key industries in Kenya |
8.5 Investment in research and development for inorganic salts in Kenya |
9 Kenya Inorganic salts Market - Opportunity Assessment |
9.1 Kenya Inorganic salts Market Opportunity Assessment, By Application, 2022 & 2032F |
10 Kenya Inorganic salts Market - Competitive Landscape |
10.1 Kenya Inorganic salts Market Revenue Share, By Companies, 2025 |
10.2 Kenya Inorganic salts Market Competitive Benchmarking, By Operating and Technical Parameters |
11 Company Profiles |
12 Recommendations |
13 Disclaimer |
Global Go To Market Strategy - 2030
Export potential enables firms to identify high-growth global markets with greater confidence by combining advanced trade intelligence with a structured quantitative methodology. The framework analyzes emerging demand trends and country-level import patterns while integrating macroeconomic and trade datasets such as GDP and population forecasts, bilateral import–export flows, tariff structures, elasticity differentials between developed and developing economies, geographic distance, and import demand projections. Using weighted trade values from 2020–2024 as the base period to project country-to-country export potential for 2030, these inputs are operationalized through calculated drivers such as gravity model parameters, tariff impact factors, and projected GDP per-capita growth. Through an analysis of hidden potentials, demand hotspots, and market conditions that are most favorable to success, this method enables firms to focus on target countries, maximize returns, and global expansion with data, backed by accuracy.
By factoring in the projected importer demand gap that is currently unmet and could be potential opportunity, it identifies the potential for the Exporter (Country) among 190 countries, against the general trade analysis, which identifies the biggest importer or exporter.
To discover high-growth global markets and optimize your business strategy:
Click Here
Pricing
- Single User License$ 1,995
- Department License$ 2,400
- Site License$ 3,120
- Global License$ 3,795

Leadership Perspectives from Industry Events
Search
Thought Leadership and Analyst Meet


Our Clients
6WResearch In News
- India Air Conditioner Market Set for Strong Rebound in 2026 After Weather-Led Correction and GST-Driven Recovery: 6Wresearch
- ADAS in India: How Automatic Emergency Braking, Blind Spot Detection & Driver Monitoring are Transforming Road Safety
- Doha a strategic location for EV manufacturing hub: IPA Qatar
- Demand for luxury TVs surging in the GCC, says Samsung
- Empowering Growth: The Thriving Journey of Bangladesh’s Cable Industry
- Demand for luxury TVs surging in the GCC, says Samsung
Latest Reports
- Nicaragua RPG Gaming Market (2026-2032)
- New Zealand RPG Gaming Market (2026-2032)
- Netherlands RPG Gaming Market (2026-2032)
- Nauru RPG Gaming Market (2026-2032)
- Namibia RPG Gaming Market (2026-2032)
- Mozambique RPG Gaming Market (2026-2032)
- Montenegro RPG Gaming Market (2026-2032)
- Mongolia RPG Gaming Market (2026-2032)
- Monaco RPG Gaming Market (2026-2032)
- Micronesia RPG Gaming Market (2026-2032)
Industry Events and Analyst Meet

HIMTEX 2026

India Refining Summit 2026

India EV Show 2026

EV tech India Expo 2026

Auto Tech Asia 2026
Whitepaper
- Middle East & Africa Commercial Security Market Click here to view more.
- Middle East & Africa Fire Safety Systems & Equipment Market Click here to view more.
- GCC Drone Market Click here to view more.
- Middle East Lighting Fixture Market Click here to view more.
- GCC Physical & Perimeter Security Market Click here to view more.