Kenya Iron oxide pigments Market (2026-2032) Outlook | Forecast, Value, Companies, Growth, Share, Analysis, Revenue, Trends, Industry & Size
Market Forecast By Product (Synthetic, Natural), By Color (Red, Yellow, Black, Blends), By Applications (Construction, Coatings, Plastics, Paper, Others) And Competitive Landscape
| Product Code: ETC089229 | Publication Date: Jun 2021 | Updated Date: Jun 2026 | Product Type: Report | |
| Publisher: 6Wresearch | Author: Sumit Sagar | No. of Pages: 70 | No. of Figures: 35 | No. of Tables: 5 |
Kenya Iron oxide pigments Market Size, Share & Growth Rate
The Kenya Iron oxide pigments Market was estimated at USD 1207 Million in 2025 and is projected to reach USD 1742 Million by 2032, growing at a CAGR of 5.4% from 2026 to 2032. This growth trajectory is primarily fueled by the robust expansion of the construction sector and significant investments in infrastructure development throughout the country. As urbanization accelerates, the demand for durable and high-quality pigments in paints, coatings, and construction materials is expected to rise significantly, further cementing the market’s upward path.
Kenya Iron oxide pigments Market Growth Rate Analysis (2021-2032)
The Kenya iron oxide pigments market has displayed stable growth, with an increase of 6.3% in 2021, slightly tapering to 6.1% in 2022 and further to 6.0% in 2023. This recent deceleration can be attributed to fluctuations in consumer demand and supply chain disruptions. However, the market is poised for a rebound, forecasted to grow by 6.6% in 2024 and maintaining similar momentum through 2026. Investment in infrastructure projects and a shift towards sustainable construction practices are driving this resurgence. By 2030, continued demand for high-quality pigments in various industries, paired with advancements in production technology, is expected to sustain growth rates around 6.2% to 6.6%.
Kenya Iron oxide pigments Market Year-wise Growth Rate and Key Drivers
This graph highlights how the Kenya Iron oxide pigments Market has steadily grown over the past five years, supported by major growth factors.
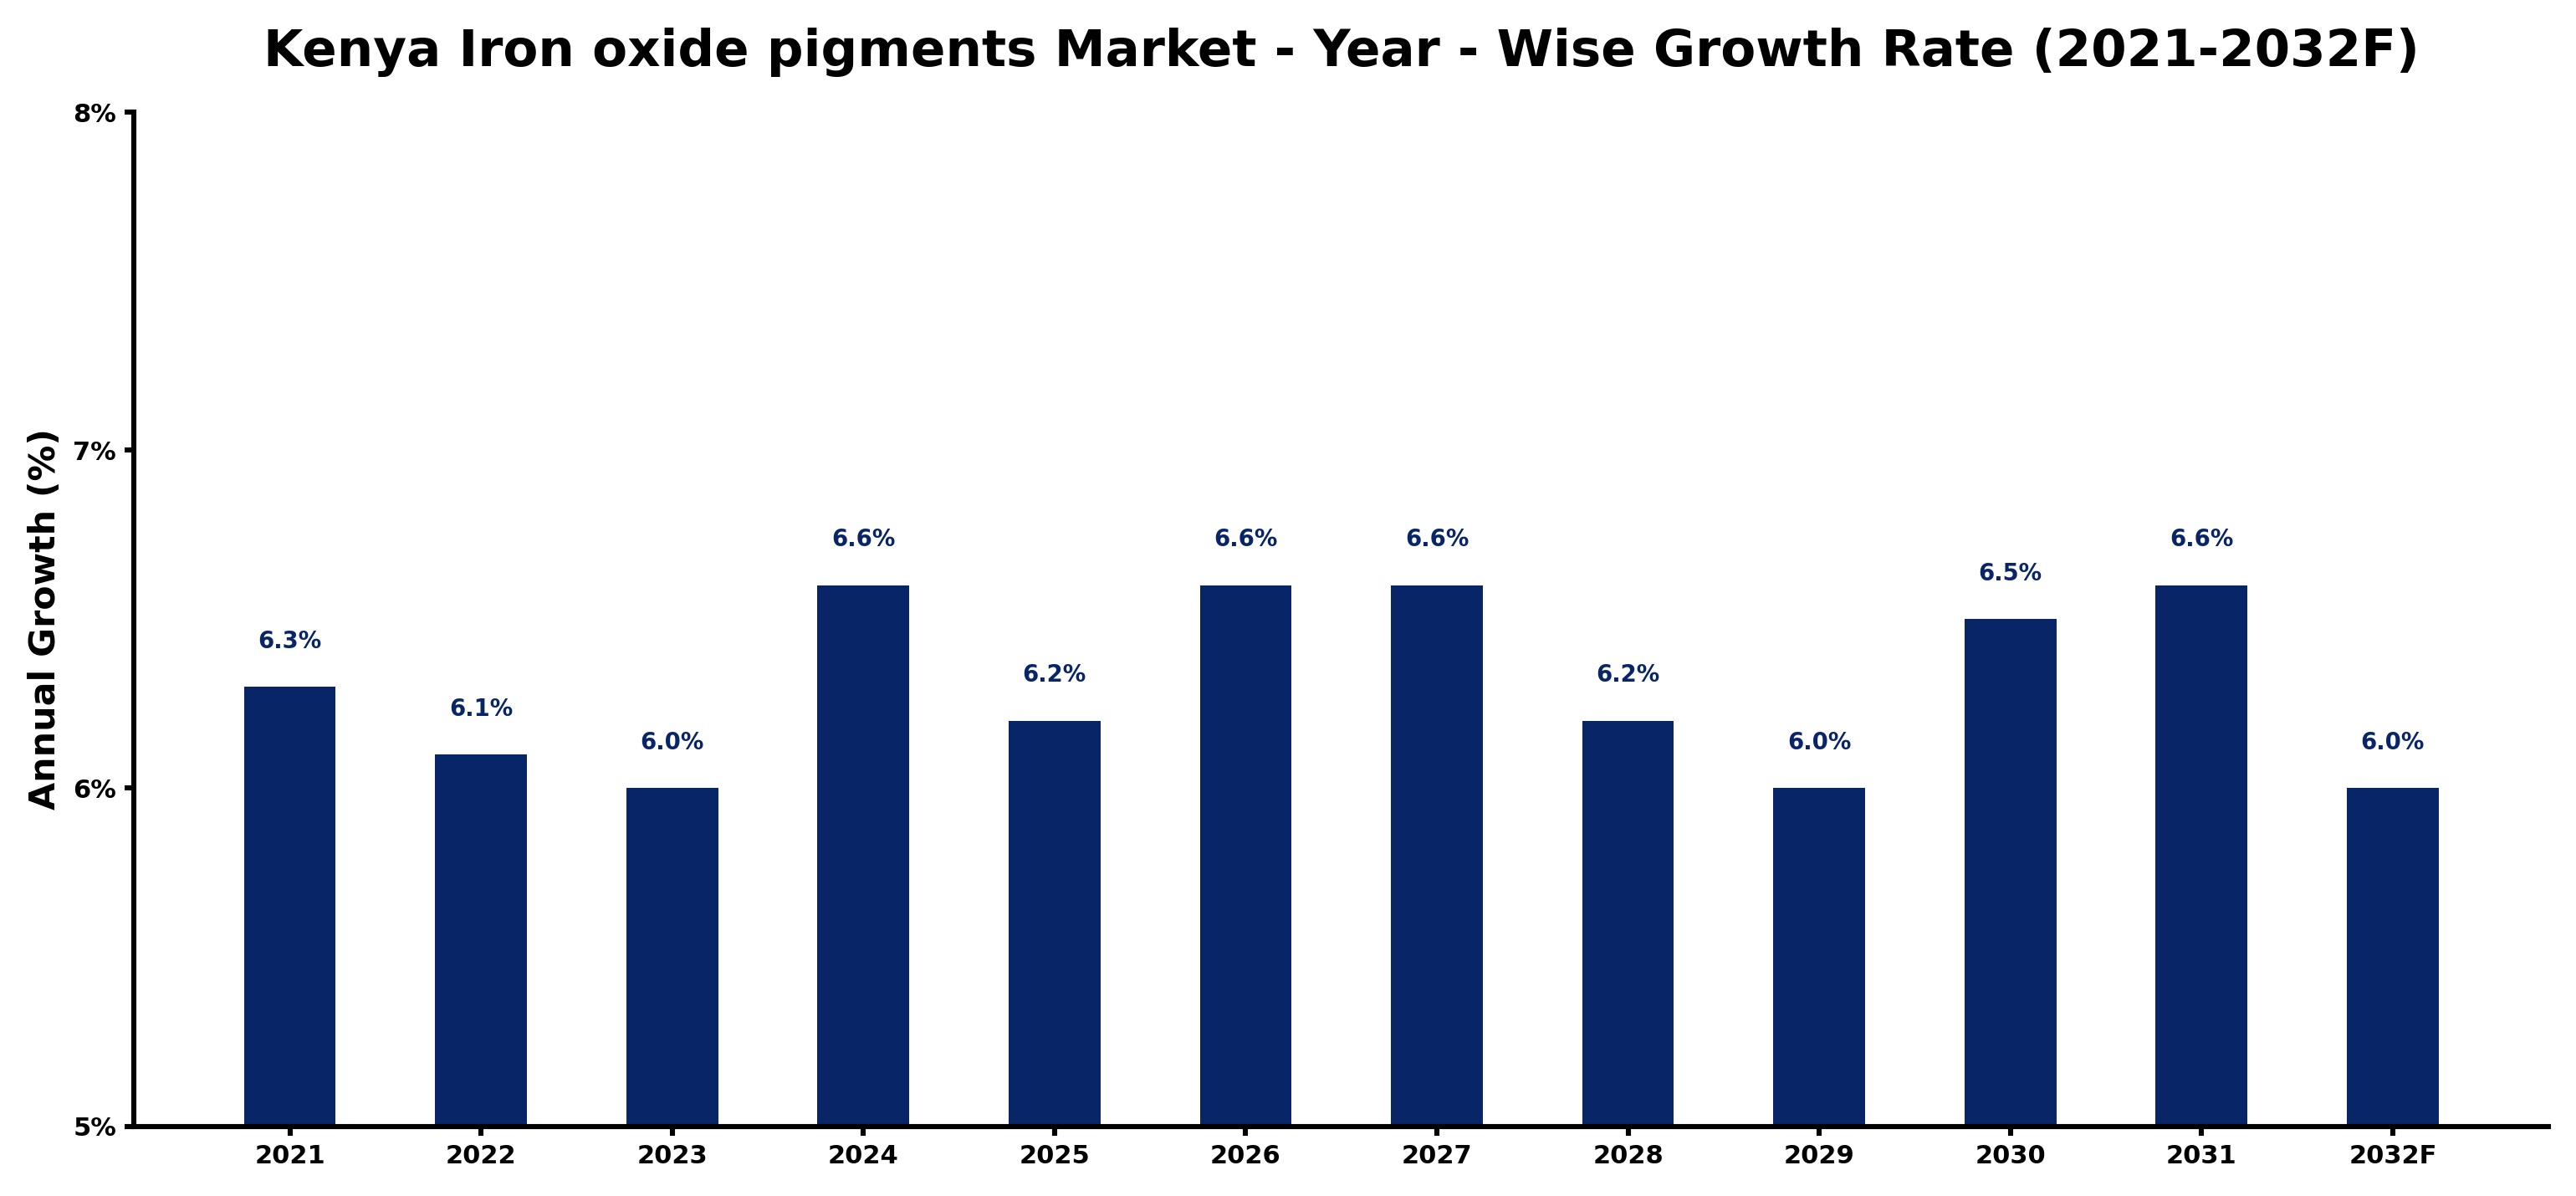
The table below presents the year‑wise growth rates along with the key drivers influencing the market
| Year | Growth Rate | Major Drivers |
| 2021 | 6.3% | Improved construction activity boosted demand for iron oxide pigments |
| 2022 | 6.1% | Improved mining technologies boosted iron oxide pigment extraction efficiency |
| 2023 | 6.0% | Strengthened pigment production processes boosted domestic construction material quality |
| 2024 | 6.6% | Improved processing technologies boosted iron oxide pigment production efficiency |
| 2025 | 6.2% | Export driven demand spurred local iron oxide pigment production investments |
| 2026 | 6.6% | Domestic manufacturers ramped up iron oxide pigment production capacity |
| 2027 | 6.6% | Innovative pigment formulations improved local construction material manufacturing quality |
| 2028 | 6.2% | Domestic mining operations expanded iron oxide pigment production capacity |
| 2029 | 6.0% | Infrastructure projects boost domestic demand for iron oxide pigments |
| 2030 | 6.5% | Higher demand for eco friendly pigments boosts local manufacturing efficiency |
| 2031 | 6.6% | Local paint manufacturers boost demand for iron oxide pigments |
| 2032 | 6.0% | Improved processing techniques enhanced iron oxide pigment quality standards |
Note - Market size estimations and growth projections presented in this report are based on 6Wresearch’s advanced forecasting approach, validated with industry datasets as of June 2026.
Kenya Iron oxide pigments Market Synopsis
In Kenya, the application of iron oxide pigments in paints and coatings remains a strong driver for market growth. Local manufacturers are increasingly recognizing the advantages of these pigments, such as their color consistency and UV resistance, which make them ideal for both internal and external applications. This awareness, however, must grow to fully harness the potential of iron oxide pigments across various sectors.
The rising construction activities and urbanization in Kenya are contributing to a surge in demand for high-quality pigments. With many infrastructure projects underway, the need for reliable and environmentally friendly color solutions in building materials is paramount. This sets the stage for a vibrant market fueled by innovation and sustainable practices.
Kenya Iron oxide pigments Market Key Takeaways
- The market is propelled by extensive construction and infrastructural investments.
- Sustainable and eco-friendly applications are increasingly gaining traction.
- Manufacturers are focusing on R&D to enhance product properties and meet evolving consumer demands.
- Local production is supported by government policies promoting environmental sustainability.
- Opportunities exist for investment in manufacturing and distribution channels.
Evaluation of Restraints in Kenya Iron oxide pigments Market
While the Kenya iron oxide pigments market shows promising growth, it is not without its challenges. Strong competition from imported pigments creates pricing pressures that local manufacturers must navigate. Fluctuating raw material prices pose additional risks, impacting production costs and profitability. Furthermore, logistical constraints related to distribution and supply chain management may hinder the efficient delivery of products to end-users. Finally, regulatory hurdles regarding quality standards and environmental compliance may add complexity to operations for both manufacturers and importers.
Kenya Iron oxide pigments Market Trends
A notable trend in the Kenya iron oxide pigments market is the increasing shift towards sustainability. Construction practices that prioritize eco-friendliness are driving demand for pigments known for their durability and minimal environmental impact. The automotive industry's growing influence also plays a role, as demand for high-performance pigments in automotive coatings rises. Furthermore, manufacturers are embracing innovative technologies, enabling the development of pigments with enhanced properties, colors, and applications.
Kenya Iron oxide pigments Market Opportunities
The market presents substantial investment opportunities, particularly for stakeholders looking to engage in the burgeoning construction and infrastructure sectors. The rising urbanization trend indicates a consistent demand for iron oxide pigments in various applications including paints, coatings, and plastics. Additionally, opportunities for exporting to neighboring East African regions can enhance market reach and profitability for investors in the sector.
Government Initiatives in the Kenya Iron oxide pigments Market
The Kenyan government is actively promoting policies that encourage sustainable practices within the iron oxide pigments market. Environmental regulations aimed at minimizing pollution are integral to these initiatives, ensuring that manufacturers adhere to standards that protect natural resources. Quality standards are also enforced, ensuring product safety and consistency. Such frameworks not only foster a competitive market landscape but also support domestic manufacturers in their growth endeavors.
Future Insights of the Kenya Iron oxide pigments Market
Looking ahead to the period from 2026 to 2032, the Kenya iron oxide pigments market is well-positioned for sustained growth. The increasing focus on infrastructure development combined with heightened awareness of the benefits of eco-friendly pigments suggests a favorable outlook. Moreover, the expansion of the automotive sector and continuous innovation in pigment technologies are likely to contribute positively to market dynamics. However, market participants must remain vigilant regarding the fluctuating prices of raw materials and the presence of substitute products, as these factors could influence growth trajectories.
Kenya Iron oxide pigments Market Latest Developments (May 2025 - June 2026)
In recent months, the Kenya iron oxide pigments market has seen several noteworthy developments, with increasing focus on local production capabilities and sustainability initiatives. Industry participants are ramping up efforts in research and development to introduce innovative products that meet the evolving demands of various sectors. Additionally, collaborative efforts are emerging between local manufacturers and international companies aimed at enhancing supply chain efficiency and expanding market reach.
Kenya Iron oxide pigments Market - Key Attractiveness of the Report
- 10 Years of Market Numbers
- Historical Data Starting from 2022 to 2025
- Base Year: 2025
- Forecast Data until 2032
- Key Performance Indicators Impacting the Market
- Major Upcoming Developments and Projects
Key Highlights of the Report:
- Kenya Iron oxide pigments Market Outlook
- Market Size of Kenya Iron oxide pigments Market, 2025
- Forecast of Kenya Iron oxide pigments Market, 2032
- Historical Data and Forecast of Kenya Iron oxide pigments Revenues & Volume for the Period 2022-2032F
- Kenya Iron oxide pigments Market Trend Evolution
- Kenya Iron oxide pigments Market Drivers and Challenges
- Kenya Iron oxide pigments Price Trends
- Kenya Iron oxide pigments Porter's Five Forces
- Kenya Iron oxide pigments Industry Life Cycle
- Historical Data and Forecast of Kenya Iron oxide pigments Market Revenues & Volume By Product for the Period 2022-2032F
- Historical Data and Forecast of Kenya Iron oxide pigments Market Revenues & Volume By Synthetic for the Period 2022-2032F
- Historical Data and Forecast of Kenya Iron oxide pigments Market Revenues & Volume By Natural for the Period 2022-2032F
- Historical Data and Forecast of Kenya Iron oxide pigments Market Revenues & Volume By Color for the Period 2022-2032F
- Historical Data and Forecast of Kenya Iron oxide pigments Market Revenues & Volume By Red for the Period 2022-2032F
- Historical Data and Forecast of Kenya Iron oxide pigments Market Revenues & Volume By Yellow for the Period 2022-2032F
- Historical Data and Forecast of Kenya Iron oxide pigments Market Revenues & Volume By Black for the Period 2022-2032F
- Historical Data and Forecast of Kenya Iron oxide pigments Market Revenues & Volume By Blends for the Period 2022-2032F
- Historical Data and Forecast of Kenya Iron oxide pigments Market Revenues & Volume By Applications for the Period 2022-2032F
- Historical Data and Forecast of Kenya Iron oxide pigments Market Revenues & Volume By Construction for the Period 2022-2032F
- Historical Data and Forecast of Kenya Iron oxide pigments Market Revenues & Volume By Coatings for the Period 2022-2032F
- Historical Data and Forecast of Kenya Iron oxide pigments Market Revenues & Volume By Plastics for the Period 2022-2032F
- Historical Data and Forecast of Kenya Iron oxide pigments Market Revenues & Volume By Paper for the Period 2022-2032F
- Historical Data and Forecast of Kenya Iron oxide pigments Market Revenues & Volume By Others for the Period 2022-2032F
- Kenya Iron oxide pigments Import Export Trade Statistics
- Market Opportunity Assessment By Product
- Market Opportunity Assessment By Color
- Market Opportunity Assessment By Applications
- Kenya Iron oxide pigments Top Companies Market Share
- Kenya Iron oxide pigments Competitive Benchmarking By Technical and Operational Parameters
- Kenya Iron oxide pigments Company Profiles
- Kenya Iron oxide pigments Key Strategic Recommendations
Kenya Iron oxide pigments Market - Frequently Asked Questions
The market is anticipated to grow from USD 1207 Million in 2025 to USD 1742 Million by 2032, with a CAGR of 5.4% from 2026 to 2032, reflecting robust demand driven by construction and infrastructure development.
The predominant applications include paints, coatings, plastics, and construction materials, where the need for durability and color consistency is critical.
Yes, there is a growing trend towards sustainable and eco-friendly pigments as industries focus on environmentally responsible practices.
Local manufacturers face competition from imported pigments; however, there is potential for growth as awareness of the benefits of domestically produced pigments increases.
The government implements regulations that emphasize environmental sustainability, quality standards, and support for local production, thus fostering a conducive environment for market growth.
6Wresearch actively monitors the Kenya Iron oxide pigments Market and publishes its comprehensive annual report, highlighting emerging trends, growth drivers, revenue analysis, and forecast outlook. Our insights help businesses to make data-backed strategic decisions with ongoing market dynamics. Our analysts track relevent industries related to the Kenya Iron oxide pigments Market, allowing our clients with actionable intelligence and reliable forecasts tailored to emerging regional needs.
Yes, we provide customisation as per your requirements. To learn more, feel free to contact us on sales@6wresearch.com
1 Executive Summary |
2 Introduction |
2.1 Key Highlights of the Report |
2.2 Report Description |
2.3 Market Scope & Segmentation |
2.4 Research Methodology |
2.5 Assumptions |
3 Kenya Iron oxide pigments Market Overview |
3.1 Kenya Country Macro Economic Indicators |
3.2 Kenya Iron oxide pigments Market Revenues & Volume, 2022 & 2032F |
3.3 Kenya Iron oxide pigments Market - Industry Life Cycle |
3.4 Kenya Iron oxide pigments Market - Porter's Five Forces |
3.5 Kenya Iron oxide pigments Market Revenues & Volume Share, By Form, 2022 & 2032F |
3.6 Kenya Iron oxide pigments Market Revenues & Volume Share, By Color, 2022 & 2032F |
3.7 Kenya Iron oxide pigments Market Revenues & Volume Share, By Applications, 2022 & 2032F |
4 Kenya Iron oxide pigments Market Dynamics |
4.1 Impact Analysis |
4.2 Market Drivers |
4.3 Market Restraints |
5 Kenya Iron oxide pigments Market Trends |
6 Kenya Iron oxide pigments Market, By Types |
6.1 Kenya Iron oxide pigments Market, By Product |
6.1.1 Overview and Analysis |
6.1.2 Kenya Iron oxide pigments Market Revenues & Volume, By Product, 2022-2032F |
6.1.3 Kenya Iron oxide pigments Market Revenues & Volume, By Synthetic, 2022-2032F |
6.1.4 Kenya Iron oxide pigments Market Revenues & Volume, By Natural, 2022-2032F |
6.2 Kenya Iron oxide pigments Market, By Color |
6.2.1 Overview and Analysis |
6.2.2 Kenya Iron oxide pigments Market Revenues & Volume, By Red, 2022-2032F |
6.2.3 Kenya Iron oxide pigments Market Revenues & Volume, By Yellow, 2022-2032F |
6.2.4 Kenya Iron oxide pigments Market Revenues & Volume, By Black, 2022-2032F |
6.2.5 Kenya Iron oxide pigments Market Revenues & Volume, By Blends, 2022-2032F |
6.3 Kenya Iron oxide pigments Market, By Applications |
6.3.1 Overview and Analysis |
6.3.2 Kenya Iron oxide pigments Market Revenues & Volume, By Construction, 2022-2032F |
6.3.3 Kenya Iron oxide pigments Market Revenues & Volume, By Coatings, 2022-2032F |
6.3.4 Kenya Iron oxide pigments Market Revenues & Volume, By Plastics, 2022-2032F |
6.3.5 Kenya Iron oxide pigments Market Revenues & Volume, By Paper, 2022-2032F |
6.3.6 Kenya Iron oxide pigments Market Revenues & Volume, By Others, 2022-2032F |
7 Kenya Iron oxide pigments Market Import-Export Trade Statistics |
7.1 Kenya Iron oxide pigments Market Export to Major Countries |
7.2 Kenya Iron oxide pigments Market Imports from Major Countries |
8 Kenya Iron oxide pigments Market Key Performance Indicators |
9 Kenya Iron oxide pigments Market - Opportunity Assessment |
9.1 Kenya Iron oxide pigments Market Opportunity Assessment, By Product, 2022 & 2032F |
9.2 Kenya Iron oxide pigments Market Opportunity Assessment, By Color, 2022 & 2032F |
9.3 Kenya Iron oxide pigments Market Opportunity Assessment, By Applications, 2022 & 2032F |
10 Kenya Iron oxide pigments Market - Competitive Landscape |
10.1 Kenya Iron oxide pigments Market Revenue Share, By Companies, 2025 |
10.2 Kenya Iron oxide pigments Market Competitive Benchmarking, By Operating and Technical Parameters |
11 Company Profiles |
12 Recommendations |
13 Disclaimer |
Global Go To Market Strategy - 2030
Export potential enables firms to identify high-growth global markets with greater confidence by combining advanced trade intelligence with a structured quantitative methodology. The framework analyzes emerging demand trends and country-level import patterns while integrating macroeconomic and trade datasets such as GDP and population forecasts, bilateral import–export flows, tariff structures, elasticity differentials between developed and developing economies, geographic distance, and import demand projections. Using weighted trade values from 2020–2024 as the base period to project country-to-country export potential for 2030, these inputs are operationalized through calculated drivers such as gravity model parameters, tariff impact factors, and projected GDP per-capita growth. Through an analysis of hidden potentials, demand hotspots, and market conditions that are most favorable to success, this method enables firms to focus on target countries, maximize returns, and global expansion with data, backed by accuracy.
By factoring in the projected importer demand gap that is currently unmet and could be potential opportunity, it identifies the potential for the Exporter (Country) among 190 countries, against the general trade analysis, which identifies the biggest importer or exporter.
To discover high-growth global markets and optimize your business strategy:
Click Here
Pricing
- Single User License$ 1,995
- Department License$ 2,400
- Site License$ 3,120
- Global License$ 3,795

Leadership Perspectives from Industry Events
Search
Thought Leadership and Analyst Meet


Our Clients
6WResearch In News
- India Air Conditioner Market Set for Strong Rebound in 2026 After Weather-Led Correction and GST-Driven Recovery: 6Wresearch
- ADAS in India: How Automatic Emergency Braking, Blind Spot Detection & Driver Monitoring are Transforming Road Safety
- Doha a strategic location for EV manufacturing hub: IPA Qatar
- Demand for luxury TVs surging in the GCC, says Samsung
- Empowering Growth: The Thriving Journey of Bangladesh’s Cable Industry
- Demand for luxury TVs surging in the GCC, says Samsung
Latest Reports
- Nicaragua RPG Gaming Market (2026-2032)
- New Zealand RPG Gaming Market (2026-2032)
- Netherlands RPG Gaming Market (2026-2032)
- Nauru RPG Gaming Market (2026-2032)
- Namibia RPG Gaming Market (2026-2032)
- Mozambique RPG Gaming Market (2026-2032)
- Montenegro RPG Gaming Market (2026-2032)
- Mongolia RPG Gaming Market (2026-2032)
- Monaco RPG Gaming Market (2026-2032)
- Micronesia RPG Gaming Market (2026-2032)
Industry Events and Analyst Meet

HIMTEX 2026

India Refining Summit 2026

India EV Show 2026

EV tech India Expo 2026

Auto Tech Asia 2026
Whitepaper
- Middle East & Africa Commercial Security Market Click here to view more.
- Middle East & Africa Fire Safety Systems & Equipment Market Click here to view more.
- GCC Drone Market Click here to view more.
- Middle East Lighting Fixture Market Click here to view more.
- GCC Physical & Perimeter Security Market Click here to view more.